Anatoli Kazharski / 프로필
- 정보
|
14+ 년도
경험
|
0
제품
|
0
데몬 버전
|
|
28
작업
|
0
거래 신호
|
0
구독자
|
DashPlus 는 MetaTrader 5 플랫폼에서 거래 효율성과 효과를 향상시키기 위해 설계된 고급 거래 관리 도구입니다. 리스크 계산, 주문 관리, 고급 그리드 시스템, 차트 기반 도구 및 성과 분석 등 포괄적인 기능을 제공합니다. 주요 기능 1. 리커버리 그리드 불리한 시장 상황에서 거래를 관리하기 위한 평균화 및 유연한 그리드 시스템을 구현합니다. 거래 회복을 최적화할 수 있도록 전략적인 진입 및 종료 포인트를 제공합니다. 2. 스택 그리드 강한 시장 움직임 동안 포지션을 추가하여 유리한 거래에서 잠재적 수익을 극대화하도록 설계되었습니다. 유리한 시장 트렌드에서 승률을 높이며 거래를 확장할 수 있도록 합니다. 3. 손익(P&L) 라인 차트에서 잠재적인 수익 및 손실 시나리오를 시각적으로 표현합니다. 설정을 조정하고 P&L 라인을 드래그하여 실행 전에 다양한 거래 결과를 평가할 수 있습니다. 4. 바스켓 모드 동일한 심볼에 여러 포지션을 단일 집계 포지션으로
뉴스 이벤트 인사이트로 거래를 강화하세요 빠르게 변화하는 거래 세계에서 뉴스 이벤트는 시장 가격에 큰 영향을 미칠 수 있습니다. 이러한 이벤트가 가격 변동에 미치는 영향을 이해하는 것은 변동성이 큰 시기에 거래를 관리하는 데 중요합니다. News Tool EA는 과거 및 향후 뉴스 이벤트에 대한 통찰력을 제공하여 정보에 기반한 거래 결정을 내릴 수 있도록 설계되었습니다. 이 EA는 전략 테스터에서 실행할 수 없습니다. 사용자 가이드 주요 기능: 과거 뉴스 영향 분석 과거 특정 뉴스 이벤트에 대한 가격 움직임이 어떻게 반응했는지 이해하세요. 이벤트가 주로 강세 또는 약세 추세를 따르는지 분석하고, 조정 가능한 시간 프레임을 통해 평균 가격 영향을 포인트 또는 퍼센트로 확인할 수 있습니다. 시각적 그래프를 통해 뉴스 이벤트와 가격 반응을 함께 관찰하여 시장에 대한 더 깊은 통찰을 얻을 수 있습니다. 실시간 뉴스 통합 MT5에서 직접 다가오는 뉴스 이벤트에 대한 실시간 업데이트를
개요 Stats Dashboard를 사용하여 트레이딩 성과를 추적, 분석하고 개선하세요. 일별, 주별, 월별, 맞춤형 등 다양한 기간 동안 주요 통계를 확인할 수 있습니다. 인터랙티브 라인 차트를 사용하여 성과가 좋은 도구와 나쁜 도구를 쉽게 식별할 수 있습니다. EA는 전략 테스터에서 실행되지 않습니다. 무료 체험을 원하시면 메시지를 보내주세요. 표시되는 통계: 수익 - 수익 % 및 총 순수익 $ 거래 - 총 거래 수 및 승리 수 통계 - 수익 계수 및 회복 계수 승률 % 드로우다운 - 자본 DD % 및 잔액 DD % 브로커 수수료 - 총 커미션 및 총 스왑 수수료 총 거래 로트 수 및 평균 거래 기간 시작 잔액 및 현재 잔액 주요 기능 상세한 수익 및 성과 지표 실시간 데이터 분석 일일 요약 보고서 월간 캘린더 보기 특정 알고리즘으로 필터링 (매직 넘버) 실시간 데이터 분석 실시간 트레이딩 데이터에 접근 : 최신 시장 움직임과 트레이딩 성과를 최신 상태로 유지하세요. 실시간 시장
What is Frames Analyzer? This is a plug-in module for any Expert Advisor for analyzing optimization frames during parameter optimization in the strategy tester, as well as outside the tester, by reading an MQD file or a database that is created immediately after parameter optimization. You will be able to share these optimization results with other users who have the Frames Analyzer tool to discuss the results together.

В этот раз создадим систему авторизации в торговом терминале MetaTrader 5 на чистом MQL5. Пользователи приложения смогут зарегистрироваться в системе, предоставив свои учётные данные, чтобы впоследствии можно было авторизоваться и получить доступ, к каким-нибудь данным, которые хранятся в серверной части приложения.

В этой статье создадим систему авторизации через браузерное приложение и через торговый терминал MetaTrader 5. Можно будет зарегистрироваться в системе, указав свои учётные данные.

Разработчики MetaTrader 5 предоставили MQL-сообществу множество технологических решений, что даёт возможность реализовывать сложные программные комплексы, схемы которых могут выходить даже за рамки «песочницы» локального компьютера.
In the first part of the article, I have described a modified ZigZag indicator and a class for receiving data of that type of indicators. Here, I will show how to develop indicators based on these tools and write an EA for tests that features making deals according to signals formed by ZigZag indicator. As an addition, the article will introduce a new version of the EasyAndFast library for developing graphical user interfaces.
Many researchers do not pay enough attention to determining the price behavior. At the same time, complex methods are used, which very often are simply “black boxes”, such as machine learning or neural networks. The most important question arising in that case is what data to submit for training a particular model.

When developing trading algorithms, we often encounter a problem: how to determine where a trend/flat begins and ends? In this article, we try to create a universal indicator, in which we try to combine signals for different types of strategies. We will try to simplify the process of obtaining trade signals in an expert as much as possible. An example of combining several indicators in one will be given.
This is the second part of the article showing the development of a multi-symbol signal Expert Advisor for manual trading. We have already created the graphical interface. It is now time to connect it with the program's functionality.
And the ON_END_CREATE_GUI event is not being triggered, could you give your latest version of EasyAndFastGUI? Thanks!
Despite the fact that many traders still prefer manual trading, it is hardly possible to completely avoid the automation of routine operations. The article shows an example of developing a multi-symbol signal Expert Advisor for manual trading.

In the article, we continue to develop the MQL application for working with optimization results. This time, we will show how to form the table of the best results after optimizing the parameters by specifying another criterion via the graphical interface.

This is a continuation of the idea of processing and analysis of optimization results. This time, our purpose is to select the 100 best optimization results and display them in a GUI table. The user will be able to select a row in the optimization results table and receive a multi-symbol balance and drawdown graph on separate charts.

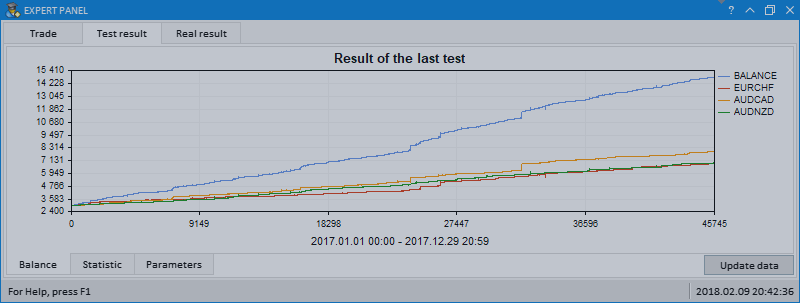
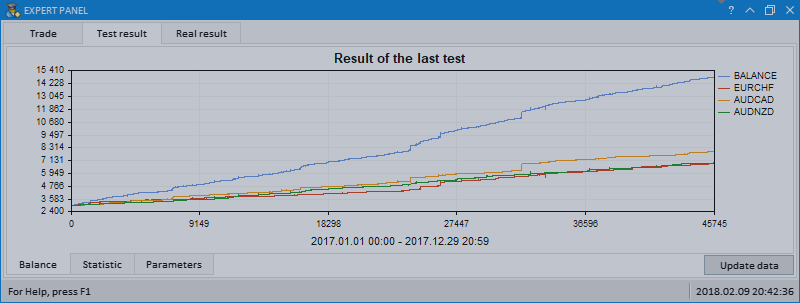
The article provides an example of an MQL application with its graphical interface featuring multi-symbol balance and deposit drawdown graphs based on the last test results.


The article implements an MQL application with a graphical interface for extended visualization of the optimization process. The graphical interface applies the last version of EasyAndFast library. Many users may ask why they need graphical interfaces in MQL applications. This article demonstrates one of multiple cases where they can be useful for traders.

A new version of the graphics library for creating scientific charts (the CGraphic class) has been presented recently. This update of the developed library for creating graphical interfaces will introduce a version with a new control for creating charts. Now it is even easier to visualize data of different types.
In this update of the library, the Table control (the CTable class) will be supplemented with new options. The lineup of controls in the table cells is expanded, this time adding text edit boxes and combo boxes. As an addition, this update also introduces the ability to resize the window of an MQL application during its runtime.


