Smart Order Block Indicator
- インディケータ
- バージョン: 6.0
- アップデート済み: 30 5月 2026
- アクティベーション: 5

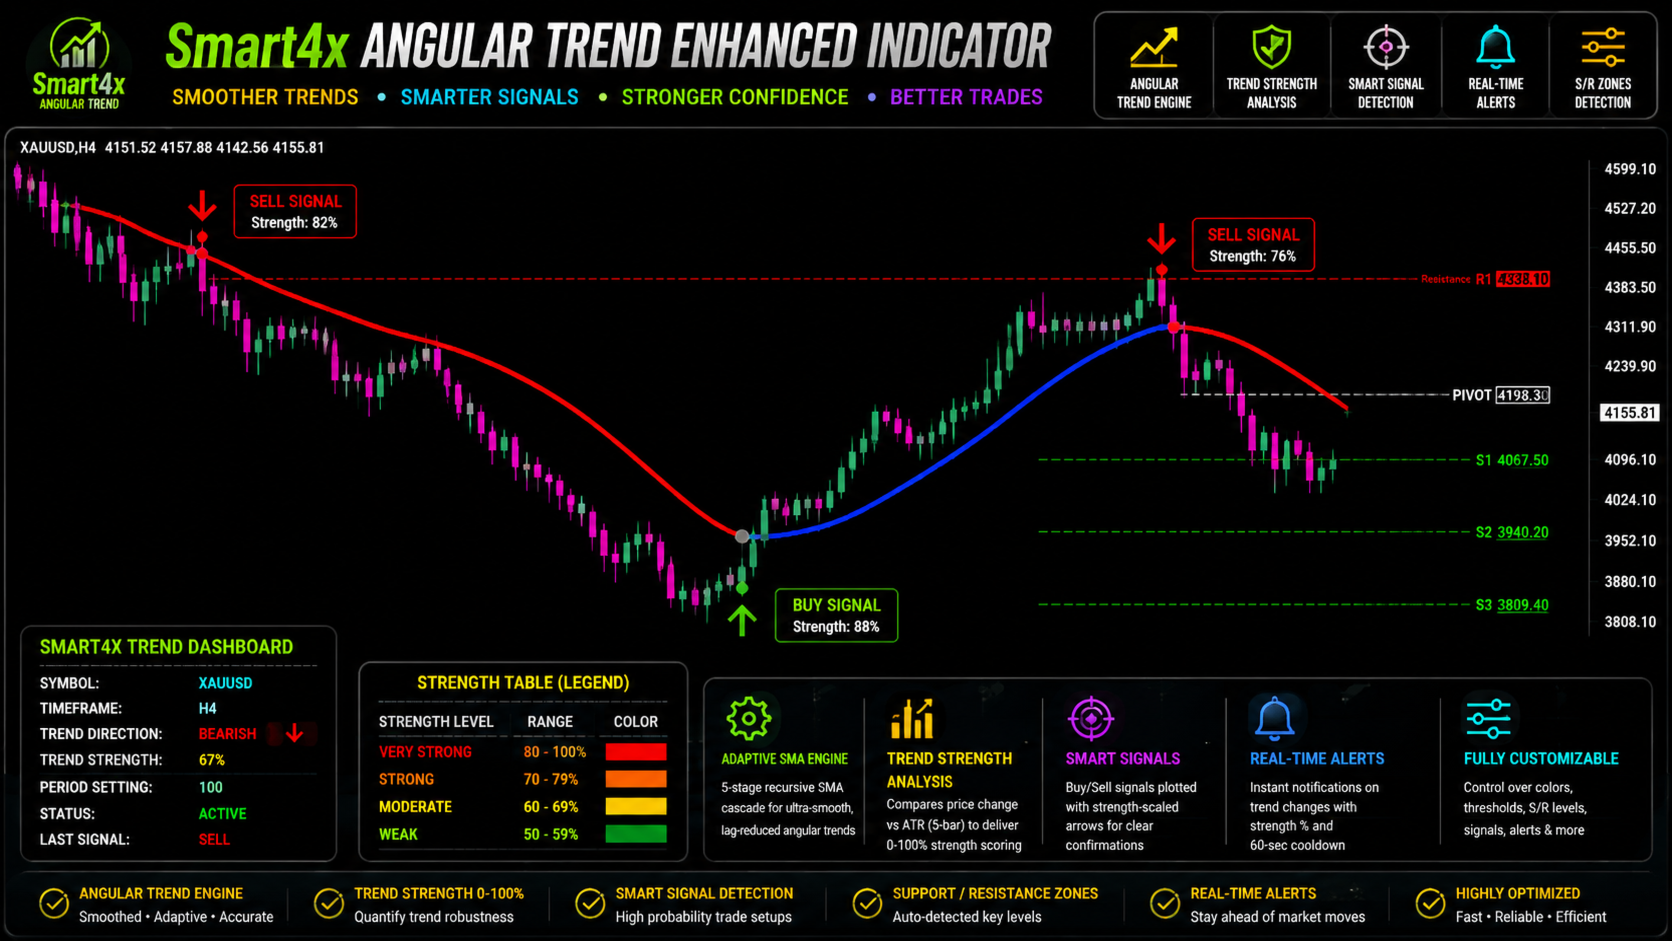
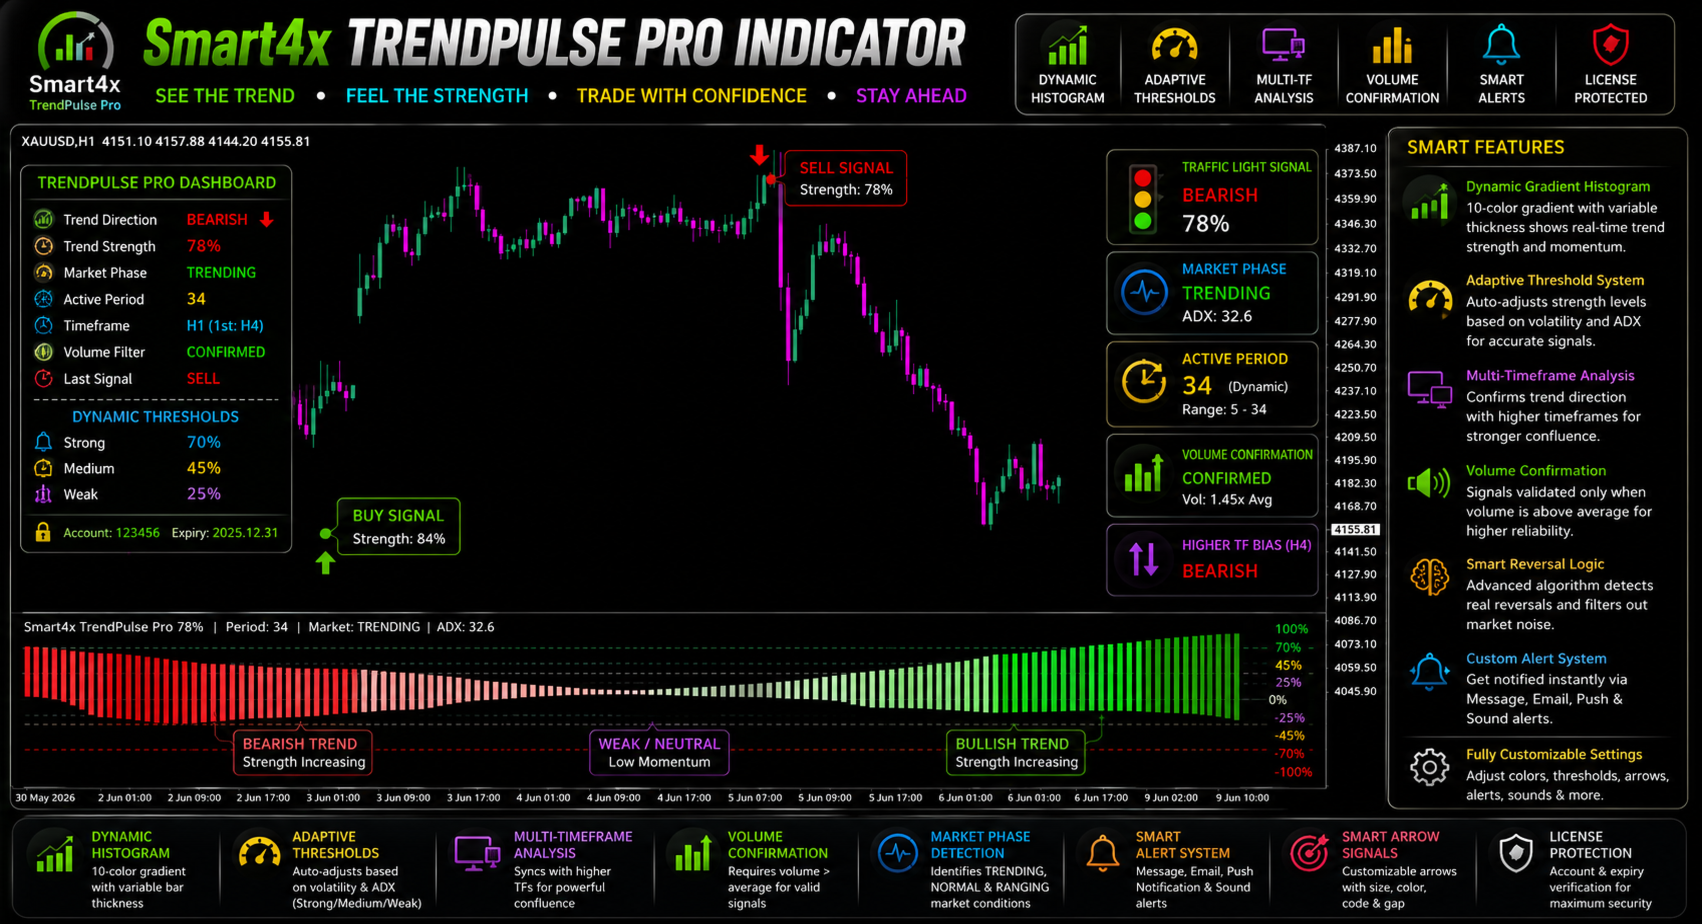
Advanced Smart Money Concepts (SMC) Indicator with Quality Scoring, Fibonacci Confluence & Multi-Timeframe Analysis
The Ultimate Smart Money Trading Tool for Forex, Crypto, Indices, and Commodities
Brand: Smart4x
Version: 6.0
Type: MT4 Indicator
Overview
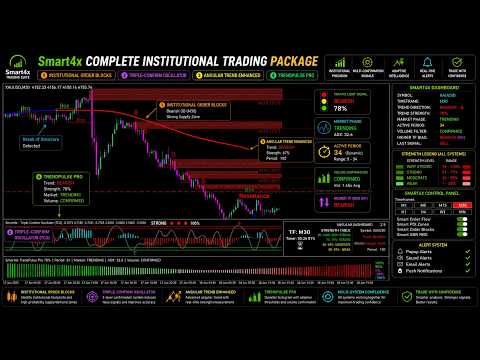
Smart4x Institutional Order Blocks v6.0 is a next-generation Smart Money Concepts indicator designed to scout, score, and filter institutional-grade order blocks with unparalleled precision. Built for serious traders who follow "Smart Money" and "ICT" methodologies, this tool goes beyond simple zone plotting by introducing Quality Scoring, Fibonacci Confluence filters, and optimized performance caching.
Identify where institutions are building positions, track Breaks of Structure (BOS), and receive real-time alerts when price retests these key zones.
What Is An Institutional Order Block?
In Smart Money Concepts (SMC) methodology, an Order Block is a price zone where institutions (banks, hedge funds, market makers) have placed large pending orders (buy or sell stops/limits).
-
Bullish Order Block: The last bearish candle before a strong bullish move – where institutions accumulated long positions.
-
Bearish Order Block: The last bullish candle before a strong bearish move – where institutions accumulated short positions.
Smart4x Institutional Order Blocks v6.0 automatically detects these zones and scores them based on freshness, imbalance, and sweep confirmation.
Key Features
Institutional Order Block Detection
-
Automatically identifies Bullish & Bearish Order Blocks based on Market structure.
-
Detects Pattern Breaks and Direct Breaks of Structure (BOS).
-
Visualizes order blocks as clear rectangles with configurable extensions.
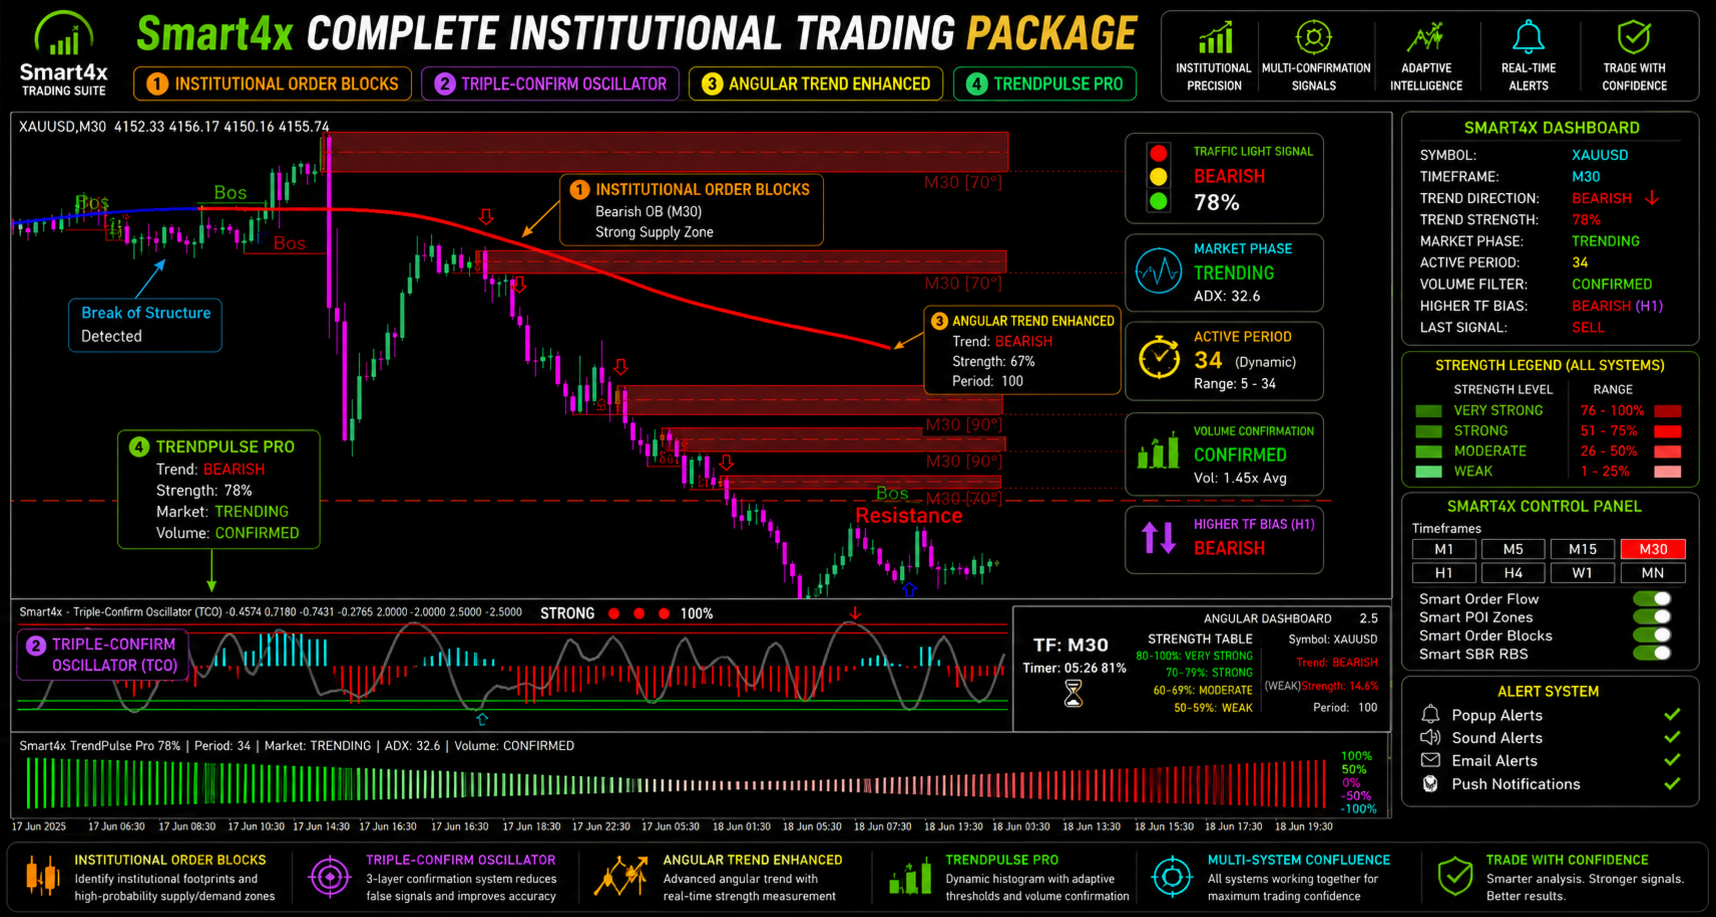
Quality Scoring System (New in v6.0)
-
Each order block receives a dynamic Quality Score (0-100) based on:
-
Imbalance (Gap) Size: Large gaps score higher.
-
Freshness: Untested zones receive a bonus.
-
Sweep Confirmation: Price sweeps add conviction.
-
-
Color-coded blocks:
-
High Quality (≥80): Lime (Buy) / Red (Sell)
-
Medium Quality (60-79): Yellow (Buy) / Orange (Sell)
-
Low Quality (<60): Orange (Buy) / Gray (Sell)
-
-
Minimum Score Filter: Display only blocks that meet your quality threshold.
Fibonacci Confluence Filter
-
Automatically checks if order blocks align with key Fibonacci levels (0.5, 0.618, 0.786, 0.886, -0.618).
-
Highlight confluence zones with special colors (Lime Green for Buy, Orange for Sell).
-
Configurable lookback bars and confluence distance in pips.
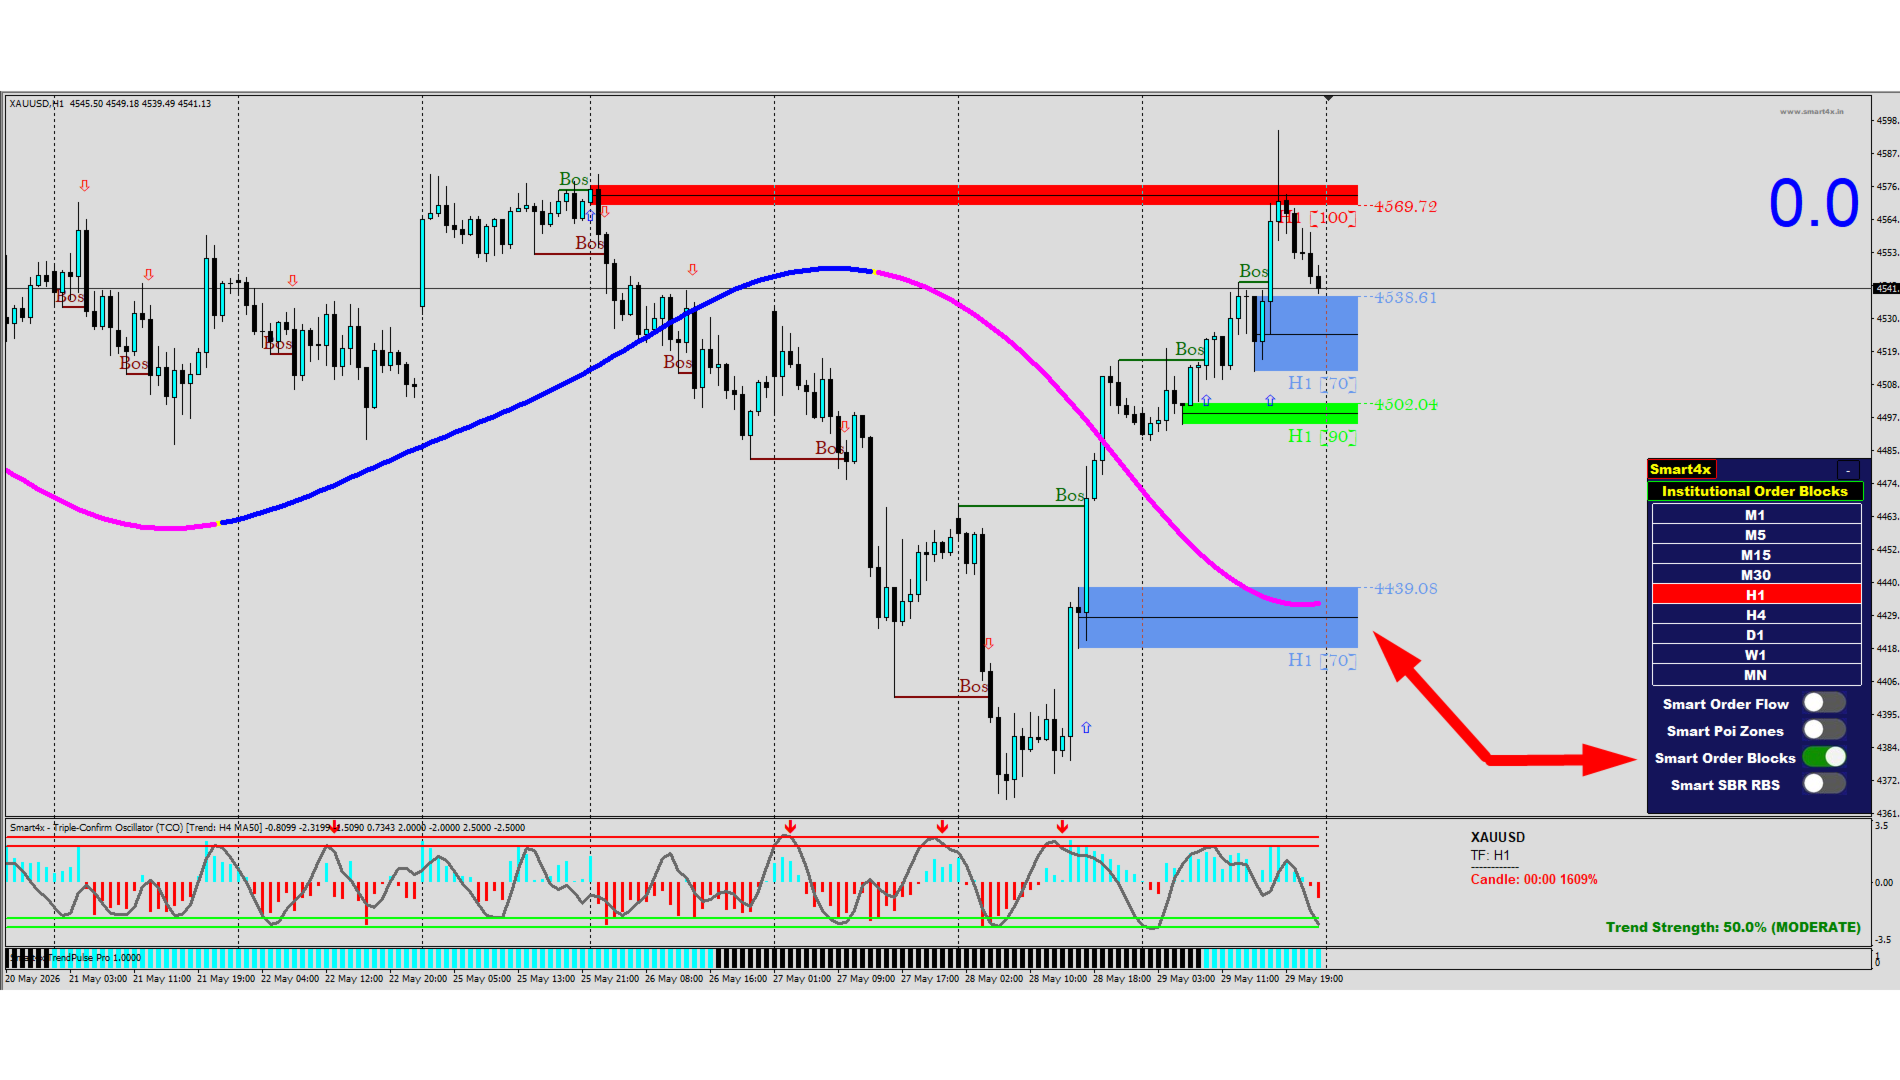
Multi-Timeframe (MTF) Analysis
-
Monitor order blocks from M1 to MN directly on your current chart.
-
Interactive panel to toggle timeframes on/off.
-
Higher timeframe boxes are drawn with distinct colors and widths for easy identification.
Alerts & Notifications
-
Break of Structure (BOS) alerts (Bullish/Bearish).
-
Zone Retest Alerts – Get notified when price returns to an order block.
-
Supports Popup, Email, and Push Notification alerts.
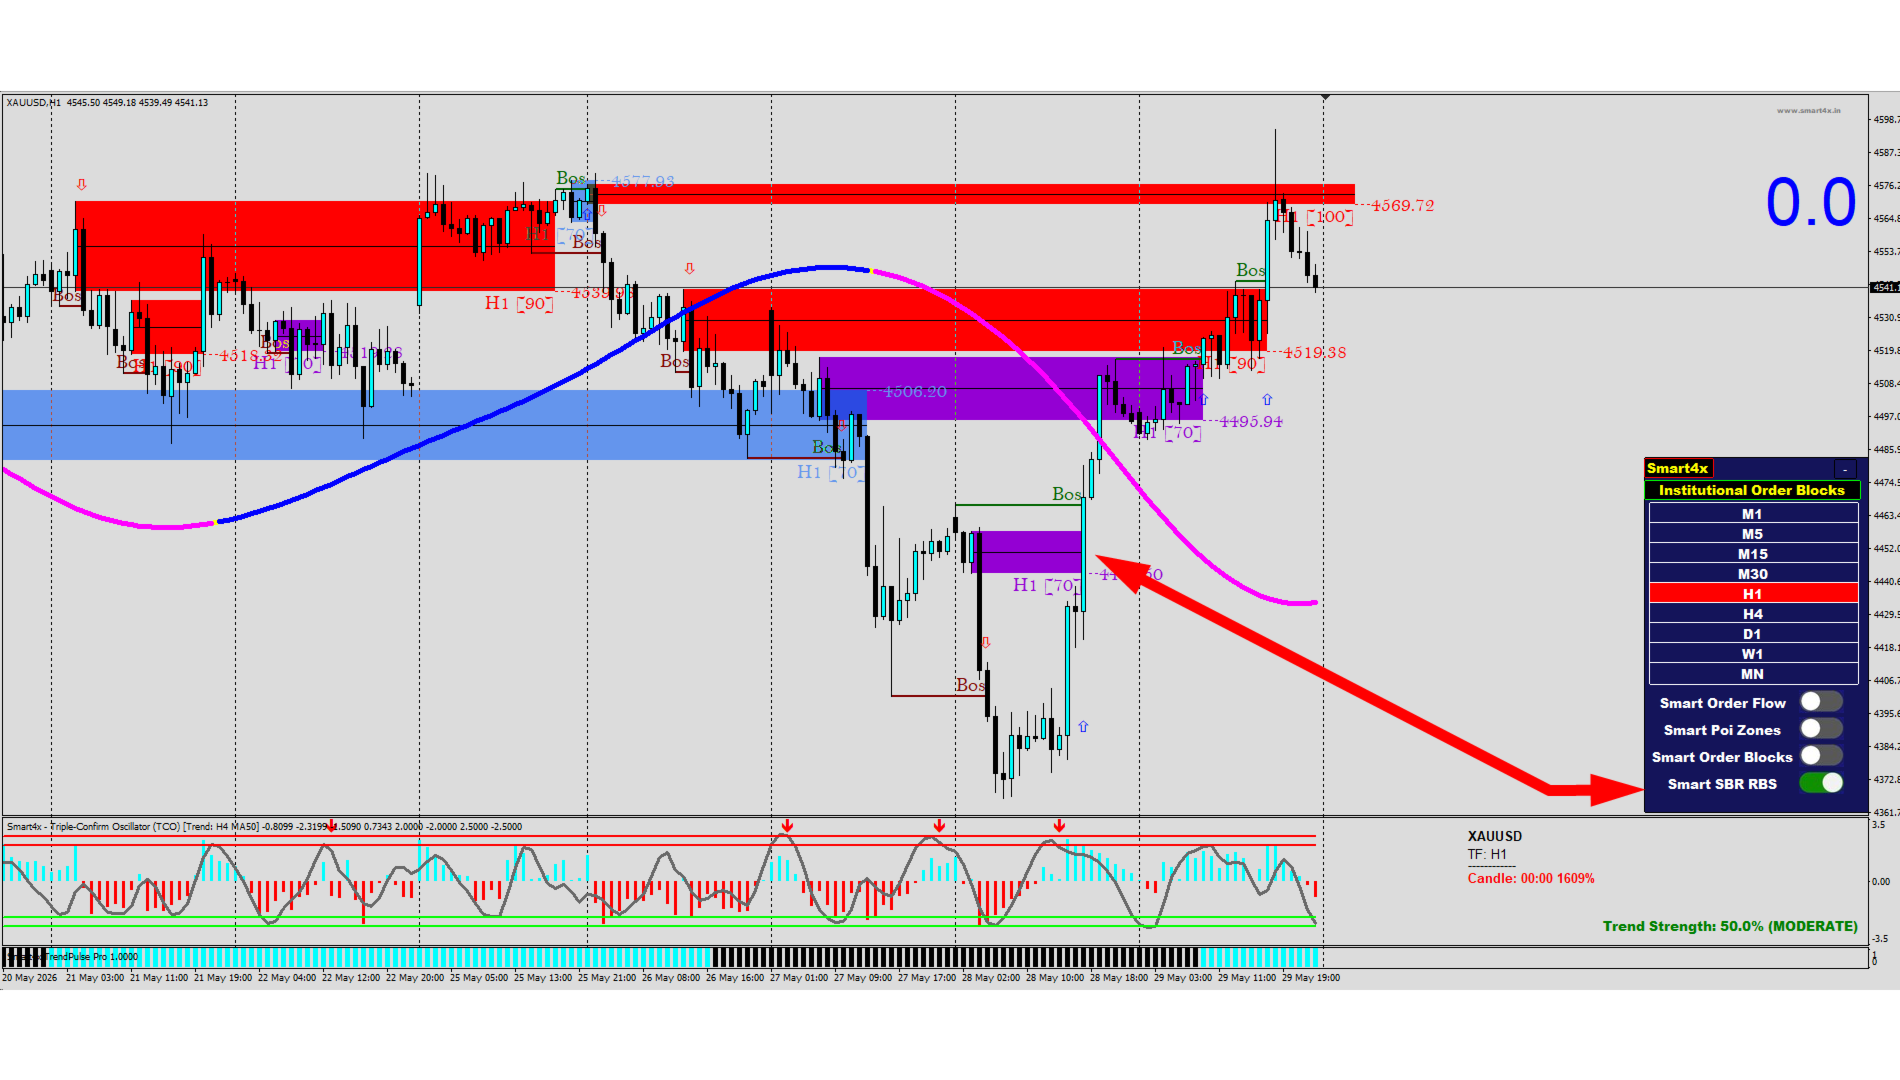
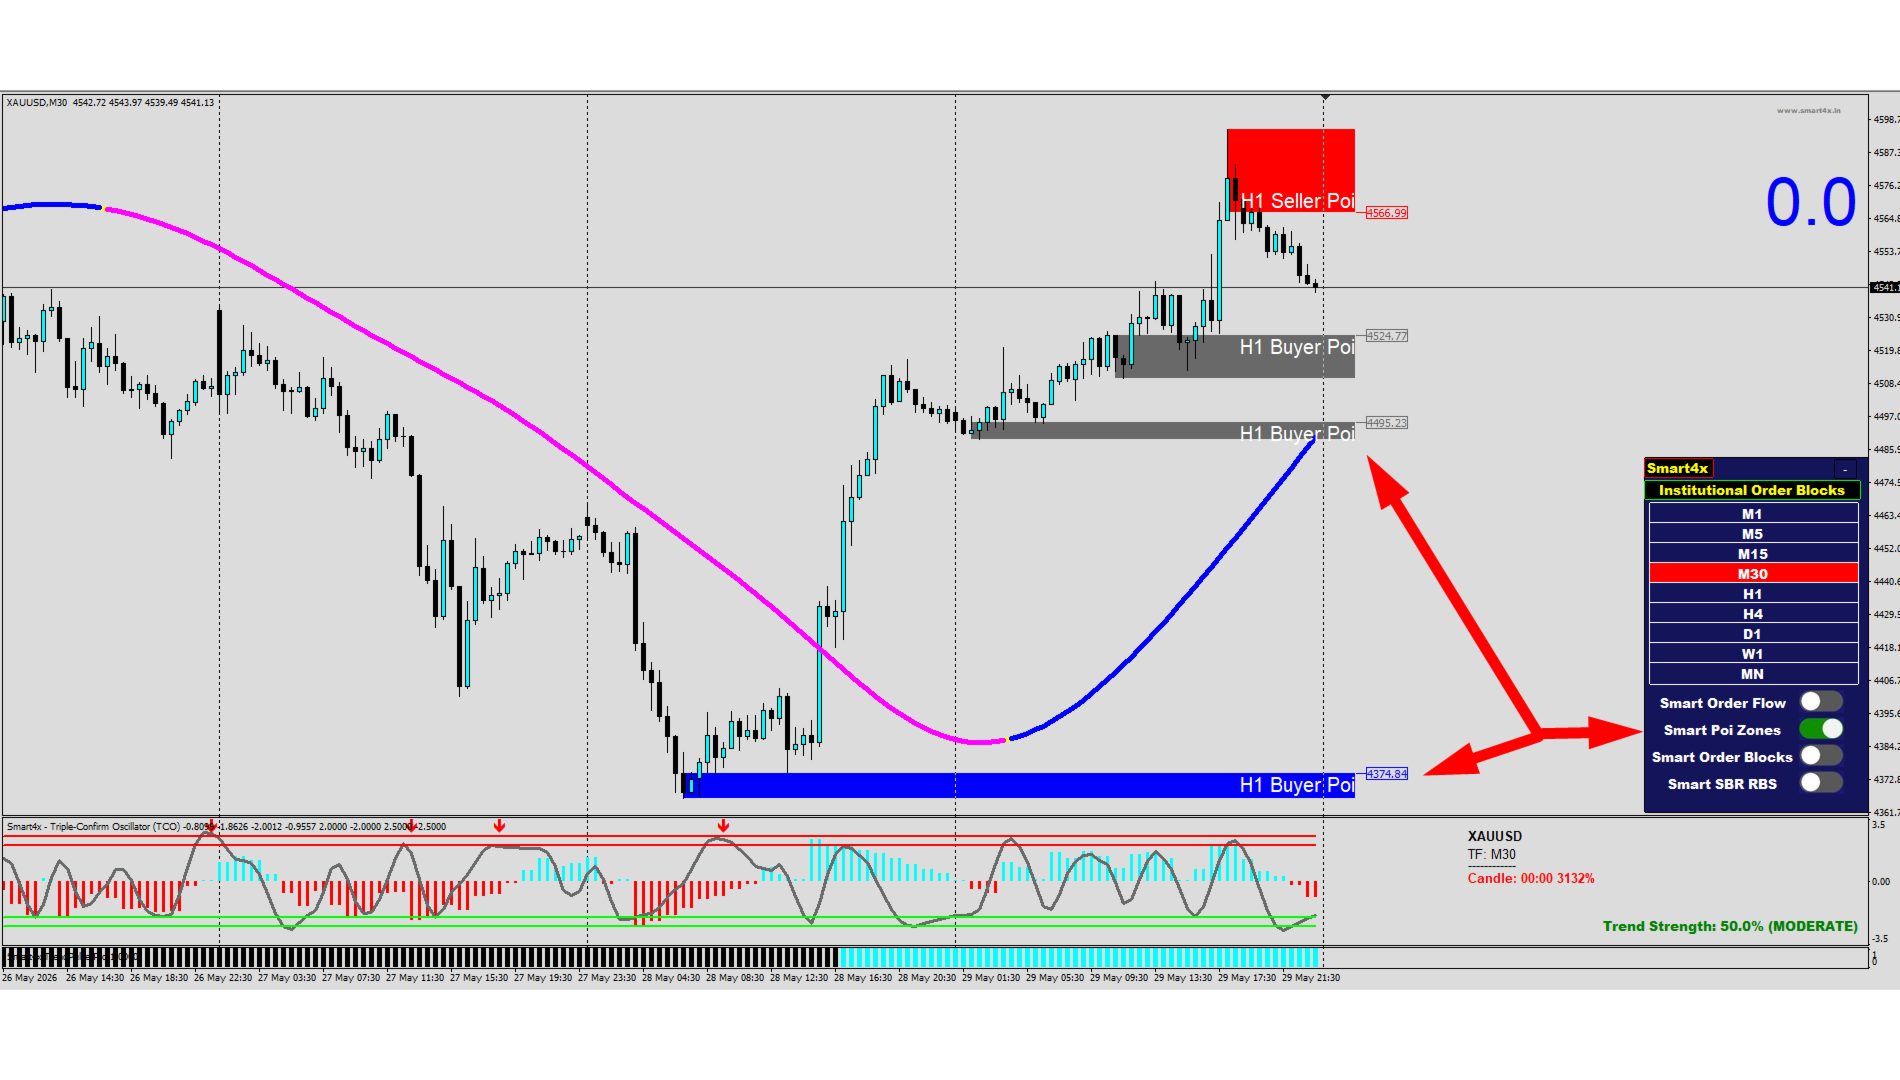
Smart POI Zones (Support & Resistance)
-
Built-in supply/demand zone detection using Swings.
-
Adjustable zone strength, retouch detection, and visual styling.
-
Displays "Buyer POI" and "Seller POI" labels directly on the chart.
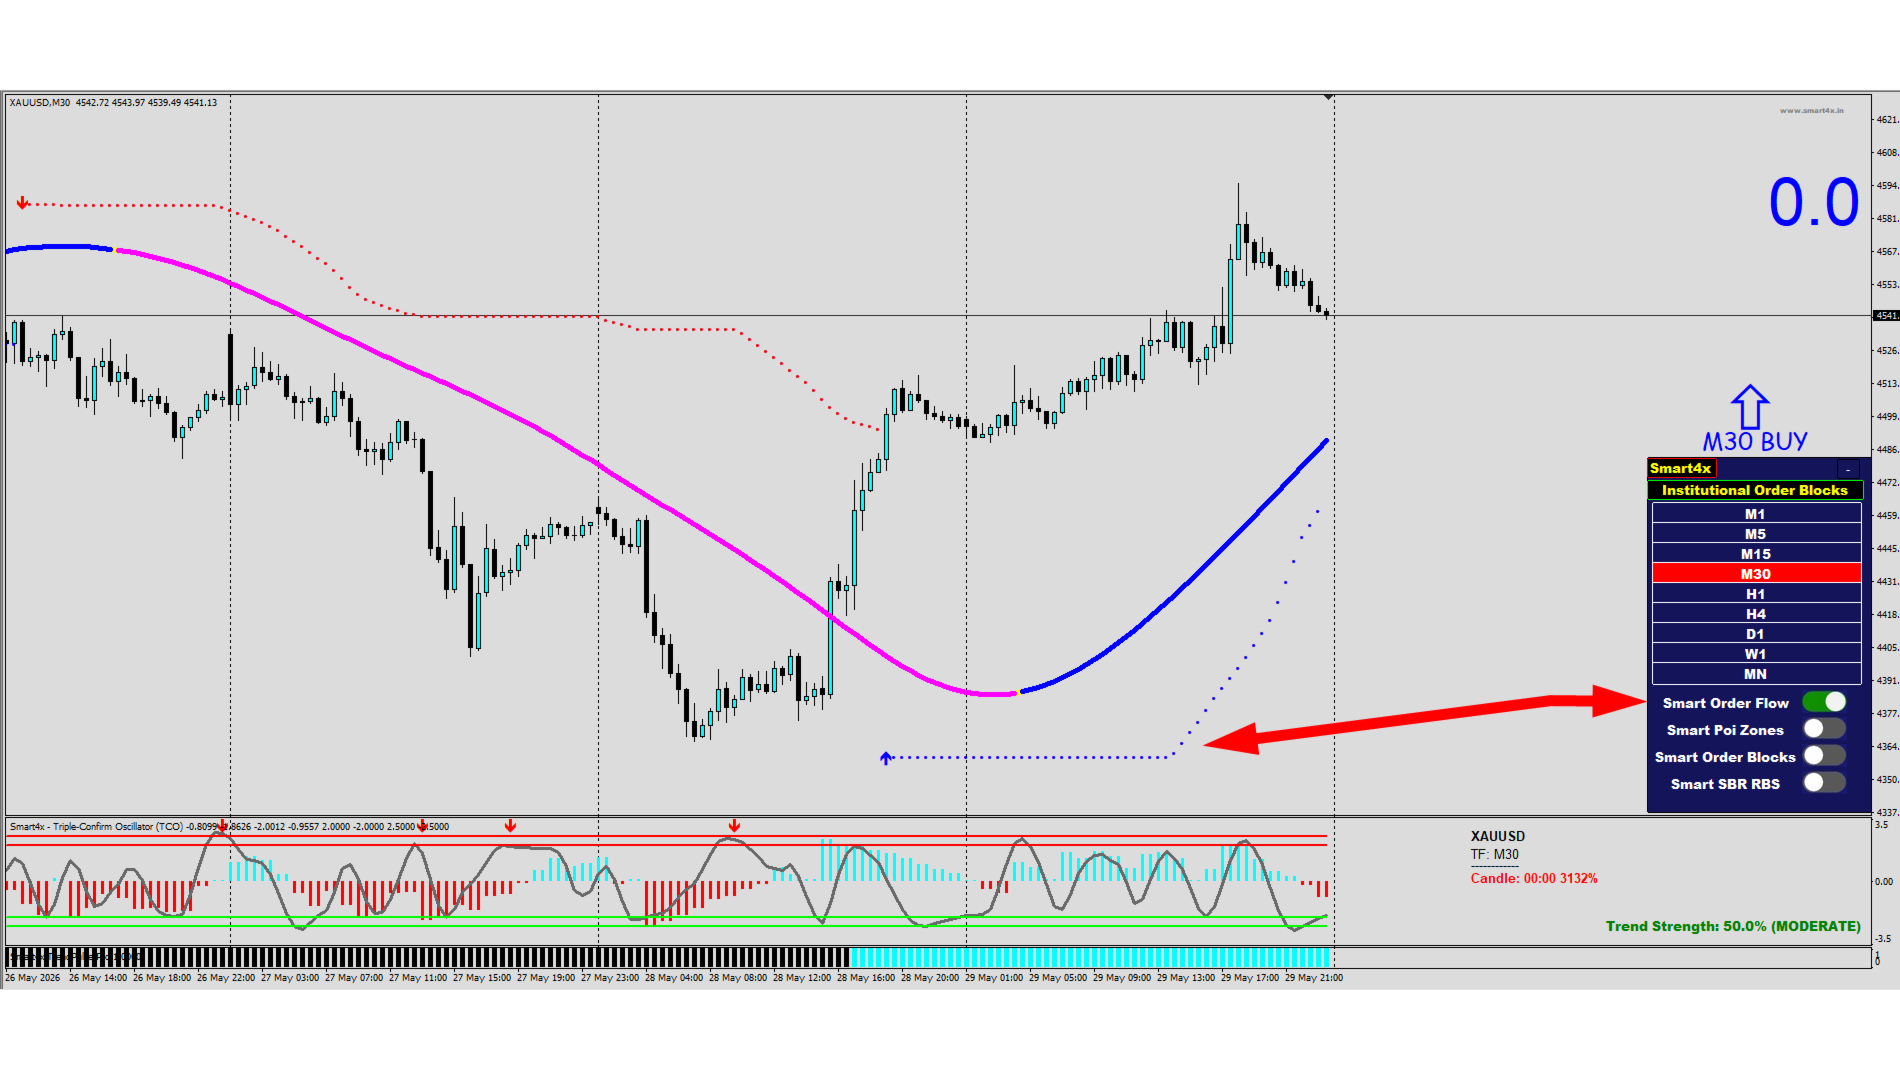
Smart Order Flow (Trend Tracing)
-
A secondary trend-following system based on Neural Network.
-
Generates additional buy/sell signals and trend arrows.
Visual Interface
-
Collapsible Control Panel: Toggle indicators (Order Blocks, POI Zones, Order Flow) with one click.
-
Timeframe Buttons: Instantly enable/disable MTF analysis.
-
Quality Score Display: Scores are shown next to each order block label (e.g., H4 [85] ).
-
Clean Rectangles & Lines: Customizable colors, widths, and styles.
Performance Optimizations (v6.0)
-
Quality Score Caching: Reduces redundant calculations, improving chart responsiveness.
-
Limited Search Ranges: Zone freshness and sweep checks are optimized to use only recent bars.
-
Configurable Candle Limit: Restrict back-calculation to the last N candles for faster loading.
How to Trade with Smart4x Institutional Order Blocks v6.0
Bullish Setup (Buy)
-
Wait for a Bullish Order Block to appear (score ≥80 recommended).
-
Confirm Fibonacci Confluence (optional but recommended).
-
Wait for price to retest the order block (zone retest alert).
-
Look for bullish confirmation (candlestick pattern, BOS, etc.).
-
Enter long with stop loss below the order block.
Bearish Setup (Sell)
-
Wait for a Bearish Order Block to appear (score ≥80 recommended).
-
Confirm Fibonacci Confluence.
-
Wait for price to retest the order block.
-
Look for bearish confirmation.
-
Enter short with stop loss above the order block.
Smart4x Institutional Order Blocks v6.0 is not just another SMC indicator. It brings institutional-grade filtering, quality scoring, and Fibonacci confluence into a single, optimized package. Whether you are trading forex, indices, or commodities, this tool helps you focus on high-probability setups while ignoring noise.
Upgrade your Smart Money trading today.
Please send me Direct message on MQL5 CHAT after purchasing the Indicator for Training and Installation Support
There are some additional files that is important to use with the Indicator . So be sure to contact me after purchasing the Indicator So that I can add you for training and support .
If you find any difficulty with installation then send me Direct message here So that I can connect with you via Anydesk or Teamview for the product installation.


Kupilem wskaznik czy dostane dodatkowe wskazniki