AQ Pattern Explorer
- インディケータ
-
HIT HYPERTECH INNOVATIONS LTD
 We are a team of experts in Artificial Intelligence, Computational Finance & Finance with more than 25 years trading experience each, having worked in Hedge funds, big corporations, research institutes & academia. We operate from London, New York, Athens, Cyprus & are incorporated in Cyprus.
 - バージョン: 1.2
- アップデート済み: 15 3月 2019
Pattern Explorer is a reliable tool for applying all the power of the most popular Japanese Candlestick Patterns. It uses Machine Learning algorithms to confirm all the patterns.
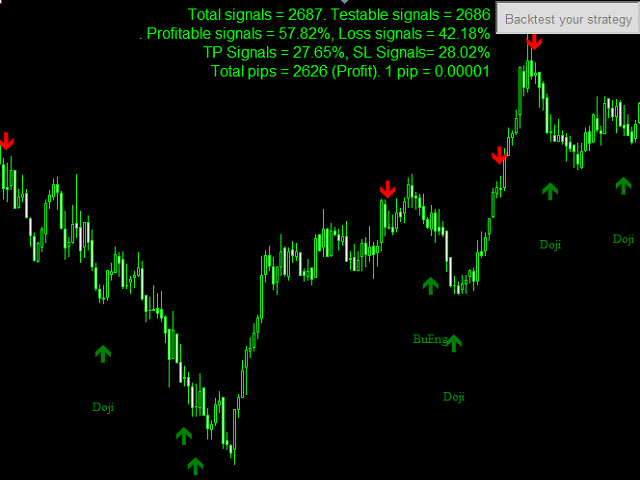
What is the most impressive thing about it? Select Take Profit and Stop Loss and click on “Backtest your strategy” button to backtest your strategy in real time and to see according to your selection:
- Total signals
- Testable signals (signals that are reliable to be tested)
- Profitable signals (%)
- Loss signals (%)
- Total pips that your strategy would return (pip has a value applicable on each instrument)
Patterns that have been implemented in Candlestick Patterns indicator are shown at the indicators parameters.
Parameters
- ArrowDistanceUp – distance in pips from a bar of an UP arrow signal
- ArrowDistanceDown – distance in pips from a bar of a DOWN arrow signal
- BullishColor – UP signal arrows
- BearishColor – DOWN signal arrows
- FontSize – font size of the text
- TextColor – color of the text
- StopLossPoints – Stop Loss in points for backtesting
- TakeProfitPoints – Take Profit in points for backtesting
- ShowDoji – true/false (Doji pattern)
- ShowGravestoneDoji – true/false (Gravestone Doji pattern)
- ShowDragonflyDoji – true/false (Dragonfly Doji pattern)
- ShowHammer – true/false (Hammer pattern)
- ShowHangingMan – true/false (Hanging Man pattern)
- ShowInvertedHammer – true/false (Inverted Hammer pattern)
- ShowBullishEngulfing – true/false (Bullish Engulfing pattern)
- ShowBearishEngulfing – true/false (Bearish Engulfing pattern)
- ShowDarkCloudCover – true/false (Dark Cloud Cover pattern)
- ShowPiercing – true/false (Piercing pattern)
- ShowMorningStar – true/false (Morning Star pattern)
- ShowEveningStar – true/false (Evening Star pattern)
- ShowThreeInsideUp – true/false (Three Inside Up pattern)
- ShowThreeOutsideUp – true/false (Three Outside Up pattern)
- ShowThreeInsideDown – true/false (Three Inside Down pattern)
- ShowThreeOutsideDown – true/false (Three Outside Down pattern)
- ShowThreeWhiteSoldiers – true/false (Three White Soldiers pattern)
- ShowLadderBottom – true/false (Three Ladder Bottom pattern)
- ShowThreeStarsInTheSouth – true/false (Three Stars In The South pattern)
- ShowBullishTristar – true/false (Bullish Tristar pattern)
- ShowBearishTristar – true/false (Bearish Tristar pattern)
- ShowBullishBelthold – true/false (Bullish Belthold pattern)
- ShowBearishBelthold – true/false (Bearish Belthold pattern)
- ShowWhiteMarubozu – true/false (White Marubozu pattern)
- ShowBlackMarubozu – true/false (Black Marubozu pattern)
- ShowBlackClosingMarubozu – true/false (Black Closing Marubozu pattern)
- ShowWhiteClosingMarubozu – true/false (White Closing Marubozu pattern)
- ShowBlackOpeningMarubozu – true/false (Black Opening Marubozu pattern)
- ShowWhiteOpeningMarubozu – true/false (White Opening Marubozu pattern)
- ShowTweezersBottom – true/false (Tweezers Bottom pattern)
- ShowTweezersTop – true/false (Tweezers Top pattern)
- ShowBullishHarami – true/false (Bullish Harami pattern)
- ShowBearishHarami – true/false (Bearish Harami pattern)
- ShowBullishHaramiCross – true/false (Bullish Harami Cross pattern)
- ShowBearishHaramiCross – true/false (Bearish Harami Cross pattern)
- ShowFallingThreeMethods – true/false (Falling Three Methods pattern)
- ShowBullishThreeLineStrike – true/false (Bullish Three Line Strike pattern)
- ShowBearishThreeLineStrike – true/false (Bearish Three Line Strike pattern)
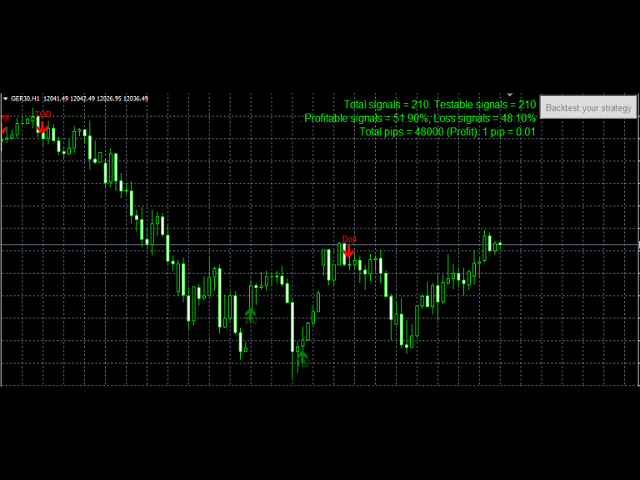
You can easily see arrows on the applicable candlestick patterns with a short description text, so you can understand each pattern. Also, you can see the backtesting results, which in our example are:
- Total signals that appeared based on our selection: 210
- Total testable signals: 210
- Profitable signals: 51.90%
- Loss signals: 48.10%
- Total pips that the user would make on the usage of the specific selection: 48 000 in profit. Since the applied instrument is the Indice GER30 (DAX) and just because 1 pip = 0.01 points on GER30, it means that the selected strategy would produce 480 points in profit!


Work Fine,