Clever TDI Pro
- インディケータ
-
Carlos Forero
 私は、資本市場およびアルゴリズムによるポートフォリオ構築において10年以上の経験を持つ、プロの開発者およびトレーダーです。MetaTrader向けの高度な自動化システムとテクニカル分析ツールの開発を専門としています。
⚙️ 開発哲学
私のアプローチは厳密に定量的かつデータ主導型です。市場のノイズを排除し、真の統計的優位性を提供するようにシステムを設計しています。近道を探すのではなく、数学と論理を取引に応用しています。
🔷 私のツールに期待できること
✅ 機関投資家レベルの品質: 最高水準のプログラミング基準で構築されたインジケーターとエキスパートアドバイザー(EA)。 - バージョン: 2.93
- アップデート済み: 13 3月 2025
- アクティベーション: 5
Description:
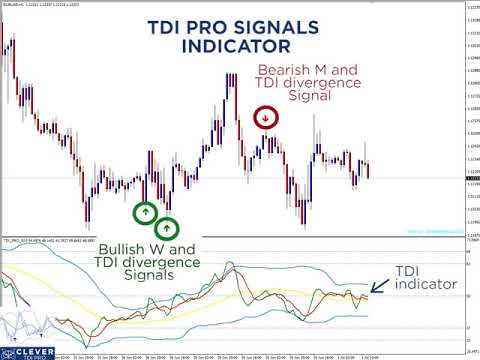
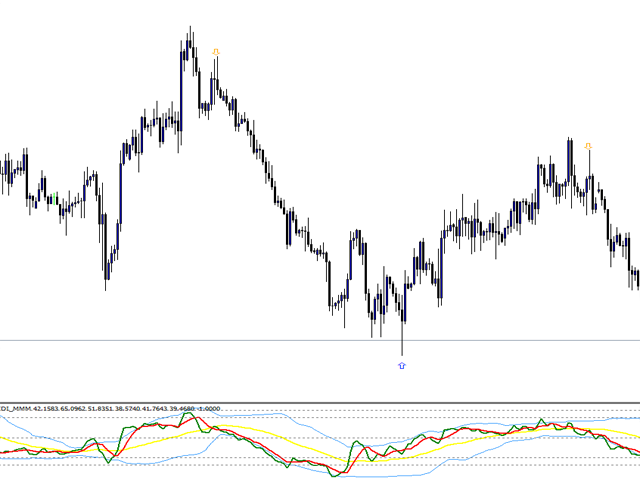
The indicator shows the TDI indicator in a separate window, and with the RSI component, the indicator finds possible divergences with M or W patterns.
KEY LINKS: How to Install - Frequent Questions - All Products
Functions:
- Finds Market Makers patterns.
- Finds extremes or exhaustion into the market.
- Looks for a trend continuation.
Content:
- TDI Indicator
- Divergence and M or W Signals
About Author:
Carlos Forero, Member of Clever Trading Club, private organization with the purpose of design clever solutions to generate constant profits with adapted risk.


ユーザーは評価に対して何もコメントを残しませんでした