Clever Order Blocks

5

Description

Very precise patterns to detect: entry signals as well as breakout, support and resistance reversal patterns. It points out zones in which, with a high probability, institutional orders with the potential to change the price’s direction and keep moving towards it, have been placed. 

KEY LINKS: Indicator Manual – How to Install  – Frequent Questions All Products 

How is this indicator useful?

  • It will allow you to trade on the order’s direction, once its direction has been identified.
  • It will allow you to trade retracement or breakout patterns, everytime they occur in a given zone.
  • You’ll be able to identify potential resistance or support levels. Be mindful that you can use these levels as take profit zones.
  • You’ll be able to combine this indicator with trend and market maker patterns. In order to identify these patterns.
Note 1: This indicator should only be considered as a part of any trading strategy. You should complement this with other filters (e.g trend, volatility, time, etc). Note 2: This indicator is meant to serve as a guide to apply in your intraday trading. Overtime, this will help you understand the baseline for a solid and consistent trading strategy.  

Components

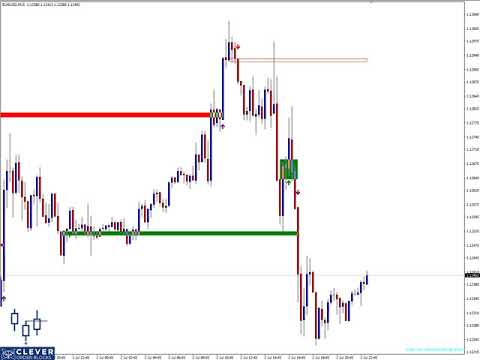
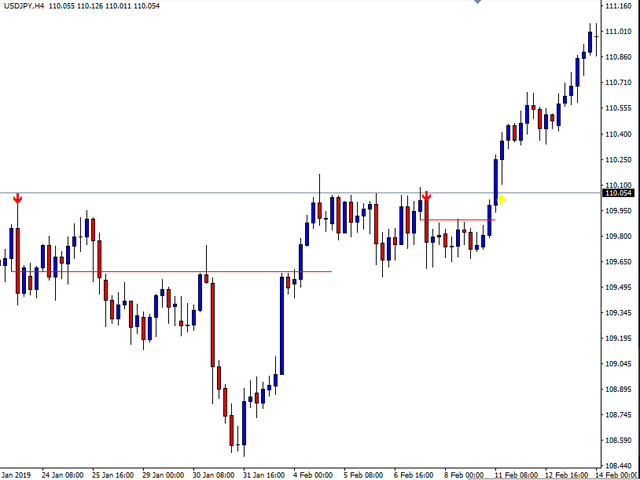
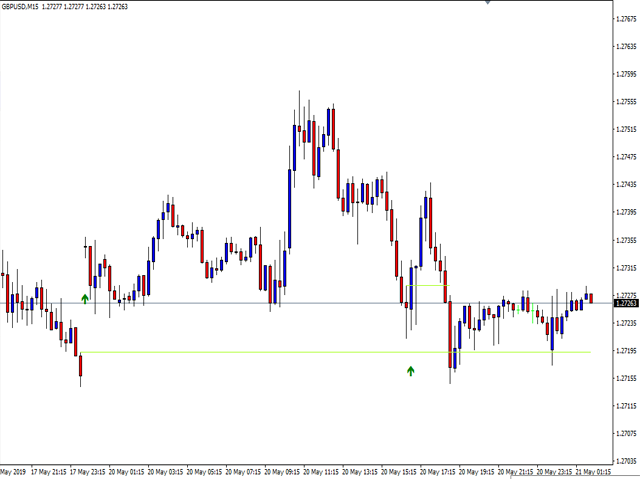
  • Horizontal green lines: These represent bullish order blocks.
  • Horizontal red lines: These represent bearish order blocks.
  • Green, red Arrows: Bullish or Bearish signal of recent OB Formed
  • Yellow Arrows: Bullish or Bearish signal of Breakout of OB.

About Author:

Carlos Forero, Member of Clever Trading Club, private organization with the purpose of design clever solutions to generate constant profits with adapted risk.


レビュー 2
turky7713
466
turky7713 2021.03.20 11:18 
 

I was renting for three months, but I notice very few buy and sell signals This can be modified

Aravind Kolanupaka
9914
Aravind Kolanupaka 2019.06.16 00:12 
 

Good. Do not trade arrow to arrow as signals, use it along with your strategy.

おすすめのプロダクト
BONUS INDICATOR HERE :  https://linktr.ee/ARFXTools Trading Flow Using Fibo Eminence Signal 1️⃣ Wait for the Fibonacci to Auto-Draw The system automatically detects swings (from high to low or vice versa) Once the Fibonacci levels appear, the indicator sends an alert notification “Fibonacci detected! Zone is ready.” 2️⃣ Check the Entry Zone Look at the ENTRY LINE (blue zone) This is the recommended SELL entry area (if the Fibonacci is drawn from top to bottom) Wait for the price to enter
VR Cub
Vladimir Pastushak
VR Cub は、質の高いエントリーポイントを獲得するためのインジケーターです。このインジケーターは、数学的計算を容易にし、ポジションへのエントリーポイントの検索を簡素化するために開発されました。このインジケーターが作成されたトレーディング戦略は、長年にわたってその有効性が証明されてきました。取引戦略のシンプルさはその大きな利点であり、初心者のトレーダーでもうまく取引することができます。 VR Cub はポジション開始ポイントとテイクプロフィットとストップロスのターゲットレベルを計算し、効率と使いやすさを大幅に向上させます。取引の簡単なルールを理解するには、以下の戦略を使用した取引のスクリーンショットを見てください。 設定、設定ファイル、デモ版、説明書、問題解決方法は、以下から入手できます。 [ブログ] レビューを読んだり書いたりすることができます。 [リンク] のバージョン [MetaTrader 5] エントリーポイントの計算ルール ポジションをオープンする エントリーポイントを計算するには、VR Cub ツールを最後の高値から最後の安値までストレッチする必要があります。 最初
"The trend is your friend" is one of the best known sayings in investing, because capturing large trendy price movements can be extremely profitable. However, trading with the trend is often easier said than done, because many indicators are based on price reversals not trends. These aren't very effective at identifying trendy periods, or predicting whether trends will continue. We developed the Trendiness Index to help address this problem by indicating the strength and direction of price trend
The Trend Map indicator is designed to detect trends in price movement and allows you to quickly determine not only the direction of the trend, but also to understand the levels of interaction between buyers and sellers. It has no settings and therefore can be perceived as it signals. It contains only three lines, each of which is designed to unambiguously perceive the present moment. Line # 2 characterizes the global direction of the price movement. If we see that the other two lines are above
「Naturu(ナチュル)」は自然の対称性をアルゴリズムとして用いる手動インジケーターです。 シンプルな戦略と隠された知恵でマーケットを制覇しましょう! インジケーターを読み込むと、上側(Top)と下側(Bottom)の2本のラインが表示されます。 ラインを一度クリックするとアクティブ化され、移動させたいローソク足をクリックするだけでその位置に移動できます。 高値ポイントと安値ポイントを設定すると、インジケーターが自動的に以下を計算します: マゼンタのゾーン:ブル(買い勢)とベア(売り勢)の関心が最も接近する、サポート/レジスタンスになりやすいエリア グレーのゾーン:次に注目されるエリア アクア色のライン:ブルの価格目標 ゴールド色のライン:ベアの価格目標 手動インジケーターは完全なコントロールと柔軟性を提供し、リアルタイムの相場状況や個人の直感に応じてラインを調整できます。 価格の動きを自ら深く分析することで、サポートやレジスタンス、チャートパターンの形成を本質的に理解できます。 人間の判断を活かすことで、自動システムが誤認しがちなノイズを除去し、誤シグナルを減らします。 また、自
If you do not have your own trading strategy yet, you can use our ready-made trading strategy in the form of this indicator. The Your Trends indicator tracks the market trend, ignoring sharp market fluctuations and noise around the average price. The indicator is based on price divergence. Also, only moving averages and a special algorithm are used for work. It will help in finding entry points in the analysis and shows favorable moments for entering the market with arrows. Can be used as a fi
Indicator without redrawing Divergent MAX The DivirgentMAX indicator is a modification based on the MACD. The tool detects divergence based on OsMA and sends signals to buy or sell (buy|sell), taking into account the type of discrepancies detected. Important!!!! In the DivirgentMAX indicator, the optimal entry points are drawn using arrows in the indicator's basement. Divergence is also displayed graphically. In this modification of the MACD, the lag problem characteristic of its predecessor i
F ully automated Expert Advisor using the  advanced   algorithm for trading the EURUSD Designed for profit in a short period of time and big profit in a long run. Prefers EURUSD 1H. Principle of operation The SELL and BUY orders are opened (depending on the parameters set), guided by signals and the market situation.     Recommended parameter: Use an ECN broker account. minimum deposit of 100$ USD. use it in H1 time frame recommended symbol is EURUSD input parameter: TrendType                 
What are Fibonacci Numbers and Lines? Fibonacci numbers are used to create technical indicators using a mathematical sequence developed by the Italian mathematician, commonly referred to as "Fibonacci," in the 13th century. The sequence of numbers, starting with zero and one, is created by adding the previous two numbers. For example, the early part of the sequence is 0, 1, 1, 2, 3, 5, 8, 13, 21, 34, 55, 89,144, 233, 377, and so on. The Fibonacci sequence is significant because of the so-calle
Towers - Trend indicator, shows signals, can be used with optimal risk ratio. It uses reliable algorithms in its calculations. Shows favorable moments for entering the market with arrows, that is, using the indicator is quite simple. It combines several filters to display market entry arrows on the chart. Given this circumstance, a speculator can study the history of the instrument's signals and evaluate its effectiveness. As you can see, trading with such an indicator is easy. I waited for an a
DMS Fibo
Diogo Mitsunaga Dos Santos
Fibonacci retracements are trend lines drawn between two significant points, usually between absolute lows and absolute highs, plotted on a chart. Intersecting horizontal lines are placed at the Fibonacci levels. Fibonacci retracements are useful tools that help traders identify support and resistance levels. With the information gathered, they can place orders, identify stop-loss levels, and set price targets. Although useful, traders often use other indicators to make more accurate assessments
PipFinite Trend PRO
Karlo Wilson Vendiola
4.88 (2249)
Breakthrough Solution For Trend Trading And Filtering With All Important Features Built Inside One Tool! Trend PRO's smart algorithm detects the trend, filters out market noise and gives entry signals with exit levels. The new features with enhanced rules for statistical calculation improved the overall performance of this indicator. Important Information Revealed Maximize the potential of Trend Pro, please visit www.mql5.com/en/blogs/post/713938 The Powerful Expert Advisor Version Automatin
PipFinite Exit EDGE
Karlo Wilson Vendiola
4.83 (115)
Did You Have A Profitable Trade But Suddenly Reversed? In a solid strategy, exiting a trade is equally important as entering. Exit EDGE helps maximize your current trade profit and avoid turning winning trades to losers. Never Miss An Exit Signal Again Monitor all pairs and timeframes in just 1 chart www.mql5.com/en/blogs/post/726558 How To Trade You can close your open trades as soon as you receive a signal Close your Buy orders if you receive an Exit Buy Signal. Close your Sell orders if
Prophet is a trend indicator. Shows the direction of turning points. Can be used with an optimal risk-to-profit ratio. The arrows indicate favorable moments and directions for entering the market. Uses one parameter for setting (adjust from 1 to 3). The probability of a successful trend is very high. In the course of work, the take-profit is much larger than the stop-loss! Works on all currency pairs and on all timeframes.
Future Price Markets is an indicator that, through the dynamic analysis of price and time, projects profit taking prices in the future. To show the future projections of the price, it uses certain horizontal lines, of different color and style, whether it be a signal to indicate a purchase signal or a sale signal or a future signal to take purchase or sale benefits.
The trend is your friend! This is what this indicator is all about. Follow this famous saying and be safe. Characteristics: Buy/Sell signals fixed on the close of a bar. Works on all symbols and all timeframes. Clear visual market trend laser line, Buy/Sell signal arrows, market strength meter, TP1 & TP2 boxes. Visual signals when to enter, when to exit the market. No repainting. Compatible with Flexible EA for trading automation. (Ask for a free set file optimized to perform 2010-2018) Parame
Crypto_Forex インジケーター MT4 用コンソリデーション バー パターン。 - インジケーター「コンソリデーション バー」は、価格アクション取引用の非常に強力なブレイクアウト重視のインジケーターです。 - インジケーターは、1 つのバーの間に狭い領域で価格コンソリデーションを検出し、ブレイクアウトの方向、保留中の注文の場所、および SL の場所を表示します。 - 強気コンソリデーション バー - チャート上の青い矢印信号 (画像を参照)。 - 弱気コンソリデーション バー - チャート上の赤い矢印信号 (画像を参照)。 - 再描画なし、遅延なし、高い R/R 比率 (報酬/リスク)。 - PC、モバイル、および電子メール アラート付き。 - インジケーター「コンソリデーション バー パターン」は、サポート/レジスタンス レベルと組み合わせるのに適しています。 高品質のトレーディングロボットとインジケーターをご覧になるにはここをクリックしてください! これは、この MQL5 Web サイトでのみ提供されるオリジナル製品です。
The Before indicator predicts the most likely short-term price movement based on complex mathematical calculations. Most of the standard indicators commonly used in trading strategies are based on fairly simple calculations. This does not mean that there were no outstanding mathematicians in the world at the time of their creation. It is just that computers did not yet exist in those days, or their power was not enough for the sequential implementation of complex mathematical operations. Nowad
Auto Swing Gold
Wan Muhammad Zulhilmy Bin Wan Jaafar
The Auto Swing Gold Expert Advisor simplify the trading process for the swing traders, works at his best with GOLD/XAUUSD (30 Minute Timeframe). From 20th July 2020 to 31st December 2020 back test results, this EA gains 5000% in less than a year without using any high risk or dangerous strategies like increasing the lots after wining or losing a trade (Martingale, D'Alembert and etc..). This is the best EA  you need to hold the best positions longer in BIG profit with the lowest risk as possible
The indicator shows which trading pairs, strategies, robots and signals that you use are profitable and which are not. The statistic of trades and balance graph are displayed in the account currency and pips - to switch simply click on the graph. button "$"(top left) - minimize/expand and move the indicator panel button ">"(bottom right) - stretching and resetting to the original size Statistic of trades 1 line - account balance, current profit and lot of open trades; 2 line - the number of all
スペシャルキャンドル 成功した一目均衡表戦略を持つ最高の外国為替指標の1つを使いたいですか?この一目均衡表戦略に基づく素晴らしいインジケーターを利用できます。 MT5バージョンはこちらです 。 第1戦略: この戦略では、まれに発生する類似した強いクロスを特定することが含まれます。 この戦略に最適な時間枠は、30分(30M)および1時間(H1)です。 30分間隔の適切なシンボルには以下が含まれます: • CAD/JPY • CHF/JPY • USD/JPY • NZD/JPY • AUD/JPY • EUR/USD • EUR/GBP 1時間のタイムフレームに適したシンボルには以下が含まれます: • GBP/USD • GBP/NZD • GBP/AUD • USD/CAD • USD/CHF • USD/JPY • EUR/AUD 第2戦略: この戦略では、トレンドと同じ方向に発生した強力なTenkunsenおよびKijunsenのクロスを特定することが含まれます。 この戦略に最適な時間枠は、1分(1M)から15分(15M)です。 この戦略はほとんどの通貨およびシンボルに適用でき
Check My Product Contact me to discover all my services  Supply and demand zones are one of the most basic things a beginner forex trader learns. These zones are so important, price reacts off of them even after years since they first developed. And with the supply and demand zones indicator, a forex trader might not need to worry about drawing all these historical zones one after the other. The supply and demand zone indicator accurately draws the supply and demand zones of a currency pair o
This is a trend indicator without redrawing Developed instead of the binary options strategy (by the color of the Martingale candlestick) Also works well in forex trading When to open trades (binary options) A signal will appear in the place with a candle signaling the current candle It is recommended to open a deal for one candle of the current timeframe M1 and M5 When a blue dot appears, open a deal up When a red dot appears, open a trade down. How to open trades on Forex. When a signal is rec
Reversal Pattern AI is a groundbreaking advancement in indicator development, combining artificial intelligence algorithms, multi-level market analysis, and classical technical analysis methods. It not only detects reversal patterns but also evaluates market inefficiencies, generating highly accurate trading signals.Thanks to its hybrid model, which utilizes price action analysis, volume, volatility, VWAP, and Volume AVG %, the indicator easily adapts to any market conditions. Reversal Pattern A
Crypto_Forex MT4用インジケーター「Consolidation Bar Pro」 - インジケーター「Consolidation Bar Pro」は、プライスアクション取引において非常に強力なブレイクアウト重視のインジケーターです。 - このインジケーターは、1本のバー内で狭い範囲での価格コンソリデーションを検知し、ブレイクアウトの方向、未決注文の位置、SLの位置を表示します。 - 強気コンソリデーションバー - チャート上に青い矢印シグナルを表示します(画像参照)。 - 弱気コンソリデーションバー - チャート上に赤い矢印シグナルを表示します(画像参照)。 - リペイントなし、遅延なし。 - 高いR/Rレシオ(リワード/リスク)。 - PCとモバイルの両方でアラート機能搭載。 - インジケーター「Consolidation Bar Pro」は、サポート/レジスタンスレベルと組み合わせると効果的です。 - インジケーターには情報ディスプレイが搭載されており、接続された通貨ペアの現在のスプレッドとスワップを表示します。 - 情報ディスプレイには、口座残高、エクイティ、マ
Alpha Trend signは私たちの取引システムを検証し、取引信号を明確に提示し、信号がドリフトすることはありません。 主な機能: •市場が活況を示している地域に応じて、指標に基づいて現在の相場がトレンド相場に属しているか、それとも揺れ相場に属しているかを直感的に判断することができる。 そして、指標の指示矢印に基づいて市場に切り込み、緑の矢印は購入を提示し、赤の矢印は販売を提示する。 •小周期変動による頻繁な取引信号の発生を回避するために、5分以上の時間周期で取引を行うことを推奨します。 •最適な取引タイミングを逃さないために、シグナルプロンプトをオンにすることもできます。 •本指標はトレンド相場をよく予測するだけでなく、幅広振動相場でも利益を得ることができる。 •本指標は大道至簡の原則に基づいており、異なる段階のトレーダーが使用するのに適している。 注意事項: •Alpha Trend signには明確な入退場信号があり、損失を与えないように逆位相操作を提案しない。 •Alpha Trend signは特に成熟した指標であり、デルのチー
QuantumEdge Trader v1.0 AI-Powered Precision Signals for Serious Traders QuantumEdge Trader is a smart and reliable indicator that delivers accurate BUY and SELL signals using advanced market analysis and trend detection. Designed for M1 to M60 timeframes, it's ideal for scalping and intraday strategies. --- Key Features: No Repaint – Signals never change after appearing Smart trend filters to reduce noise Adjustable sensitivity and alerts Perfect for XAUUSD, EURUSD, and m
THIS IS A NEW PRODUCT RELEASE -  RENT FOR 1 MONTH FOR JUST $49.99: OFFER EXTENDS UNTIL THE END OF JANUARY 2026.   STRATEGY TESTER HAS LIMITED FUNCTIONS AND DOES NOT BEHAVE EXACTLY AS THE INDICATOR WOULD ON A DEMO. Transform Your Trading with Advanced Multi-Timeframe MACD Analysis The Continuation and Reversal Indicator is a sophisticated technical analysis tool that revolutionizes how you interpret MACD signals by analyzing multiple timeframes simultaneously. This professional-grade indicator p
Indicator Description GOLD TITAN KING SIGNAL INDICATOR High-Precision Gold Scalping Buy/Sell Signals – Manual Trading Assistant Overview The Gold Titan King Signal Indicator is a manual trading assistant tool designed for high-frequency scalping on Gold (XAUUSD) and other major pairs. It generates clear BUY/SELL signals with precise entry levels, along with adjustable Stop Loss and Take Profit levels displayed directly on the chart. ️ This tool is NOT an EA. It does not execute trades
Forex Gump Trendは、トレンドの方向を非常に効果的に決定するための普遍的な指標です。トレンドを正しく特定すれば、これは取引成功の95%です。これは、価格変動の方向に取引を開始し、その恩恵を受けることができるためです。 Forex Gump Trendインジケーターは、効率の高いトレーダーが現在のトレンドの方向とトレンドの反転ポイントを判断するのに役立ちます。トレンドの方向はチャート上で色付きの線で示され、トレンド反転ポイントは矢印で示されます。インジケーターには多くの設定があり、ほぼすべての時間枠とすべての通貨ペアで使用できます。 外国為替ガンプトレンドと取引する方法は? 取引戦略は、トレーダーの取引スタイルと彼が働く通貨ペアに依存します。しかし、グローバルに言えば、この指標を使用した取引戦略は、常にトレンドの方向に注文を開くことに基づいています。インジケーターは色付きの線でトレンドを示します。したがって、インジケーターが青い線を引いたときに買い取引を開き、インジケーターが赤い線を引いたときに売り取引を開きます。トレーダーの大多数がスキャルピング戦略を使用して取引
このプロダクトを購入した人は以下も購入しています
Miraculous Indicator – ガン・スクエア・オブ・ナインに基づく100%非リペイントのFXおよびバイナリーツール この動画では、FXおよびバイナリーオプションのトレーダー向けに特別に開発された、非常に正確で強力な取引ツールである Miraculous Indicator を紹介しています。このインジケーターがユニークなのは、伝説的な ガン・スクエア・オブ・ナイン と ガンの振動の法則 に基づいている点で、現代の取引で利用できる最も正確な予測ツールの一つとなっています。 Miraculous Indicatorは 完全に非リペイント であり、ローソク足が確定した後にシグナルが変化したり消えたりすることはありません。つまり、見たものがそのまま利用できます。これにより、トレーダーは自信を持ってエントリーおよびエグジットを行うための信頼性と一貫性のある根拠を得ることができます。 主な特徴: ガン・スクエア・オブ・ナインとガン理論に基づいて構築 100%非リペイントのシグナルシステム すべての時間枠(M1、M5、H1、H4、日足、週足)で機能 FXおよびバイナリーオプション取引
Meravith
Ivan Stefanov
5 (2)
マーケットメーカーのためのツール。 Meravith は次の機能を提供します: すべての時間足を分析し、現在有効なトレンドを表示します。 強気と弱気の出来高が等しくなる流動性ゾーン(出来高均衡)を強調表示します。 異なる時間足のすべての流動性レベルをチャート上に直接表示します。 テキスト形式の市場分析を生成し、参考情報として表示します。 現在のトレンドに基づいて目標値、サポートレベル、ストップロスを計算します。 取引のリスクリワード比を算出します。 口座残高に基づいてポジションサイズを計算し、潜在的な利益を推定します。 また、市場に大きな変化があった場合には警告を表示します。 インジケーターの主要ライン: 強気/弱気の出来高エグゾーストライン ― 目標値として機能します。 市場のトレンドを示すライン。市場が強気か弱気かによって色が変わり、トレンドのサポートとして機能します。主にその色が市場センチメントを示します。 出来高均衡ライン(Eq)。Eq(Volume Equilibrium)ラインはシステムの中核です。これは買い手と売り手の出来高のバランスポイントを表します。市場の流動性を示し
Pulse Scalping Line - an indicator for identifying potential pivot points. Based on this indicator, you can build an effective Martingale system. According to our statistics, the indicator gives a maximum of 4 erroneous pivot points in a series. On average, these are 2 pivot points. That is, the indicator shows a reversal, it is erroneous. This means that the second signal of the indicator will be highly accurate. Based on this information, you can build a trading system based on the Martingale
This indicator depends on some secrets equations to draw Signals with Stop loss and maximum 4 Take profits. There is a free EA depends on this indicator as a gift when you purchase/rent it. Features Simply it gives you entry point as Ready sign (Buy / Sell) and arrow (Buy / Sell) after candle closed, also SL line and 4 TP lines or less. Once SL-TP lines are shown with the arrow, they remains as they are until signal change. It is historical indicator. No Repaint. user manual for V5 please click
Bomb Bank Signal
Igor Pereira Calil
5 (1)
Bomb Bank シグナル: MetaTrader 4 の信頼度インジケーター Bomb Bank Signal は、金融市場で最も関連性の高いトレンドを特定するように設計された MetaTrader 4 の強力なインジケーターです。動きを正確に予測するツールをお探しなら、Bomb Bank が最適です。 仕組み: このインジケーターは、出来高分析、ローソク足終値、対称トレンドという 3 つの異なる方法を組み合わせて、売買の機会を検出してシグナルを送ります。 Bomb Bank は、買いの機会を特定するときは「爆弾」のようなものであり、売りシグナルを検出するときは「ドクロ」のようなものです。 ボムバンクはなぜ違うのですか? 完全な信頼性: Bomb Bank Signal は信号を削除しません。一度シグナルが発せられると、シグナルは残り続けるので、チャンスを逃すことはありません。 極めて高い精度: Bomb Bank は誤った信号を送信しません。リアルタイムで最新情報を更新し、市場の進化に合わせて調整しながら、以前のシグナルの透明性を維持します。 ライブアップデート: シ
Algo Trading Indicaor  With this indicator , you’ll have zones and trends that hight probability the price will reverse from it. so will gives you all the help that you need  Why should you join us !?  1-This indicator is logical since it’s working in previous days movement , to predict the future movements. 2-Algo trading indicator will help you to draw trends which is special and are too strong than the basics trend , trends will change with the frame time that you work on . 3-We can use
Product Name:   Quantum Regime Indicator Short Description:   A multi-engine structural regime and volatility filter. Description: Quantum Regime Indicator (QRI) is a sophisticated technical analysis algorithm designed to identify market structure shifts and volatility regimes. Unlike standard indicators that rely on immediate price action, QRI utilizes a hierarchical logic architecture to filter market noise and identify statistical extremes. The indicator is built on the philosophy of "Market
「 Dynamic Scalper System 」インジケーターは、トレンド波の中でスキャルピング取引を行う手法のために設計されています。 主要通貨ペアと金でテスト済みで、他の取引商品との互換性があります。 トレンドに沿った短期的なポジションオープンのシグナルを提供し、追加の価格変動サポートも提供します。 インジケーターの原理 大きな矢印はトレンドの方向を決定します。 トレンド波の中では、小さな矢印の形でスキャルピングシグナルを生成するアルゴリズムが機能します。 赤い矢印は強気方向、青い矢印は弱気方向です。 トレンドの方向には敏感な価格変動ラインが描かれ、小さな矢印のシグナルと連動します。 シグナルは次のように機能します。適切なタイミングでラインが現れるとエントリーシグナルが形成され、ラインが開いている間はポジションが保持され、完了すると取引が終了します。 推奨される動作時間枠はM1~H4です。 矢印は現在のローソク足に形成され、次のローソク足が開いている場合は、前のローソク足の矢印は再描画されません。 入力パラメータ Trend Wave Period - トレンド方向
F-16 Plane Indicatorをご紹介します。これは、取引体験を革新するために設計された最先端のMT4ツールです。F-16戦闘機の無類のスピードと精度に触発され、このインジケーターは高度なアルゴリズムと最新技術を組み合わせ、金融市場で比類のないパフォーマンスを提供します。 F-16 Plane Indicatorを使用すると、リアルタイムの分析と高精度な取引シグナルの生成が可能で、競争相手を圧倒します。ダイナミックな機能により、さまざまな資産クラスで利益を見つけることができ、自信を持って的確な決定を行うことができます。 使いやすいインターフェースを備えたF-16 Plane Indicatorは、人気のあるMetaTrader 4プラットフォームとシームレスに統合され、スムーズで効率的な取引プロセスを実現します。初心者のトレーダーでも経験豊富なプロフェッショナルでも、このインジケーターは独自の取引スタイルと好みに合わせて簡単にカスタマイズすることができます。 F-16 Plane Indicatorのパワーを体感し、市場のトレンドを精密かつ敏捷にナビゲートします。高度なチャー
The Nihilist 5.0 Indicator includes Forexalien and Nihilist Easy Trend trading strategies and systems. It is composed of an MTF Dashboard where you can analyze the different input possibilities of each strategy at a glance. It has an alert system with different types of configurable filters. You can also configure which TF you want to be notified on your Metatrader 4 platform and Mobile application The indicator has the option to view how could be a TP and SL by using ATR or fixed points, even w
Scalping signals M1 を購入した方全員に、 本インジケーターのシグナルに基づいて自動売買を行う EAロボットを無料プレゼント します。 Scalping signals M1 — M1向けトレンドスキャルピング完全エントリーシステム Scalping signals M1 は、チャートをわかりやすい行動マップに変えるインジケーターです。 カラートレンドチャネルが市場の方向を示し、矢印がエントリーポイントを知らせます。 チャネルの方向と矢印に従うだけでよく、初心者でも簡単に扱えます。 インジケーターは特に M1 で優れた性能を発揮し、 XAUUSD(ゴールド)、ポンド、ドルの主要通貨ペア、クロスなど、ほぼすべての通貨ペアに対応しています。 アラートとメール通知を搭載しているため、シグナルを見逃しません。 基本コンセプト Scalping signals M1 は使いやすい外観とは対照的に、内部では高度なアルゴリズムが動作しています。 視覚的に表示されるのは以下の2つだけです。 – トレンド方向を示すチャネル – トレンド継続が期待される位置での Buy/Sell 矢印
ConfluencePro v2.0 – Ultimate Confluence Indicator for Binary Options & Forex Professional Multi-Filter Signal System with Dashboard, News Filter & Real-Time Statistics ConfluencePro v2.0 is the most advanced confluence-based indicator ever released on the MQL5 Market. It combines 17+ professional filters (Trend, Smart Money Concepts, Market Structure, Divergence, MTF Confirmation, News Events, Volume, Regime Detection and more) into a single, easy-to-read confluence score (0–100%). Only the hi
OrderFlow Absorption – MT4用プロフェッショナル・デルタ&アブソープションシグナルインジケーター OrderFlow Absorptionで本物のオーダーフロー分析の力を解き放ちましょう。MetaTrader 4向けの究極のデルタヒストグラム&アブソープションシグナルインジケーターです。あらゆる価格変動の裏側で何が起きているのかを知りたいトレーダーのために設計されており、市場を動かす隠れた買い/売り圧力や吸収イベントを明らかにします。 特徴 デルタヒストグラムの可視化:   買い圧力・売り圧力を色分けされたヒストグラムで即座に表示。 アブソープションシグナル検出:   高度なロジックで強気・弱気の吸収イベントを特定し、反転の兆しを早期に通知。 チャートマーカー:   吸収シグナルをチャート上に直接マークし、視覚的に分かりやすく表示。 ポップアップアラート:   新しい吸収シグナルが出現した際にリアルタイムで通知。 カスタマイズ可能な閾値:   弱いシグナルを除外し、高確率のセットアップに集中。 リソース管理:   大きなチャートでも高速に動作する効率的な計算。
BinaryIndicator is a highly accurate indicator for trading binary options. It shows excellent results in scalping. This indicator is based in multifactor analysis of trend indicators, as well as confirmation oscillators, which in the end gives an increased accuracy of signals. Advantages of the indicator Increased accuracy of signals. Excellent results when trading binary options with a short expiration time from M30 to M1 . It works on any timeframes. Works with any trade symbols. Parameters
Gold Channel is a volatility-based indicator, developed with a specific timing algorithm for the XAUUSD pair, which consists of finding possible corrections in the market. This indicator shows two outer lines, an inner line (retracement line) and an arrow sign, where the theory of the channel is to help identify overbought and oversold conditions in the market. The market price will generally fall between the boundaries of the channel. If prices touch or move outside the channel it is a tradi
ECM Elite Channel is a volatility-based indicator, developed with a specific time algorithm, which consists of finding possible corrections in the market. This indicator shows two outer lines, an inner line (retracement line) and an arrow sign, where the channel theory is to help identify overbought and oversold conditions in the market. The market price will generally fall between the boundaries of the channel. If prices touch or move outside the channel, it's a trading opportunity. The ind
RABBY: The "Momentum Dislocation" Indicator for Nasdaq  (Nas100, Us100) Nasdaq M1 (Nas100, Us100) Stop Getting Trapped by M1 Noise. The Ultimate Nasdaq Scalping Tool. Start Trading the Dislocation. The first indicator that visualizes "Price Detachment" for high-precision entries. You don't need another arrow. You need to see the   Structure   of the move. If you trade Nasdaq (Nas100, Us100) on the 1-minute, you know the feeling: An indicator prints a "Buy" signal. You enter. Two minutes lat
Rtc ML Ai | Predictor CORE MACHINE LEARNING ENGINE Adaptive ML Market Predictor – Multi-Bar Trend & Candle Forecast What This Indicator Does This indicator is a  real-time market prediction engine  designed to analyze price behavior and estimate  future market tendencies . Unlike conventional indicators, this system  does not rely on static parameters or historical curve-fitting , but adapts its internal state dynamically during live market operation. Instead of using static rules, the indic
Currently switched to the 4 hour chart - but use other time frames for confirmation. :-)  I change my main time frame based on the market movement at the time. The Hurricane Forex Indicator is a multi time frame indicator that includes such things as Trade Notifications, Trade Calculator, Momentum Indicator, risk reward and much more. We have a free Trade room for our users as well. Please check out the video for full details of how this indicator works as it has over 15 years worth of developme
FFx Engulfing Setup Alerter gives trade suggestions with Entry, Target 1, Target 2 and StopLoss. Below are the different options available: Entry suggestion - pips to be added over the break for the entry 3 different options to calculate the SL - by pips, by ATR multiplier or at the pattern High/Low 3 different options to calculate the 2 TPs - by pips, by ATR multiplier or at Risk/Reward Offset the dashboard - any place on the chart Remove the suggestion once the price reached the SL line Lines
FFx InsideBar Setup Alerter gives trade suggestions with Entry, Target 1, Target 2 and StopLoss. Below are the different options available: Entry suggestion - pips to be added over the break for the entry Minimum candle size - to avoid too close buy/sell entry suggestions 3 different options to calculate the SL - by pips, by ATR multiplier or at the pattern High/Low 3 different options to calculate the 2 TPs - by pips, by ATR multiplier or at Risk/Reward Offset the dashboard - any place on the c
FFx OutsideBar Setup Alerter gives trade suggestions with Entry, Target 1, Target 2 and StopLoss. Below are the different options available: Entry suggestion - pips to be added over the break for the entry. 3 different options to calculate the SL - by pips, by ATR multiplier or at the pattern High/Low. 3 different options to calculate the 2 TPs - by pips, by ATR multiplier or at Risk/Reward. Offset the dashboard - any place on the chart. Remove the suggestion once the price reached the SL line.
FFx PinBar Setup Alerter gives trade suggestions with Entry, Target 1, Target 2 and StopLoss. Below are the different options available: Entry suggestion - pips to be added over the break for the entry Minimum candle size - to avoid too small candles 3 different options to calculate the SL - by pips, by ATR multiplier or at the pattern High/Low 3 different options to calculate the 2 TPs - by pips, by ATR multiplier or at Risk/Reward Offset the dashboard - any place on the chart Remove the sugges
Automatic, live & interactive picture of all trendlines. Assign push, email and sound alerts to the lines of your choice and be informed about price rollback, breakout, rollback after breakout, number of rollbacks, line expiration by double breakout. Correct, drag or delete the lines and interactively tune the line system. https://youtu.be/EJUo9pYiHFA . Chart examples https: //www.mql5.com/en/users/efficientforex Price Interaction Events All events are effective immediately and only after one
Stochastic Oscillator is one of the most popular and accurate oscillators widely used by traders to capture overbought and oversold areas of price action. Although the Stochastic indicator works fine for an interval of the market, it fails to generate profitable signals when the market conditions change, and hence it produces wrong signals resulting in big losses. Have you ever thought about an adaptive Stochastic indicator that adapts its period of calculation based on the market conditions? Th
The purpose of this new version of the MT4 standard indicator provided in your platform is to display in a sub-window multiple timeframes of the same indicator with its divergences. See the example shown in the picture below. But the display isn't like a simple MTF indicator. This is the real display of the indicator on its timeframe. Here's the options available in the FFx divergences indicator: Select the timeframes to be displayed (M1 to Monthly) Define the width (number of bars) for each tim
The purpose of this new version of the MT4 standard indicator provided in your platform is to display in a sub-window multiple timeframes of the same indicator with its divergences. See the example shown in the picture below. But the display isn't like a simple MTF indicator. This is the real display of the indicator on its timeframe. Here's the options available in the FFx divergences indicator: Select the timeframes to be displayed (M1 to Monthly). Define the width (number of bars) for each ti
作者のその他のプロダクト
Clever Smart
Carlos Forero
4.76 (17)
Description Helps you detect the structure of the market, using different types of Smart Money concepts. This should help you to upgrade your trading strategy in every way. MT5 Version Here Smart Money Features: Color candle to signal the type of structure Shows CHOCH and BOS Equal Lows and Highs Order Blocks Internal and Swings Weak and strongs high and lows Fair Value Gaps High and Lows in daily weekly and monthly timeframes Premium and discount Zones KEY LINKS:   How to Install   –  Frequent
FREE
Description: The indicator measures, through the zigzag indicator, the levels of trend or correction. It shows in the chart the levels of each low or high detected. KEY LINKS:   How to Install  –  Frequent Questions  -  All Products  How is this indicator useful? This indicator determines, depending on Zigzag parameter if a trend is beginning, developing, or ending This indicator determines the direction of the trend Components Levels as positive or negative numbers, depending on the direction
FREE
Description The indicator uses market profile theory to show the most relevant trading zones, on a daily basis. The zones to be shown are LVN (low volume nodes) and POC (point of control). An LVN zone is one which represents price areas with the least time or volume throughout the day. Typically, these areas indicate a supply or demand initiative, and in the future, they can turn into important breakout or retracement zones. A POC zone is one which represents price areas with the most time or vo
Description: The indicator shows the TDI indicator in a separate window, and with the RSI component, the indicator finds possible divergences with M or W patterns. KEY LINKS:   How to Install  -   Frequent Questions  -  All Products  Functions: Finds Market Makers patterns. Finds extremes or exhaustion into the market. Looks for a trend continuation. Content: TDI Indicator Divergence and M or W Signals Note 1:  This indicator should only be considered as a part of any trading strategy. You shoul
Description: Indicator which uses trend, breakout and reversal innovative indicators to show a complete visual trading strategy, with transparent metrics. It follows simple visual patterns, which will improve your trading significantly. Support:   We create great tools for the entire trading community. Most of them are free. If you believe in what we do  Support Us Here.   KEY LINKS:   Indicator Manual  –   How to Install  –  Frequent Questions  -  All Products  Outstanding Features Shows cur
Description: The indicator predicts, with a specific probability, if the actual candlestick range will expand or contract compared to the range of a previous candle. Furthermore, the indicator shows the possible high or low of the actual candle, based on trend direction. (Recommended for Daily, Weekly, or Monthly timeframes). KEY LINKS:   Indicator Manual  –  How to Install  –  Frequent Questions  -  All Products  How to use the indicator: Determines, with a certain probability, if there will b
Description The indicator measures a currency’s relative strength, on different timeframes, through certain percentile spread analysis. This allows you to compare which are the strongest currency pairs, against the weakest pairs. These spreads are based on comparison against USD. KEY LINKS:  Indicator Manual  –  How to Install  –  Frequent Questions  -  All Products  How is "Clever Spread Currencies Strength" useful to you? This indicator determines a currency’s strength for different timeframe
Description Complete breaker market maker Key zones indicator, It provides precise zones where could be an excellent break or reversal opportunity. KEY LINKS:   How to Install  -  Frequent Questions  -  All Products  How is this indicator useful? It will allow you to trade retracement or breakout patterns, every time they occur in a given zone. NEVER repaints. It signals clear possible money management levels as stop and take profit. You’ll be able to identify potential resistance or support lev
Description Candle Power Color indicator which shows when the market is trending and when it is in a sideway movement KEY LINKS:   How to Install  –  Frequent Questions  -  All Product How is this indicator useful? It allow to detect trend and sideway movements in market NEVER repaints. It adapts to any market and asset. It can support any other trading strategy. Note 1:  This indicator should only be considered as a part of any trading strategy. You should complement this with other filters (e.
Description Better version of MACD indicator which offer a complete visual trading strategy and realize an auto-optimization KEY LINKS:  How to Install  –  Frequent Questions  -  All Products  How is this indicator useful? NEVER repaints. Detect best parameters of MACD indicator, based on profit factor during the specified period. This indicator can be used as a visual strategy, following the recommendations of entry, stop, and targets. Indicator features It can be used as a complete trading st
Description Better version of RSI indicator which offer a complete visual trading strategy and realize an auto-optimization Support:   We create great tools for the entire trading community. Most of them are free. If you believe in what we do  Support Us Here.   KEY LINKS:   How to Install  –  Frequent Questions  -  All Products  How is this indicator useful? NEVER repaints. Detect best parameters of RSI indicator, based on profit factor during the specified period. This indicator can be used as
EA that detects reversion patterns to enter the market at the best possible conditions. It uses a reentry system with a establish stop, and risk control system. Timeframe: H1 Recommeded Pairs: EURUSD, GBPUSD Recommended Min Account Size: 10.000 USD Signal:    Very Low Risk Features: Automatic reinvestment of earned profits for further trading; The advisor increases the volume of transactions according to the size of the deposit, including taking into account the earned profit, which makes it pos
This EA trades with a breakout strategy, it try to detect the best levels to trade and its designed to trade the GBPUSD and EURUSD Signal EAs:   https://www.mql5.com/es/signals/1726841 Assets: GBPUSD, EURUSD TimeFrame: H1 Features: Automatic reinvestment of earned profits for further trading; The advisor increases the volume of transactions according to the size of the deposit, including taking into account the earned profit, which makes it possible to achieve compound interest; Fully automated;
Description Very robust and powerful indicator, which allows through its 4 components, trade the market in trend or not trending conditions. it based on a very reliable trading strategy and gives you all you need to be succesful in trading. KEY LINKS:   Indicator Manual  –  How to Install   –  Frequent Questions  -  All Products  How is Clever Scalper Pro useful to you? A complete and reliable trading strategy. Easy to understand and trade Allow to identify trend, confirm it, look for retraceme
Description Very precise patterns to detect: entry signals as well as breakout, support and resistance reversal patterns. It points out zones in which, with a high probability, institutional orders with the potential to change the price’s direction and keep moving towards it, have been placed. Support:   We create great tools for the entire trading community. Most of them are free. If you believe in what we do  Support Us Here.   KEY LINKS:   Indicator Manual  -  All Products  How is this indi
Description: The indicator shows the TDI indicator in a separate window, and with the RSI component, the indicator finds possible divergences with M or W patterns. KEY LINKS:   How to Install  –  Frequent Questions  -  All Products  Functions: Finds Market Makers patterns. Finds extremes or exhaustion into the market. Looks for a trend continuation. Content: TDI Indicator Divergence and M or W Signals Note 1:  This indicator should only be considered as a part of any trading strategy. You shoul
KEY LINKS:  Indicator Manual  –  How to Install  –  Frequent Questions  -  All Products  Description: Indicator which uses trend, breakout and reversal innovative indicators to show a complete visual trading strategy, with transparent metrics. It follows simple visual patterns, which will improve your trading significantly. Support:   We create great tools for the entire trading community. Most of them are free. If you believe in what we do  Support Us Here. Outstanding Features Shows current
The indicator is based on a proven successful strategy. It shows buys and sello signals with suggested stop and target. In the same way, it calculates the essential trading analysis statistics as successful and profit ratio. KEY LINKS:  Indicator Manual  –  How to Install  -  Frequent Questions  -  All Products  Indicator features Effective and understandable signals. It can be used as a complete trading strategy. Complete trading statistics to evaluate the indicator performance. It shows exact
Description Price action patterns detection that can work as triggers in any trading strategy, It include Flag, Flag Top, Flag 1234, and micro pullback patterns Support:   We create great tools for the entire trading community. Most of them are free. If you believe in what we do  Support Us Here.   How is this indicator useful?  You can use the indicator signals as a trigger to entry in the market and complement any trading strategy. Components Note 1:  This indicator should only be considered a
Description Helps you detect the structure of the market, using different types of Smart Money concepts. This should help you to upgrade your trading strategy in every way. Smart Money Features: Color candle to signal the type of structure Shows CHOCH and BOS Equal Lows and Highs Order Blocks Internal and Swings Weak and strongs high and lows Fair Value Gaps High and Lows in daily weekly and monthly timeframes Premium and discount Zones KEY LINKS:   How to Install   –  Frequent Questions  -  All
フィルタ:
turky7713
466
turky7713 2021.03.20 11:18 
 

I was renting for three months, but I notice very few buy and sell signals This can be modified

Aravind Kolanupaka
9914
Aravind Kolanupaka 2019.06.16 00:12 
 

Good. Do not trade arrow to arrow as signals, use it along with your strategy.

レビューに返信