Clever Smart
- インディケータ
-
Carlos Forero
 私は、資本市場およびアルゴリズムによるポートフォリオ構築において10年以上の経験を持つ、プロの開発者およびトレーダーです。MetaTrader向けの高度な自動化システムとテクニカル分析ツールの開発を専門としています。
⚙️ 開発哲学
私のアプローチは厳密に定量的かつデータ主導型です。市場のノイズを排除し、真の統計的優位性を提供するようにシステムを設計しています。近道を探すのではなく、数学と論理を取引に応用しています。
🔷 私のツールに期待できること
✅ 機関投資家レベルの品質: 最高水準のプログラミング基準で構築されたインジケーターとエキスパートアドバイザー(EA)。 - バージョン: 1.97
- アップデート済み: 9 1月 2025
Description
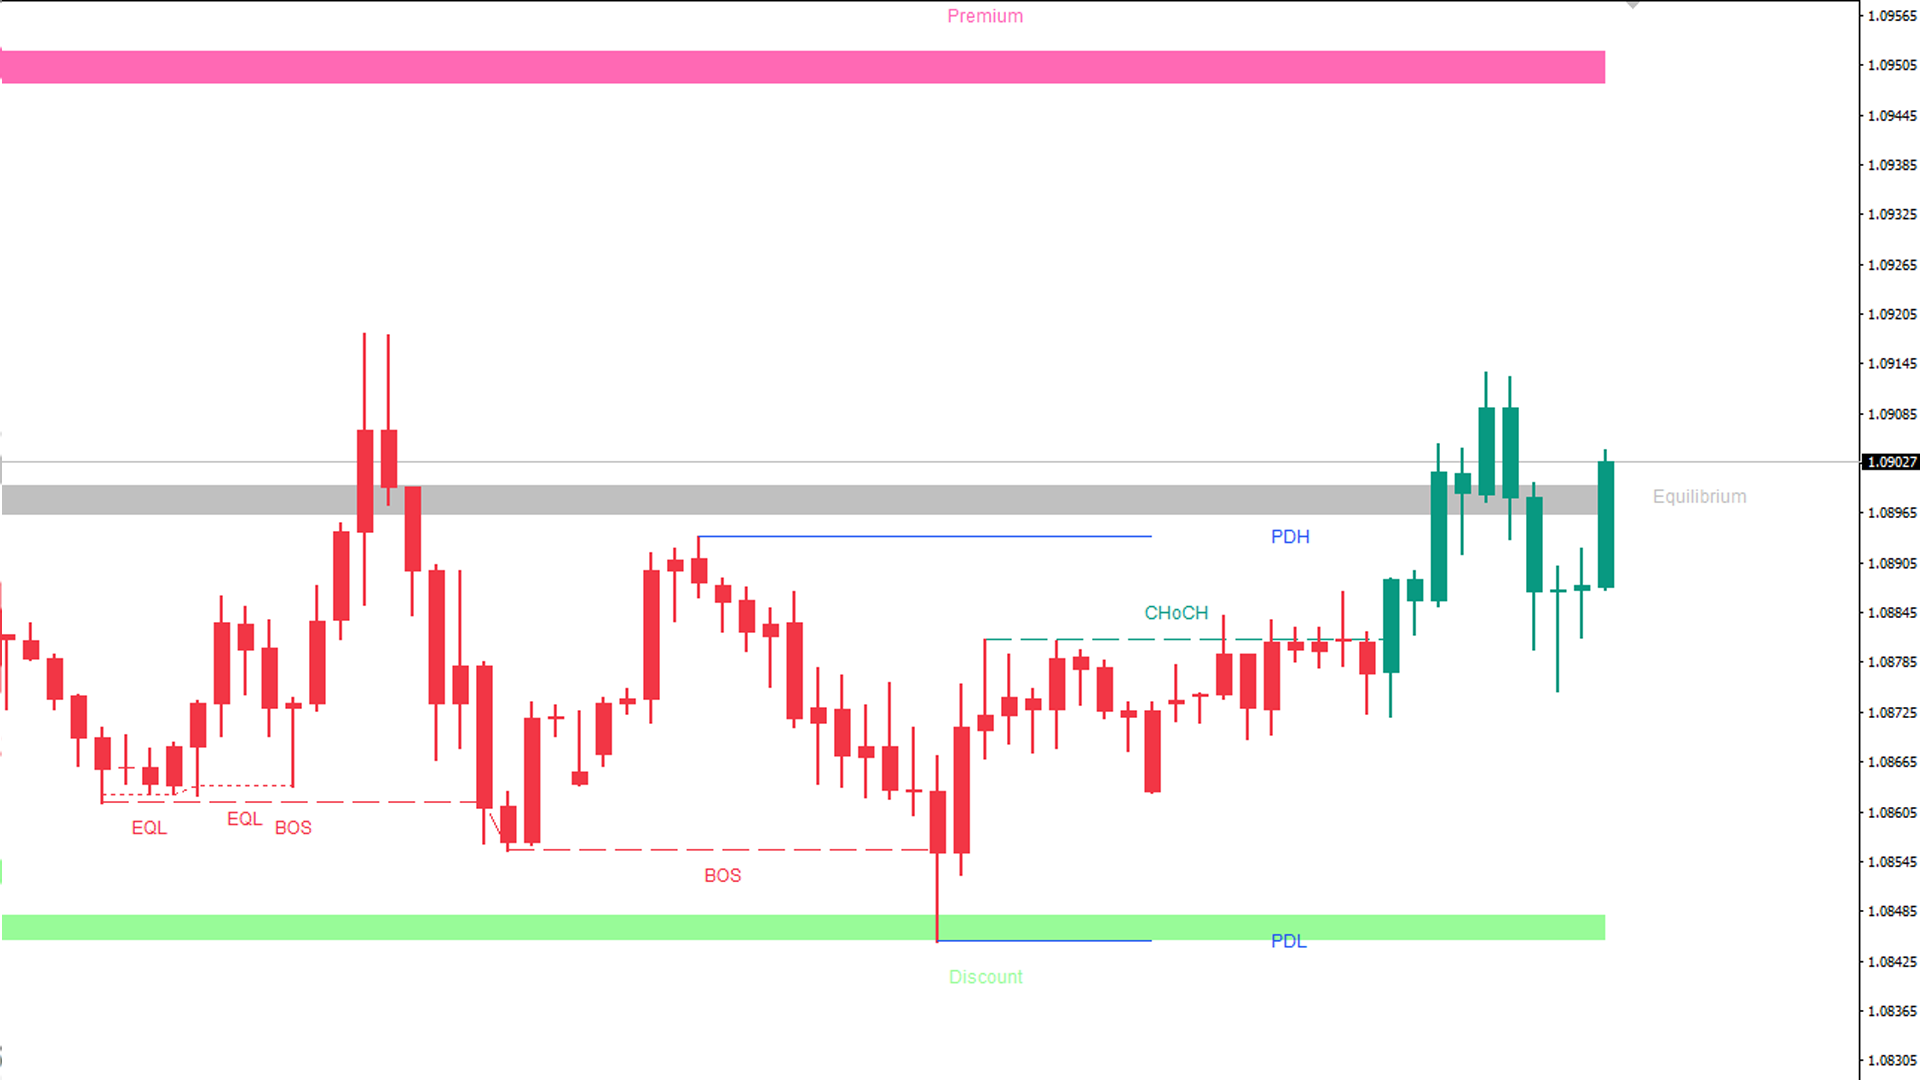
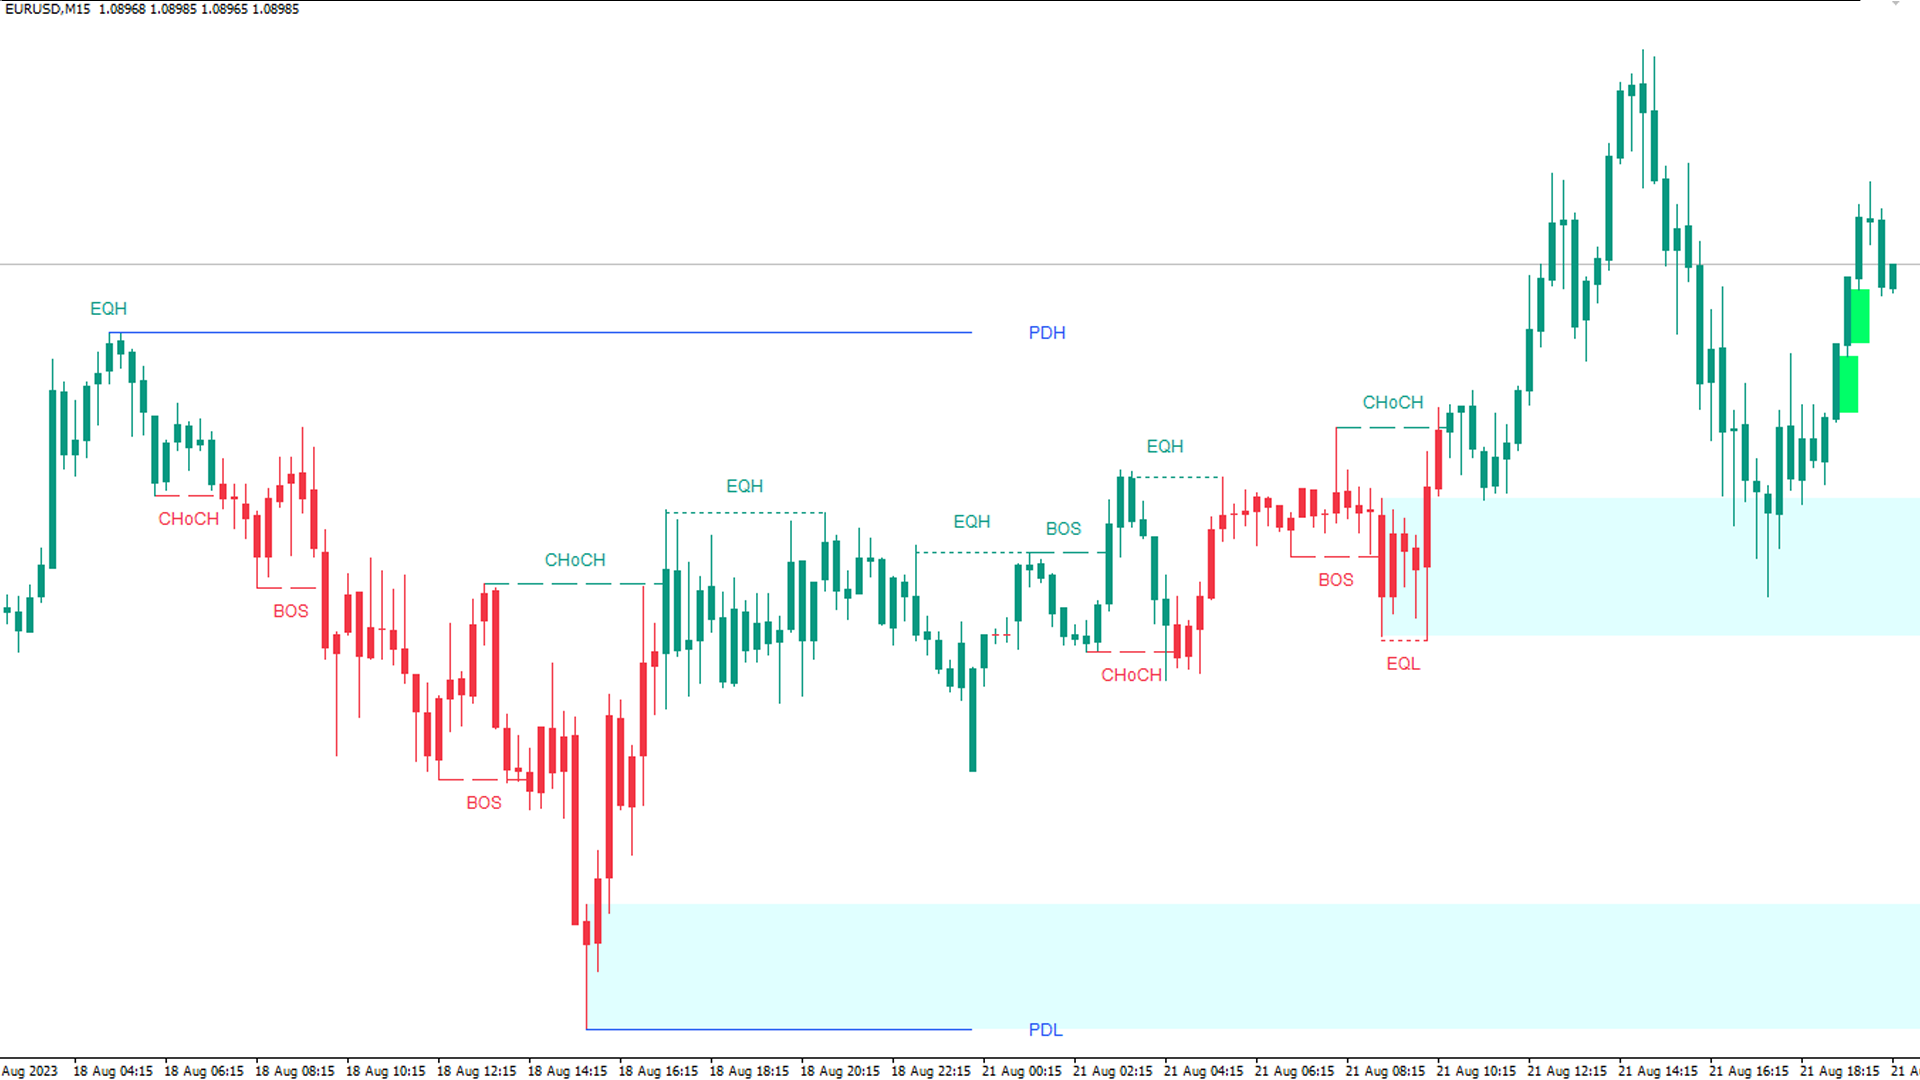
Helps you detect the structure of the market, using different types of Smart Money concepts. This should help you to upgrade your trading strategy in every way.
Smart Money Features:
- Color candle to signal the type of structure
- Shows CHOCH and BOS
- Equal Lows and Highs
- Order Blocks Internal and Swings
- Weak and strongs high and lows
- Fair Value Gaps
- High and Lows in daily weekly and monthly timeframes
- Premium and discount Zones
KEY LINKS: How to Install – Frequent Questions - All Products
How is this indicator useful?
- It will allow you to trade on the order’s direction, once its direction has been identified.
- It will allow you to trade retracement or breakout patterns, everytime they occur in a given zones.
- You’ll be able to identify potential resistance or support levels. Be mindful that you can use these levels as take profit zones.
- You’ll be able to combine this indicator with trend and institutional patterns.
- FInd the current structure of the market
Note 1: This indicator should only be considered as a part of any trading strategy. You should complement this with other filters (e.g trend, volatility, time, etc). Note 2: This indicator is meant to serve as a guide to apply in your intraday trading. Overtime, this will help you understand the baseline for a solid and consistent trading strategy.


Great indicator, thanks for share man. Could you add the option to extend Bos and Choch lines?