Clever Range Predictor
- インディケータ
-
Carlos Forero
 私は、資本市場およびアルゴリズムによるポートフォリオ構築において10年以上の経験を持つ、プロの開発者およびトレーダーです。MetaTrader向けの高度な自動化システムとテクニカル分析ツールの開発を専門としています。
⚙️ 開発哲学
私のアプローチは厳密に定量的かつデータ主導型です。市場のノイズを排除し、真の統計的優位性を提供するようにシステムを設計しています。近道を探すのではなく、数学と論理を取引に応用しています。
🔷 私のツールに期待できること
✅ 機関投資家レベルの品質: 最高水準のプログラミング基準で構築されたインジケーターとエキスパートアドバイザー(EA)。 - バージョン: 1.48
- アップデート済み: 6 4月 2025
- アクティベーション: 5
Description:
The indicator predicts, with a specific probability, if the actual candlestick range will expand or contract compared to the range of a previous candle. Furthermore, the indicator shows the possible high or low of the actual candle, based on trend direction. (Recommended for Daily, Weekly, or Monthly timeframes).
KEY LINKS: Indicator Manual – How to Install – Frequent Questions - All Products
How to use the indicator:
- Determines, with a certain probability, if there will be a volatile candle range expansion or contraction for the actual candlestick.
- Give alerts when the Price breakout any of the drawn levels.
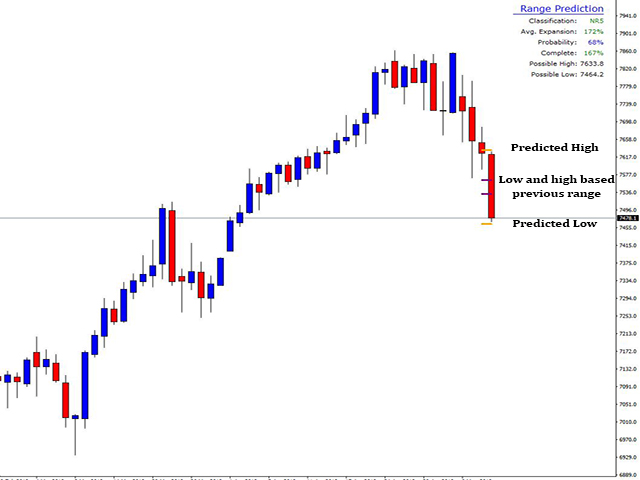
- You will know which price levels could be the high or low for the actual candlestick.
- You can combine different timeframes' volatility expansion/contraction probability, and with it, determine a possible price direction.
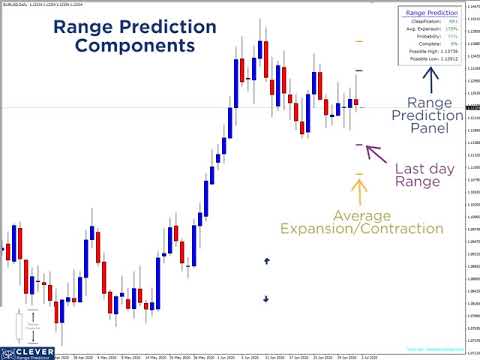
Components:
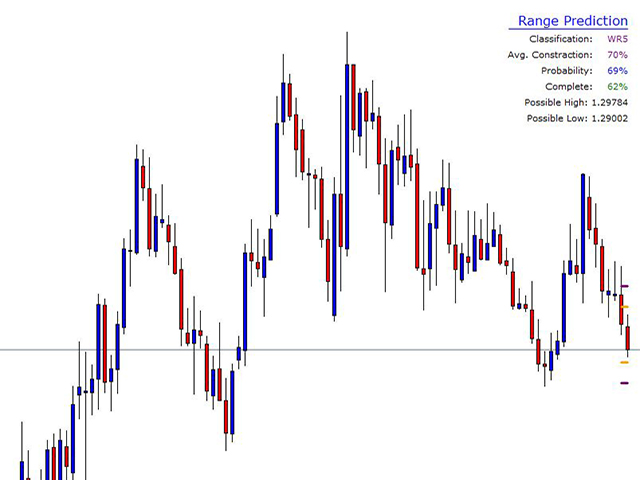
Table
- Classification: Considering the range of a previous candle, which is compared with its previous 7 candles, the indicator will assign a classification between Narrow Range and Wide range (Based Tony Crabbel Book). If the candle range is predicted to be smaller than the previous candle, the indicator will classify it as "NR" (narrow range). On the other hand, if the candle range is predicted to be bigger than the previous candle, then the indicator will classify it as "WR" (wide range). Finally, the number next to the "NR" or "WR" acronym represents the number of previous candle sticks which were used to make the prediction.
- Avg. Expansion or Constraction: It will determine the average percentage of range expansion or contraction, that the actual candle will have compared to the previous one.
- Probability: Average probability for the actual candle range to expand or contract.
- Complete: Level of range completion, as a percentage, of the actual candlestick range based on the previous candle range.
- Possible High or Low: Possible levels that the predicted price could reach, if the actual price candle accomplishes the average percentage of expansion or contraction.
Lines
- Orange Lines: Shows the possible High or Low for the actual candle stick in chart.
- Purple Lines: Shows the previous timeframe price range, in the actual candlestick in chart.
About Author:
Carlos Forero, Member of Clever Trading Club, private organization with the purpose of design clever solutions to generate constant profits with adapted risk.

Very good indicator, I recommend.