• 概要
  • レビュー (1)
  • コメント (3)
  • 最新情報

Clever Market Profile LVNs MT5

5

Description

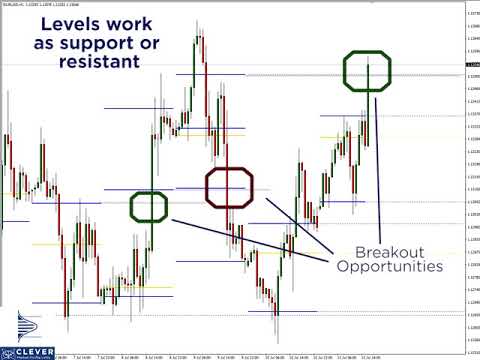
The indicator uses market profile theory to show the most relevant trading zones, on a daily basis. The zones to be shown are LVN (low volume nodes) and POC (point of control).

  • An LVN zone is one which represents price areas with the least time or volume throughout the day. Typically, these areas indicate a supply or demand initiative, and in the future, they can turn into important breakout or retracement zones.
  • A POC zone is one which represents price areas with the most time or volume throughout the day.

Support: We create great tools for the entire trading community. Most of them are free.

If you believe in what we do Support Us Here.


KEY LINKS: How to Install – Frequent Questions All Products 

How is this indicator useful?

  • It will allow you to have a reference of the most important trading zones for the current day, as well as those prior to it.
  • It will allow you to trade retracement or breakout patterns, everytime they occur in a given zone.
  • You’ll be able to use virgin levels of previous days’ LVN or POC, to identify potential resistance or support levels. Be mindful that you can use these levels as take profit zones.
  • For more uses research market profile theory.
Note 1: This indicator should only be considered as a part of any trading strategy. You should complement this with other filters (e.g trend, volatility, time, etc). Note 2: This indicator is meant to serve as a guide to apply in your intraday trading. Overtime, this will help you understand the baseline for a solid and consistent trading strategy.  

Components

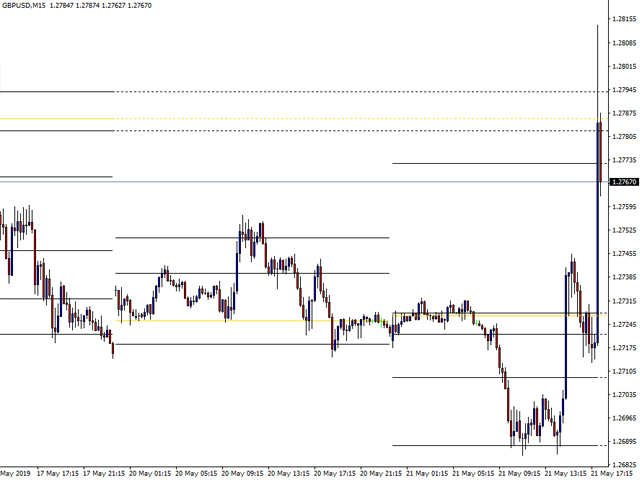
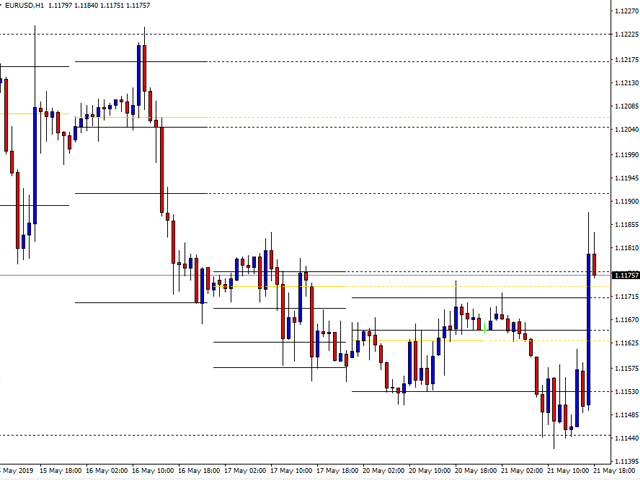
For each day, the indicator will show within a given price chart and under any timeframe, the following components:

  • Horizontal black lines: These represent LVN zones.
  • Horizontal yellow lines: These represent POC zones.
  • Horizontal dotted lines (black/yellow): These represent virgin levels. A virgin level is one which hasn’t been filled on any future period.

About Author:

Carlos Forero, Member of Clever Trading Club, private organization with the purpose of design clever solutions to generate constant profits with adapted risk.

レビュー 1
CSG CSG
1433
CSG CSG 2021.11.15 14:53 
 

Macht einen guten Eindruck, arbeitet sauber. Der Entwickler reagiert schnell auf seine Kunden - Vielen Dank! Eine nützliche Unterstützung im Handelsalltag.

おすすめのプロダクト
Waves Sizer
Flavio Jarabeck
3 (2)
Wyckoff fans, enjoy! Ideally to be used with the Weis Waves indicator, but it can be easily used alone, the Waves Sizer puts the range (in resulting Price movement) done by the Price on its market swings. You can control how accurate or loose will be the swings. This tool is very helpful for visually know how much the Price has traveled in your Timeframe. This way you can confront this level of effort with the resulting Volume, etc... Weis Waves indicator: https://www.mql5.com/en/market/pro
FREE
Weis Waves
Flavio Jarabeck
3.3 (23)
The original author is David Weis, an expert in the Wyckoff Method. The Weis Wave is a modern adaptation of the 1930's Wyckoff Method, another expert in Tape Reading techniques and Chart Analysis. Weis Waves takes market volume and stacks it into waves according to price conditions giving the trader valuable insights about the market conditions. If you want to learn more about this subject you can find tons of videos in YouTube. Just look for "The Wickoff Method", "Weis Wave" and "Volume Spread
FREE
The idea of a Value Chart indicator was presented in the very good book I read back in 2020 , " Dynamic Trading Indicators: Winning with Value Charts and Price Action Profile ", from the authors Mark Helweg and David Stendahl. The idea is simple and the result is pure genius: Present candlestick Price analysis in a detrended way! HOW TO READ THIS INDICATOR Look for Overbought and Oversold levels. Of course, you will need to test the settings a lot to find the "correct" one for your approach.
FREE
Aggression Volume
Flavio Jarabeck
3.79 (19)
Aggression Volume Indicator is the kind of indicator that is rarely found in the MQL5 community because it is not based on the standard Volume data provided by the Metatrader 5 platform. It requires the scrutiny of all traffic Ticks requested on the platform... That said, Aggression Volume indicator requests all Tick Data from your Broker and processes it to build a very special version of a Volume Indicator, where Buyers and Sellers aggressions are plotted in a form of Histogram. Additionally,
FREE
Market Profile 3 ForexArby com
Hussien Abdeltwab Hussien Ryad
3.8 (5)
Market Profile 3 MetaTrader 5 indicator  version 4.70— is a classic Market Profile implementation that can show the price density over time, outlining the most important price levels, value area, and control value of a given trading session. This indicator can be attached to timeframes between M1 and D1 and will show the Market Profile for daily, weekly, monthly, or even intraday sessions. Lower timeframes offer higher precision. Higher timeframes are recommended for better visibility. It is als
FREE
This indicator sums up the difference between the sells aggression and the buys aggression that occurred in each Candle, graphically plotting the waves of accumulation of the aggression volumes.   Through these waves an exponential average is calculated that indicates the direction of the business flow. Note: This indicator DOES NOT WORK for Brokers and/or Markets WITHOUT the type of aggression (BUY or SELL).   Be sure to try our Professional version with configurable features and alerts:  Agr
FREE
The indicator displays the total volume in the price movement. This allows easily determining the supply and demand on the market and reversal points. It works in any Forex markets, futures, stocks.  It does not redraw, the construction algorithm allows you to work with any instrument on any timeframe, regardless of the volatility "without adjustment to the instrument." The ideas from the books of David Weiss  "A Modern Adaptation of the Wyckoff Method" and Timothy Orda  "The_Secret_Science_of_P
FREE
The Penta-O is a 6-point retracement harmonacci pattern which usually precedes big market movements. Penta-O patterns can expand and repaint quite a bit. To make things easier this indicator implements a twist: it waits for a donchian breakout in the right direction before signaling the trade. The end result is an otherwise repainting indicator with a very reliable trading signal. The donchian breakout period is entered as an input. [ Installation Guide | Update Guide | Troubleshooting | FAQ | A
FREE
The Weis Waves RSJ Indicator sums up volumes in each wave. This is how we receive a bar chart of cumulative volumes of alternating waves. Namely the cumulative volume makes the Weis wave charts unique. It allows comparing the relation of the wave sequence characteristics, such as correspondence of the applied force (expressed in the volume) and received result (the price progress). If you still have questions, please contact me by direct message:  https://www.mql5.com/en/users/robsjunqueira/
FREE
Micro  Demo  ******************* Секундные графики в Meta Trader 5 ********************** Более точного инструмента для входа в сделку вы не найдёте. Платная полная версия:  Micro "Second charts" В демоверсии секундные периоды сменяются случайным образом через случайные интервалы времени. Отсутствует автоматическая настройка периодов бесплатных индикаторов.   Входные параметры: Displayed bars - отображаемые бары Step of price levels, pp, 0-off - шаг отрисовки ценовых уровней, пункты Scale
FREE
This indicator calculates the volume profile and places labels that correspond to the VAH, VAL and POC levels, for each candle individually. Indicator operation features The indicator works on the timeframes from M3 to MN, but it uses the history data of smaller periods: M1 - for periods from M3 to H1, M5 - for periods from H2 to H12, M30 - for the D1 period, H4 - for the W1 period, D1 - for the MN period. The color and location of the VAL, VAH and POC labels on the current candle are consider
FREE
The indicator analyzes the volume scale and splits it into two components - seller volumes and buyer volumes, and also calculates the delta and cumulative delta. The indicator does not flicker or redraw, its calculation and plotting are performed fairly quickly, while using the data from the smaller (relative to the current) periods. The indicator operation modes can be switched using the Mode input variable: Buy - display only the buyer volumes. Sell - display only the seller volumes. BuySell -
FREE
Weis Wave
Sergey Mylnikov
5 (4)
The indicator displays the total or average volume in the price movement. Due to this, it is easy to determine the demand and supply in the market, turning points. It works in any Forex markets, futures, stocks.  It does not redraw, the construction algorithm allows you to work with any instrument on any timeframe, regardless of the volatility "without adjustment to the instrument." The ideas from the books of David Weiss  "A Modern Adaptation of the Wyckoff Method" and Timothy Orda  "The_Secret
FREE
Market profile was developed by Peter Steidlmayer in the second half of last century. This is a very effective tool if you understand the nature and usage. It's not like common tools like EMA, RSI, MACD or Bollinger Bands. It operates independently of price, not based on price but its core is volume. The volume is normal, as the instrument is sung everywhere. But the special thing here is that the Market Profile represents the volume at each price level. 1. Price Histogram The Price Histogram
50 USD
A countdown timer for the  Volume bar chart generator  and  Tick chart generator  products, which are available for download from the MQL5 Market: Tick chart generator: https://www.mql5.com/en/market/product/29215 Volume bar chart generator: https://www.mql5.com/en/market/product/47197 The counter conveniently displays the number of ticks or transactions (depending on the chart) that need to pass for a new bar to start printing. The user can set the following indicator inputs. Volume type
FREE
The Donchian Channel Channels are among the most popular tools of technical analysis, as they visually convey to the analyst the limits within which most price movement tends to occur. Channel users know that valuable information can be obtained at any time, whether prices are in the central region of a band or close to one of the border lines. One of the best known techniques to explore these concepts is Bollinger Bands. However, John Bollinger was not the only one to research the applicatio
FREE
Tabajara V5
Flavio Jarabeck
4.88 (33)
Metatrader 5 version of the famous Andre Machado's Tabajara indicator. If you don't know Andre Machado's Technical Analysis work you don't need this indicator... For those who need it and for those several friend traders who asked this porting from other platforms, here it is... FEATURES 8-period Moving Average 20-period Moving Average 50-period Moving Average 200-period Moving Average Colored candles according to the inflexion of the 20-period MA SETTINGS You can change the Period of all M
FREE
Introduction This indicator detects volume spread patterns for buy and sell opportunity. The patterns include demand and supply patterns. You might use each pattern for trading. However, these patterns are best used to detect the demand zone (=accumulation area) and supply zone (=distribution area). Demand pattern indicates generally potential buying opportunity. Supply pattern indicates generally potential selling opportunity. These are the underlying patterns rather than direct price action. T
FREE
Expansoes M
Marcus Vinicius Da Silva Miranda
The M Extensions are variations of the Golden Ratio (Fibonacci Sequence). It is the World's first technique developed for Candle Projections. Advantages: Easy to plot. Candle anchoring; High and accurate precision as support and resistance; Excellent Risk x Return ratio; Works in any timeframe; Works in any asset / market.   The M Extensions are classified into: M0: Zero point (starting candle) RC: Initial candle control region M1: Extension region 1 M2: Extension region 2 M3: Extension r
FREE
インディケータはチャート上にトレンドラインを描画します。このインジケーターには6つの入力があります。ユーザーは両方の行に代替ラベルを指定できます。インジケーターの複数のインスタンスが使用される場合、ラベルは異なっている必要があります。ユーザーは、線の幅と色、および使用する重要なピークを指定する深さを設定できます。たとえば、Depth = 10は、現在の山と谷を使用してトレンドラインを設定します。この山と谷は、左右に少なくとも10本のバーがあり、高/低がピークの高/低よりも小さい/大きいです。インジケーターは、以前の山と谷もペイントします。インジケーターには、価格がサポート/レジスタンスラインから事前に設定された距離にあるときにユーザーに通知するために使用できるアラート機能が追加されています。アラート距離はピップで設定されます。
FREE
Are you tired of drawing trendlines every time you're analyzing charts? Or perhaps you would like more consistency in your technical analysis. Then this is for you. This indicator will draw trend lines automatically when dropped on a chart. How it works Works similar to standard deviation channel found on mt4 and mt5. It has 2 parameters: 1. Starting Bar 2. Number of bars for calculation The   starting bar   is the bar which drawing of the trend lines will begin, while the   number of bars for c
FREE
Accurate
Aleksandr Kostusev
5 (1)
The indicator automatically builds patterns of the following types - "Bullish Flag", "Bearish Flag", "Bullish Pennant", "Bearish Pennant", "Bullish Falling Wedge", "Bearish Rising Wedge". The indicator also signals a possible entry point with arrows. The indicator is multi-currency, you can trade everything from cryptocurrencies to indices. The higher the timeframe of the instrument on which the indicator stands, the more accurate the entry point and the price movement will be much longer!  
FREE
You can download the Full version with more features here . Introduction Harmonic Patterns are best used to predict turning point. Harmonic Patterns give you high win rate and high opportunities for trade in during one day. This indicator detects the best and successful patterns base on Harmonic Trading books by Mr. Scott M.. Main Features Detect the best and   most successful patterns : Gartley, Bat, Crab, Butterfly, Cypher, Shark, Alt_Bat, Deep_Crab Easy-to-use and user friendly indicator Sca
FREE
Donchian Channel is an indicator created by Richard Donchian. It is formed by taking the highest high and the lowest low of the last specified period in candles. The area between high and low is the channel for the chosen period. Its configuration is simple. It is possible to have the average between the upper and lower lines, plus you have alerts when price hits one side. If you have any questions or find any bugs, please contact me. Enjoy! This is a free indicator, but it took hours to develo
FREE
Wave Box Market Frenquency
Jean Jacques Huve Ribeiro
4.75 (4)
Totally linked to the result of a movement and the duration he had. Its height records how many ticks the asset walked during a given movement, its width shows us the duration that movement had. Its configuration must be in line with the Weis Wave Indicator configuration to observe the movement force and can indicate a possible accumulation or distribution of the movement;
FREE
MIDAS Super VWAP
Flavio Jarabeck
4.23 (13)
Imagine VWAP, MVWAP and MIDAS in one place... Well, you found it! Now you can track the movement of Big Players in various ways, as they in general pursue the benchmarks related to this measuring, gauging if they had good execution or poor execution on their orders. Traders and analysts use the VWAP to eliminate the noise that occurs throughout the day, so they can measure what prices buyers and sellers are really trading. VWAP gives traders insight into how a stock trades for that day and deter
FREE
This scanner shows the trend values of the well known indicator SuperTrend for up to 15 instruments and 21 time frames. You can get alerts via MT5, Email and Push-Notification as soon as the direction of the trend changes. Important Information You have many possibilities to use the scanner. Here are two examples: With this scanner you can trade a top-down approach easily. If two higher time frames e.g. W1 and D1 are already showing green values (upward trend) but the H12 time frame shows a re
FREE
MW Volume
Martin Bittencourt
4.67 (3)
The Martinware Volume indicator plots a colored moving average over volume bars. The coloring uses three colors and can be done in different ways choosable by the user and is applied both to the average as to the volume bars. Three types of coloring are possible: None: no coloring is done Increasing or decreasing: changes the color depending on the current value being bigger or lesser than the previous one Volume relative to average: colors vary if the current volume is bigger or lesser then
FREE
VWAP and MVWAP
Flavio Jarabeck
4.29 (7)
Volume Weighted Average Price (VWAP) is a trading benchmark commonly used by Big Players that gives the average price a Symbol has traded throughout the day. It is based on both Volume and price. Additionally we put in this indicator the MVWAP (Moving Volume Weighted Average Price). For those who do not know the usage and the importance od this indicator I recommend a great article about this subject at Investopedia ( https://www.investopedia.com/articles/trading/11/trading-with-vwap-mvwap.asp )
FREE
Stackable VWAP
Flavio Jarabeck
3.8 (5)
Volume Weighted Average Price (VWAP) is a trading benchmark commonly used by Big Players that gives the average price a Symbol has traded throughout the day. It is based on both Volume and price. Additionally we put in this indicator the MVWAP (Moving Volume Weighted Average Price). For those who do not know the usage and the importance od this indicator I recommend a great article about this subject at Investopedia ( https://www.investopedia.com/articles/trading/11/trading-with-vwap-mvwap.asp
FREE
このプロダクトを購入した人は以下も購入しています
ICT, SMC, SMART MONEY CONCEPTS, SMART MONEY, Smart Money Concept, Support and Resistance, Trend Analysis, Price Action, Market Structure, Order Blocks, BOS/CHoCH,   Momentum Shift, HH/LL/HL/LH,    Fair Value Gap, FVG,  Premium  &   Discount   Zones, Fibonacci Retracement, OTE, Buy Side Liquidity, Sell Side Liquidity, BSL/SSL Taken, Equal Highs & Lows, MTF, Multiple Time Frame, BigBar, HTF OB, HTF Market Structure,  Liquidity Voids, Long Wicks, Candle Timer, Fractals, ZigZag, Time Zone, Market S
63 USD
これはMT5のインジケーターで、再描画なしで取引に参入するための正確なシグナルを提供します。 外国為替、暗号通貨、金属、株式、インデックスなど、あらゆる金融資産に適用できます。かなり正確な見積もりを提供し、取引を開始して終了するのに最適な時期を教えてくれます。1つのシグナルを処理しただけでインジケーターの元が取れた例の 動画 (6:22)をご覧ください。Entry PointsPro インジケーターの助けを借りたほとんどのトレーダーの最初の1週間の結果が改善しています。 Telegramグループ に登録してください。Entry Points Proインジケーターのメリットは次の通りです。 再描画のないエントリーシグナル 再描画されるインジケーターでは一度表示されたシグナルが削除されて大きな金銭的損失につながることがありますが、これと異なり、表示されて確認されたシグナルは消えることがありません。 エラーなしの取引開始 インジケーターアルゴリズムによって取引を開始する(資産を売買する)理想的な瞬間を見つけることができます。それを使用するすべてのトレーダーの成功率が向上します。
125 USD
Gold Stuff mt5
Vasiliy Strukov
4.97 (92)
Gold Stuff mt5 は、金専用に設計されたトレンド指標であり、あらゆる金融商品にも使用できます。 インジケーターは再描画せず、遅れません。 推奨時間枠 H1. 設定と個人的なボーナスを得るために、購入後すぐに私に連絡してください!   設定 矢印を描く - オンオフ。 チャートに矢印を描く。 アラート - 可聴アラートのオンオフ。 メール通知 - オンオフ。 電子メール通知。 プチ通知 - オンオフ。 プッシュ通知。 次に、色域を調整します。 Gold Stuff mt5 は、金専用に設計されたトレンド指標であり、あらゆる金融商品にも使用できます。 インジケーターは再描画せず、遅れません。 推奨時間枠 H1. 設定と個人的なボーナスを得るために、購入後すぐに私に連絡してください!   設定 矢印を描く - オンオフ。 チャートに矢印を描く。 アラート - 可聴アラートのオンオフ。 メール通知 - オンオフ。 電子メール通知。 プチ通知 - オンオフ。 プッシュ通知。 次に、色域を調整します。
50 USD
トレンドインジケーター、1つのツールに組み込まれたすべての重要なトレンド機能を備えたトレンドトレーディングとフィルタリングのための画期的なユニークなソリューション! これは、すべてのシンボル/商品(外国為替、商品、暗号通貨、インデックス、株式)で使用できる100%再描画されていないマルチタイムフレームおよびマルチ通貨インジケーターです。 トレンドスクリーナーは、チャート内のドットで矢印トレンドシグナルを提供するインジケーターに続く効率的なインジケーターです。 トレンド分析インジケーターで使用できる機能: 1.トレンドスキャナー。 2.最大利益分析を備えたトレンドライン。 3.トレンド通貨強度メーター。 4.アラート付きのトレンド反転ドット。 5.アラート付きの強いトレンドドット。 6.トレンド矢印 毎日の分析例、毎日のシグナルパフォーマンス...など、トレンドスクリーナーインジケーターを使用して、ここで見つけることができます: ここをクリックしてください トレンドスクリーナーMT4バージョンはこちらから入手できます: https://www.mql5.com/en/market/pro
50 USD
Supply Demand uses previous price action to identify potential imbalances between buyers and sellers. The key is to identify the better odds zones, not just the untouched ones. Blahtech Supply Demand indicator delivers functionality previously unavailable on any trading platform. This 4-in-1 indicator not only highlights the higher probability zones using a multi-criteria strength engine, but also combines it with multi-timeframe trend analysis, previously confirmed swings and engulfing detecto
142 USD
現在33%オフ 初心者にもエキスパートトレーダーにも最適なソリューション このインジケーターは独自の機能と新しい公式を多数内蔵しており、ユニークで高品質かつ手頃な取引ツールです。このアップデートでは、2つの時間枠ゾーンを表示できるようになります。より長いTFだけでなく、チャートTFとより長いTF(ネストゾーンを表示)の両方を表示できます。すべてのSupply Demandトレーダーの皆さんのお気に召すはずです。:) 重要情報の公開 Advanced Supply Demandの可能性を最大化するには、 https://www.mql5.com/ja/blogs/post/720245 にアクセスしてください。   エントリーまたはターゲットの正確なトリガーポイントを正確に特定できれば取引がどのように改善されるか想像してみてください。新しい基盤となるアルゴリズムに基づいて構築されているため、買い手と売り手の間の潜在的な不均衡をさらに簡単に特定できます。これは、最も強い需要と供給のゾーンと、過去のパフォーマンス(古いゾーンを表示)がグラフィカルに表現されるためです。これらの機能は、最適
199 USD
1 つのシステムでのトレンド レベルとブレイクダウン レベルの組み合わせ。高度なインジケーター アルゴリズムは、市場のノイズをフィルター処理し、トレンド、エントリー ポイント、および可能なエグジット レベルを決定します。インジケーターシグナルは統計モジュールに記録されるため、最適なツールを選択してシグナル履歴の有効性を示すことができます。この指標は、テイクプロフィットとストップロスのマークを計算します。 マニュアルと説明書 ->   ここ / MT4 バージョン ->   ここ インジケーターで取引する方法: Trend Predictor での取引は、たった 3 つの簡単なステップです。 ステップ 1 - ポジションを開く 70% 以上の成功率で買いシグナルが受信されました ステップ 2 - ストップロスの決定 逆信号でトランクを選択 ステップ 3 - テイクプロフィット戦略の定義 戦略 1: TP1 に到達したらポジション全体をクローズする 戦略 2: TP1 に達した時点でポジションの 50% をクローズし、TP2 に達した時点で残りの 50% をクローズします。 戦略 3:
55 USD
ブレーカートレーダーになり、価格が反転すると市場構造からの利益が変化します。 注文ブロックブレーカーインジケーターは、トレンドまたは価格の動きが枯渇に近づいており、逆転の準備ができていることを識別します。通常、反転または大規模なプルバックが発生しようとしているときに発生する市場構造の変化について警告します。 この指標は、ブレイクアウトと価格の勢いを識別する独自の計算を使用します。使い果たされる可能性のあるポイントの近くで新しい高値が形成されるたびに、インディケーターはその高値の作成を担当する最後の注文ブロックを描きます。次に、移動する価格とともに注文ブロックを追跡します。その後、価格が反対方向にシフトし、その注文ブロックを突破すると、新しい市場構造を作成し、トレンドまたは大きな後退の可能性のある反転の開始を警告します。 注文ブロックは、高値/安値が作成される前の最後の反対色のろうそくであり、価格がこれらの重要な領域を下抜けすると、トレンドの短期的ま​​たは長期的な反転の兆候です。 特徴 重要な枯渇点での市場構造の変化を警告します 価格が使い果たされるレベルに近づくと、
49 USD
ADR反転インジケーターは、通常の1日の平均レンジに関連して価格が現在取引されている場所を一目で示します。価格が選択した平均範囲とレベルを超えると、ポップアップ、電子メール、またはプッシュを介して即座にアラートを受け取るため、プルバックと逆転にすばやくジャンプできます。インディケータは、チャート上に1日の平均レンジの極値で水平線を描画し、それらを超える価格の数学的確率が付加されているレベルを超える延長も描画します。詳細については、以下をご覧ください... インジケーターとモニターを補完するADRアラートダッシュボードここでも利用可能なすべてのペア:https:// www.mql5.com/en/market/product/66316 MT4バージョンはこちらからも入手できます:https:// www.mql5.com/en/market/product/62757 通常の1日平均レンジ(ADR)内で価格が取引され、これらのレベルを上回っている時間の約60%は、通常、その後の引き戻し(利益確定)の動きを伴う急激な価格の動きの指標です。毎日の範囲の上部または下部からのプルバ
49 USD
Matrix Arrow Indicator MT5
Juvenille Emperor Limited
5 (11)
マトリックスアローインジケーターMT5は、すべてのシンボル/商品(外国為替、商品、暗号通貨、インデックス、株式)で使用できる100%再描画されていないマルチタイムフレームインジケーターに続くユニークな10in1トレンドです。マトリックスアローインジケーターMT5は、初期段階で現在のトレンドを判断し、最大10の標準インジケーターから情報とデータを収集します。 平均方向移動指数(ADX) 商品チャネルインデックス(CCI) クラシック平研アシキャンドル 移動平均 移動平均収束発散(MACD) 相対活力指数(RVI) 相対力指数(RSI) 放物線SAR ストキャスティクス ウィリアムズのパーセント範囲 すべてのインジケーターが有効な買いまたは売りシグナルを与えると、対応する矢印がチャートに印刷され、次のろうそく/バーの開始時に強い上昇トレンド/下降トレンドを示します。ユーザーは、使用するインジケーターを選択し、各インジケーターのパラメーターを個別に調整できます。マトリックスアローインジケーターMT5は選択されたインディケーターからのみ情報を収集し、それらのデータのみに基づいてアローを印
75 USD
サポート線と抵抗線のプロットにうんざりしていませんか? サポートレジスタンス は、非常に興味深いひねりを加えてチャート内のサポートとレジスタンスラインを自動検出およびプロットするマルチタイムフレームインジケーターです。価格レベルは時間とともにテストされ、その重要性が高まるにつれて、ラインは太くなり、暗くなります。 [ インストールガイド | 更新ガイド | トラブルシューティング | よくある質問 | すべての製品 ] 一晩でテクニカル分析を強化 チャートを閲覧せずに重要な価格レベルを検出 一目ですべての価格レベルの相対的な強さを認識する すべての取引で最大30時間のプロットラインを節約 インジケーターは、すべての価格レベルの年齢を表示します インジケーターは再描画されていません 過去および現在の価格レベルは近接によって崩壊し、現在の市場行動に合わせて調整されます。動作は、必ずしもピークではない場所に線が引かれます。 価格レベルは、時間とともに拒否されるにつれて、より暗く、より広くなります ノイズを避けるために、重要でない価格レベルは定期的にクリアされます カスタマイズ可能な時間枠の
99 USD
ADRアラートダッシュボードは、価格が通常の1日の平均範囲に関連して現在取引されている場所を一目で示します。価格が選択した平均範囲とレベルを超えると、ポップアップ、電子メール、またはプッシュを介して即座にアラートを受け取るため、プルバックと逆転にすばやくジャンプできます。ダッシュは空白のチャートに配置されるように設計されており、バックグラウンドに座ってレベルに達したときに警告を発するので、座って見たり、まったく見たりする必要はありません。 ここで利用可能なMT4バージョン:https:// www.mql5.com/en/market/product/62756 NEW:毎週と毎月の平均範囲とそれらへのアラートも表示されるようになりました! ここでチャートのレベルを下げるADRリバースインジケーターを入手してください:https:// www.mql5.com/en/market/product/64477 通常の1日平均レンジ(ADR)内で価格が取引され、これらのレベルを上回っている時間の約60%は、通常、その後の引き戻し(利益確定)の動きを伴う急激な価格の動きの指
49 USD
Royal Scalping Indicator is an advanced price adaptive indicator designed to generate high-quality trading signals. Built-in multi-timeframe and multi-currency capabilities make it even more powerful to have configurations based on different symbols and timeframes. This indicator is perfect for scalp trades as well as swing trades. Royal Scalping is not just an indicator, but a trading strategy itself. Features Price Adaptive Trend Detector Algorithm Multi-Timeframe and Multi-Currency Trend Low
149 USD
Introduction to X3 Chart Pattern Scanner X3 Cherart Pattern Scanner is the non-repainting and non-lagging indicator detecting X3 chart patterns including Harmonic pattern, Elliott Wave pattern, X3 patterns, and Japanese Candlestick patterns. Historical patterns match with signal patterns. Hence, you can readily develop the solid trading strategy in your chart. More importantly, this superb pattern scanner can detect the optimal pattern of its kind. In addition, you can switch on and off individu
250 USD
Offer 249 down from 350 for the next 3 copies. then back to 350 $ Are you tired of using outdated indicators that leave you guessing where to set your profit targets? Look no further than the AK CAP Opening Range Breakout Indicator. This powerful tool is backed by a US patent and has already helped countless traders pass funded challenges like FTMO. We use it daily on our prop traders and internal funds, and now it's available to you as well. The calculation behind the indicator is incredibly
249 USD
トレンドラインは、外国為替取引におけるテクニカル分析の最も重要なツールです。残念ながら、ほとんどのトレーダーはそれらを正しく描画していません。自動トレンドラインインジケーターは、市場のトレンドの動きを視覚化するのに役立つ本格的なトレーダー向けのプロフェッショナルツールです。 トレンドラインには、強気トレンドラインと弱気トレンドラインの2種類があります。 上昇トレンドでは、外国為替トレンドラインは価格変動の最低スイングポイントを介して描画されます。 少なくとも2つの「最低安値」を接続すると、トレンドラインが作成されます。 下降トレンドでは、トレンドラインは価格変動の最も高いスイングポイントを介して描画されます。 少なくとも2つの「最高値」を接続すると、トレンドラインが作成されます。 トレンドラインが壊れたとき? 弱気のろうそくが強気のトレンドラインの下で閉じ、ろうそくの高さがトレンドラインの上にあるとき、強気のトレンドラインは壊れます。 強気のろうそくが弱気のトレンドラインの上で閉じ、ろうそくの安値がトレンドラインの下にあるとき、弱気のトレ
99 USD
Royal Wave Pro M5
Vahidreza Heidar Gholami
5 (2)
Royal Wave is a Trend-Power oscillator which has been programmed to locate and signal low-risk entry and exit zones. Its core algorithm statistically analyzes the market and generates trading signals for overbought, oversold and low volatile areas. By using a well-designed alerting system, this indicator makes it easier to make proper decisions regarding where to enter and where to exit trades. Features Trend-Power Algorithm Low risk Entry Zones and Exit Zones Predictions for Overbought and Over
129 USD
Stargogs Spike Catcher V3 This Indicator is Developed To milk the BOOM and CRASH indices . Send me Message if you need any help with the indicator.  CHECK OUT THE STARGOGS SPIKE CATCHER EA/ROBOT V3: CLICK HERE ALSO CHECK OUT SECOND TO NONEFX SPIKE CATCHER:   CLICK HERE STARGOGS SPIKE CATCHER V3 WHATS NEW! Brand New Strategy. This is the Indicator you need for 2023. The Indicator Gives you an Entry at a time when conditions are met and you should use TP & SL. New Trendline that changes color in
100 USD
Market Profile defines a number of day types that can help the trader to determine market behaviour. A key feature is the Value Area, representing the range of price action where 70% of trading took place. Understanding the Value Area can give traders valuable insight into market direction and establish the higher odds trade. It is an excellent addition to any system you may be using. Blahtech Limited presents their Market Profile indicator for the MetaTrader community. Inspired by Jim Dalton’s
142 USD
このダッシュボードは、市場構造反転インジケーターで使用するためのアラートツールです。主な目的は、特定の時間枠での取消の機会と、インジケーターと同様にアラートの再テスト(確認)についてアラートを出すことです。ダッシュボードは、それ自体でチャート上に配置され、バックグラウンドで動作して、選択したペアと時間枠でアラートを送信するように設計されています。多くの人々が1つのMT4の複数のチャートで市場反転インジケーターを実行するのではなく、一度に複数のペアと時間枠を監視するためにダッシュを要求した後に開発されました。 M5、M15、M30、H1、H4、およびD1の時間枠でアラートを出します。もちろん、取引の場合と同様に、より高い時間枠が最も効果的です。 長方形を描画し、特定のペアの市場構造の変化を警告するために作成したインジケーターがダッシュボードを実行します。 ダッシュボードを使用すると、複数のペアと時間枠を監視し、1つのチャートを開いたときにアラートを受け取ることができます。 このダッシュボードは、市場構造反転インジケーターのアドオンとして設計されています。それは独立して機能し、マーケ
49 USD
インジケーターガイド  |  Owl Smart Levels戦略   |   MT4版  |  インストールする方法?   |   FAQ Owl Smart Levels Indicator は、 Bill Williams の高度なフラクタル、市場の正しい波構造を構築する Valable ZigZag、エントリの正確なレベルをマークする Fibonacci レベルなどの一般的な市場分析ツールを含む 1 つのインジケーター内の完全な取引システムです。 利益を得るために市場と場所に。 7日間のプロモーション-最大42%の割引。 取引システムの詳細な説明については、 Owl Trend Strategy - Smart Levels の記事を参照してください  力はシンプルさにあります! Owl Smart Levels 取引システムは非常に使いやすいので、専門家にも、市場を勉強し始めて自分で取引戦略を選択し始めたばかりの人にも適しています。 戦略と指標に秘密の数式や計算方法が隠されているわけではなく、すべての戦略指標は公開されています。 Owl Smart Levels を使用す
107 USD
サポートとレジスタンススクリーナーは、1つのインジケーター内に複数のツールを提供するMetaTraderの1つのレベルインジケーターにあります。 利用可能なツールは次のとおりです。 1.市場構造スクリーナー。 2.強気のプルバックゾーン。 3.弱気プルバックゾーン。 4.デイリーピボットポイント 5.毎週のピボットポイント 6.毎月のピボットポイント 7.ハーモニックパターンとボリュームに基づく強力なサポートとレジスタンス。 8.銀行レベルのゾーン。 期間限定オファー:HVサポートおよびレジスタンスインジケーターは、50ドルと生涯でのみご利用いただけます。 (元の価格125 $) MQL5ブログにアクセスすると、分析例を含むすべてのプレミアム指標を見つけることができます。 ここをクリックしてください。 主な機能 ハーモニックおよびボリュームアルゴリズムに基づく強力なサポートおよびレジスタンスゾーン。 ハーモニックおよびボリュームアルゴリズムに基づく強気および弱気のプルバックゾーン。  市場構造スクリーナー 毎日、毎週、毎月のピボットポイント。 ドキュメント すべてのサ
50 USD
Auto Order Block with break of structure Detect Break of Structure , Mark Order Block and draw Entry / Stop and Risk to Reward lines when Order block is touch by price with Alert. Trend is Manually set to filter signals in a direction by a button on the chart. Entry / Stop and Risk to Reward lines can also be switch on / off by button on chart. Futures Auto Mark Break of Structure Auto Mark Order block Auto Mark higher time frame Point Of  Interest ( POI ) Popup Alert when BoS , Order block
55 USD
BUY INDICATOR AND GET EA FOR FREE AS A BONUS + SOME OTHER GIFTS! ITALO VOLUME INDICATOR  is the best volume indicator ever created, and why is that? The Indicator works on all time-frames and assets, indicator built after 6 years of experience on forex and many other markets. You know many volume indicators around the internet are not complete, does not help, and it's difficult to trade, but the Italo Volume Indicator is different , the Italo Volume Indicator shows the wave volume, when market
65 USD
**   All Symbols   x   All Timeframes   scan just by pressing scanner button ** *** Contact me immediately after the purchase to send you instructions and add you in "Market Structure group" for sharing or seeing experiences with other users. CURRENT PRICE $39..... Future Price $200 Introduction: Market structure is important for both new and professional traders since it can influence the liquidity and price action of a market. It’s also one of the most commonly used techniques to understand tr
39 USD
発見が困難で頻度が少ないため、分岐は最も信頼できる取引シナリオの1つです。このインジケーターは、お気に入りのオシレーターを使用して、通常の隠れた分岐点を自動的に見つけてスキャンします。 [ インストールガイド | 更新ガイド | トラブルシューティング | よくある質問 | すべての製品 ] 取引が簡単 通常の隠れた発散を見つけます 多くのよく知られている発振器をサポート ブレイクアウトに基づいて取引シグナルを実装します 適切なストップロスおよび利益レベルを表示します 設定可能なオシレーターパラメーター カスタマイズ可能な色とサイズ バー単位でサイズ別に分岐をフィルタリング パフォーマンス統計を実装します 電子メール/音声/視覚アラートを実装します 幅広い市場の見通しを提供するために、異なるオシレーターを使用して、干渉なしで同じチャートにインジケーターを何度もロードできます。このインジケーターは、次のオシレーターをサポートしています。 RSI CCI MACD オスマ 確率的 勢い 素晴らしい発振器 加速器発振器 ウィリアムズパーセントレンジ 相対活力指数 特に外国為替市
125 USD
トレンド スキャナーは、マルチシンボルおよびマルチタイム フレームから市場トレンドをスキャンし、チャート上の可動パネルに表示します。分析にはゴールド スタッフ インジケーターを使用します。機能には、アラート、電子メール、およびプッシュ通知が含まれます。 トレーダーは、自分が選んだペアを複数選択して表示できます。 トレンド スキャナーは、トレンドの方向性を確認するための優れたツールであり、トレンドに従って売買注文のみを許可することで、手動取引または EA 取引に使用できます。 機能には、アラート、電子メール、およびプッシュ通知が含まれます。 トレーダーは、自分が選んだペアを複数選択して表示できます。 トレンド スキャナーは、トレンドの方向性を確認するための優れたツールであり、トレンドに従って売買注文のみを許可することで、手動取引または EA 取引に使用できま リアルタイム結果はこちらからご覧いただけます。 設定と個人的なボーナスを得るために、購入後すぐに私に連絡してください!
50 USD
次世代の自動化された需要と供給のゾーン。どのチャートでも機能する新しい革新的なアルゴリズム。すべてのゾーンは、市場の価格行動に従って動的に作成されています。 2種類のアラート --> 1) 価格がゾーンに達したとき 2) 新しいゾーンが形成されたとき もう 1 つの役に立たない指標はありません。実績のある完全な取引戦略を手に入れることができます。     新機能:     価格が需給ゾーンに達したときにアラートを出す     新しい需給ゾーンが作成されたときにアラートを発します     プッシュ通知アラート     ピップ単位のゾーン幅ラベル     MTF のもう 1 つのタイムフレーム。したがって、現在より 2 時間足高いのではなく、現在より 3 時間足し上に見えるようになります。     アラート/ゾーン/MTF 機能を有効/無効にするボタン あなたが得る利点:     取引から感情を取り除きます。     取引エントリをオブジェクト化します。     確率の高いセットアップで利益
149 USD
サポートと抵抗のレベルは、長い間、市場分析のための強力なツールとなっています。 強力なサポート指標は、現地価格の最小値に基づいてサポートレベルをプロットし、現地価格の最大値に基づいて抵抗レベルをプロットします。 私の他の開発はここで見ることができます これは、トレンドに応じて取引し、同時に統合またはトレンド反転のゾーンを決定し、ストップロスを設定し、サポートと抵抗レベルで利益を取ることがで 設定と個人的なボーナスを受け取るために購入後すぐに私に連絡してください! 受信パラメータ - インジケータは複雑な設定を必要とせず、主なパラメータはカラースケールの調整です。 サポートと抵抗のレベルは、長い間、市場分析のための強力なツールとなっています。 強力なサポート指標は、現地価格の最小値に基づいてサポートレベルをプロットし、現地価格の最大値に基づいて抵抗レベルをプロットします。 私の他の開発はここで見ることができます これは、トレンドに応じて取引し、同時に統合またはトレンド反転のゾーンを決定し、ストップロスを設定し、サポートと抵抗レベルで利益を取ることがで
50 USD
** All Symbols x All Timeframes scan just by pressing scanner button ** ***Contact me after purchase to send you instructions and add you in "123 scanner group" for sharing or seeing experiences with other users. After 15 years of experience in the markets and 3 years of programming, Winner indicator is ready. I would like to share with you! Introduction The 123 Pattern Scanner indicator with a special enhanced algorithm is a very repetitive common pattern finder with a high success rate . Inte
39 USD
作者のその他のプロダクト
Description Very robust and powerful indicator, which allows through its 4 components, trade the market in trend or not trending conditions. it based on a very reliable trading strategy and gives you all you need to be succesful in trading. KEY LINKS:   Indicator Manual  –  How to Install   –  Frequent Questions  -  All Products  How is Clever Scalper Pro useful to you? A complete and reliable trading strategy. Easy to understand and trade Allow to identify trend, confirm it, look for retraceme
FREE
Description: The indicator measures, through the zigzag indicator, the levels of trend or correction. It shows in the chart the levels of each low or high detected. KEY LINKS:   How to Install  –  Frequent Questions  -  All Products  How is this indicator useful? This indicator determines, depending on Zigzag parameter if a trend is beginning, developing, or ending This indicator determines the direction of the trend Components Levels as positive or negative numbers, depending on the direction
FREE
The indicator is based on a proven successful strategy. It shows buys and sello signals with suggested stop and target. In the same way, it calculates the essential trading analysis statistics as successful and profit ratio. KEY LINKS:  Indicator Manual  –  How to Install  -  Frequent Questions  -  All Products  Indicator features Effective and understandable signals. It can be used as a complete trading strategy. Complete trading statistics to evaluate the indicator performance. It shows exact
FREE
Description Better version of MACD indicator which offer a complete visual trading strategy and realize an auto-optimization KEY LINKS:  How to Install  –  Frequent Questions  -  All Products  How is this indicator useful? NEVER repaints. Detect best parameters of MACD indicator, based on profit factor during the specified period. This indicator can be used as a visual strategy, following the recommendations of entry, stop, and targets. Indicator features It can be used as a complete trading s
FREE
Description: The indicator predicts, with a specific probability, if the actual candlestick range will expand or contract compared to the range of a previous candle. Furthermore, the indicator shows the possible high or low of the actual candle, based on trend direction. (Recommended for Daily, Weekly, or Monthly timeframes). KEY LINKS:   Indicator Manual  –  How to Install  –  Frequent Questions  -  All Products  How to use the indicator: Determines, with a certain probability, if there will
FREE
Description Better version of RSI indicator which offer a complete visual trading strategy and realize an auto-optimization Support:   We create great tools for the entire trading community. Most of them are free. If you believe in what we do  Support Us Here.   KEY LINKS:   How to Install  –  Frequent Questions  -  All Products  How is this indicator useful? NEVER repaints. Detect best parameters of RSI indicator, based on profit factor during the specified period. This indicator can be used as
FREE
Description Very precise patterns to detect: entry signals as well as breakout, support and resistance reversal patterns. It points out zones in which, with a high probability, institutional orders with the potential to change the price’s direction and keep moving towards it, have been placed. Support:   We create great tools for the entire trading community. Most of them are free. If you believe in what we do  Support Us Here.   KEY LINKS:   Indicator Manual  -  All Products  How is this ind
280 USD
Description: Indicator which uses trend, breakout and reversal innovative indicators to show a complete visual trading strategy, with transparent metrics. It follows simple visual patterns, which will improve your trading significantly. Support:   We create great tools for the entire trading community. Most of them are free. If you believe in what we do  Support Us Here.   KEY LINKS:   Indicator Manual  –   How to Install  –  Frequent Questions  -  All Products  Outstanding Features Shows c
FREE
Description The indicator measures a currency’s relative strength, on different timeframes, through certain percentile spread analysis. This allows you to compare which are the strongest currency pairs, against the weakest pairs. These spreads are based on comparison against USD. KEY LINKS:  Indicator Manual  –  How to Install  –  Frequent Questions  -  All Products  How is "Clever Spread Currencies Strength" useful to you? This indicator determines a currency’s strength for different timeframe
FREE
Description Very precise patterns to detect: entry signals as well as breakout, support and resistance reversal patterns. It points out zones in which, with a high probability, institutional orders with the potential to change the price’s direction and keep moving towards it, have been placed.  KEY LINKS:   Indicator Manual  –  How to Install   –  Frequent Questions  -  All Products  How is this indicator useful? It will allow you to trade on the order’s direction, once its direction has been id
290 USD
Description: The indicator shows the TDI indicator in a separate window, and with the RSI component, the indicator finds possible divergences with M or W patterns. KEY LINKS:   How to Install  -   Frequent Questions  -  All Products  Functions: Finds Market Makers patterns. Finds extremes or exhaustion into the market. Looks for a trend continuation. Content: TDI Indicator Divergence and M or W Signals Note 1:  This indicator should only be considered as a part of any trading strategy. You shoul
69 USD
Description Complete breaker market maker Key zones indicator, It provides precise zones where could be an excellent break or reversal opportunity. KEY LINKS:   How to Install  -  Frequent Questions  -  All Products  How is this indicator useful? It will allow you to trade retracement or breakout patterns, every time they occur in a given zone. NEVER repaints. It signals clear possible money management levels as stop and take profit. You’ll be able to identify potential resistance or support lev
200 USD
Description Candle Power Color indicator which shows when the market is trending and when it is in a sideway movement KEY LINKS:   How to Install  –  Frequent Questions  -  All Product How is this indicator useful? It allow to detect trend and sideway movements in market NEVER repaints. It adapts to any market and asset. It can support any other trading strategy. Note 1:  This indicator should only be considered as a part of any trading strategy. You should complement this with other filters (e.
30 USD
Description: The indicator shows the TDI indicator in a separate window, and with the RSI component, the indicator finds possible divergences with M or W patterns. KEY LINKS:   How to Install  –  Frequent Questions  -  All Products  Functions: Finds Market Makers patterns. Finds extremes or exhaustion into the market. Looks for a trend continuation. Content: TDI Indicator Divergence and M or W Signals Note 1:  This indicator should only be considered as a part of any trading strategy. You shoul
69 USD
Description Price action patterns detection that can work as triggers in any trading strategy, It include Flag, Flag Top, Flag 1234, and micro pullback patterns Support:   We create great tools for the entire trading community. Most of them are free. If you believe in what we do  Support Us Here.   How is this indicator useful?  You can use the indicator signals as a trigger to entry in the market and complement any trading strategy. Components Note 1:  This indicator should only be considered a
60 USD
フィルタ:
CSG CSG
1433
CSG CSG 2021.11.15 14:53 
 

Macht einen guten Eindruck, arbeitet sauber. Der Entwickler reagiert schnell auf seine Kunden - Vielen Dank! Eine nützliche Unterstützung im Handelsalltag.

レビューに返信
バージョン 2.3 2023.01.05
Improve Performance
バージョン 2.2 2022.08.17
Improve Performance
バージョン 2.1 2022.07.04
Improve Performance
バージョン 2.0 2021.12.31
Improve Performance
バージョン 1.3 2021.11.17
Eliminate Text in the chart.
バージョン 1.2 2021.01.12
Performance Improvements