• 概要
  • レビュー
  • コメント (2)

Day Pattern

Description:
-
Day Pattern - an indicator that helps to identify patterns of price changes for the development of trading algorithms and strategies.

For whom this tool?
- For developers of trading strategies and algorithms.
- Medium- and long-term traders. Time frames H1-W1.

Features of the indicator:
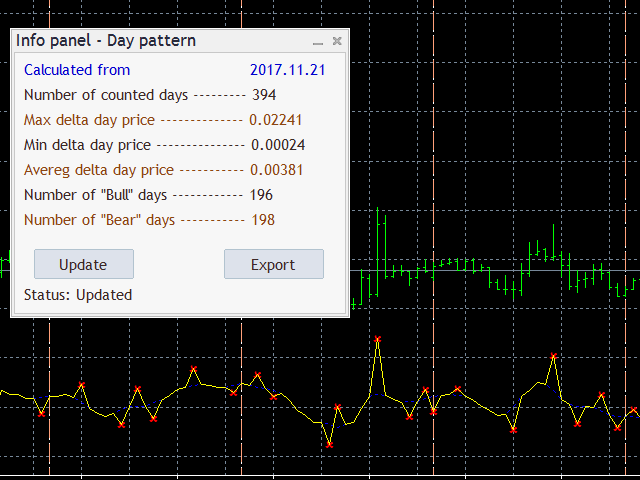
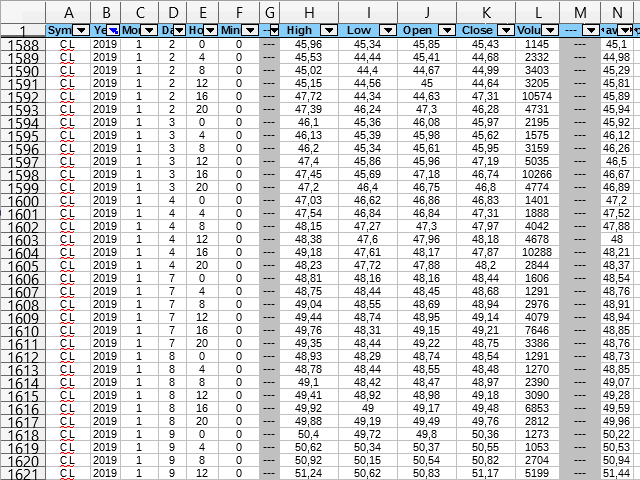
- There is a function of exporting indicator values to a file of the csv format.
- Using the information panel, you can conduct an express analysis of trading tool.
- The indicator is suitable for the research of any trading instruments.

How to use it?
- Recommended time frame is H4.
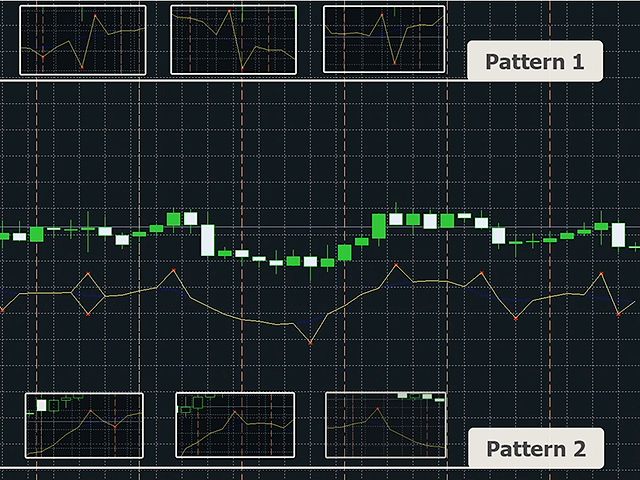
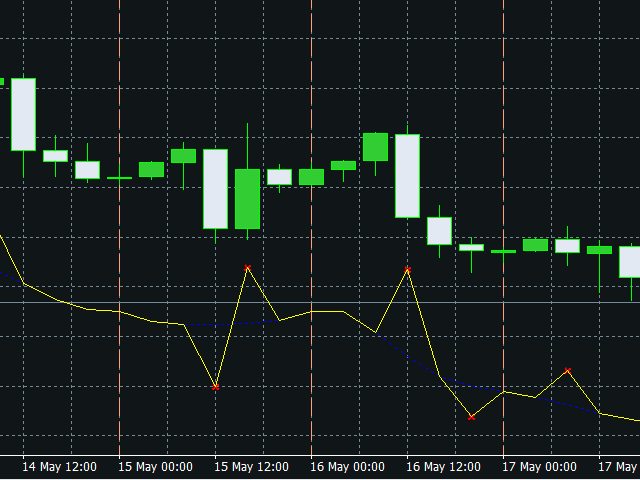
- On the indicator chart we detect patterns. For example, false breakdown in the area of support and resistance.
- The "Export" button saves data in csv format. The files are in the folder ..\ MQL4\Files\Day_Pattern\
- Open the CSV file and perform additional calculations. To statistically prove your guess.
- Continue to identify patterns.

This product is written me for own use. So, if you have any questions or suggestions for something to improve write me.

My other products: https://is.gd/VqiLuN

おすすめのプロダクト
The main idea of this indicator is rates analysis and prediction by Fourier transform. Indicator decomposes exchange rates into main harmonics and calculates their product in future. You may use the indicator as a standalone product, but for better prediction accuracy there is another related indicator - FreqoMaster - which uses FreqoMeterForecast as a backend engine and combines several instances of FreqoMeterForecast for different frequency bands. Parameters: iPeriod - number of bars in the ma
VR Cub
Vladimir Pastushak
VR Cub は、質の高いエントリーポイントを獲得するためのインジケーターです。このインジケーターは、数学的計算を容易にし、ポジションへのエントリーポイントの検索を簡素化するために開発されました。このインジケーターが作成されたトレーディング戦略は、長年にわたってその有効性が証明されてきました。取引戦略のシンプルさはその大きな利点であり、初心者のトレーダーでもうまく取引することができます。 VR Cub はポジション開始ポイントとテイクプロフィットとストップロスのターゲットレベルを計算し、効率と使いやすさを大幅に向上させます。取引の簡単なルールを理解するには、以下の戦略を使用した取引のスクリーンショットを見てください。 設定、設定ファイル、デモ版、説明書、問題解決方法は、以下から入手できます。 [ブログ] レビューを読んだり書いたりすることができます。 [リンク] のバージョン [MetaTrader 5] エントリーポイントの計算ルール ポジションをオープンする エントリーポイントを計算するには、VR Cub ツールを最後の高値から最後の安値までストレッチする必要があります。
The indicator detects and displays М. Gartley's Butterfly pattern. The pattern is plotted by the extreme values of the ZigZag indicator (included in the resources, no need to install). After detecting the pattern, the indicator notifies of that by the pop-up window, a mobile notification and an email. The pattern and wave parameters are displayed on the screenshots. The default parameters are used for demonstration purposes only in order to increase the amount of detected patterns. Parameters
The indicator shows which trading pairs, strategies, robots and signals that you use are profitable and which are not. The statistic of trades and balance graph are displayed in the account currency and pips - to switch simply click on the graph. button "$"(top left) - minimize/expand and move the indicator panel button ">"(bottom right) - stretching and resetting to the original size Statistic of trades 1 line - account balance, current profit and lot of open trades; 2 line - the number of al
Trend PA
Mikhail Nazarenko
5 (3)
The Trend PA indicator uses   Price Action   and its own filtering algorithm to determine the trend. This approach helps to accurately determine entry points and the current trend on any timeframe. The indicator uses its own algorithm for analyzing price changes and Price Action. Which gives you the advantage of recognizing, without delay, a new nascent trend with fewer false positives. Trend filtering conditions can be selected in the settings individually for your trading style. The indicator
The indicator detects and displays Shark harmonic pattern (see the screenshot). The pattern is plotted by the extreme values of the ZigZag indicator (included in the resources, no need to install). After detecting the pattern, the indicator notifies of that by a pop-up window, a mobile notification and an email. The indicator highlights the process of the pattern formation and not just the complete pattern. In the former case, it is displayed in the contour triangles. After the pattern is comple
The Penta-O is a 6-point retracement harmonacci pattern which usually precedes big market movements. Penta-O patterns can expand and repaint quite a bit. To make things easier this indicator implements a twist: it waits for a donchian breakout in the right direction before signaling the trade. The end result is an otherwise repainting indicator with a very reliable trading signal. The donchian breakout period is entered as an input. [ Installation Guide | Update Guide | Troubleshooting | FAQ | A
Owl smart levels
Sergey Ermolov
4.34 (35)
MT5版  |   FAQ Owl Smart Levels Indicator   は、 Bill Williams   の高度なフラクタル、市場の正しい波構造を構築する Valable ZigZag、エントリの正確なレベルをマークする Fibonacci レベルなどの一般的な市場分析ツールを含む 1 つのインジケーター内の完全な取引システムです。 利益を得るために市場と場所に。 戦略の詳細な説明 インジケータを操作するための指示 顧問-取引助手 プライベートユーザーチャット ->購入後に私に書いて、私はプライベートチャットにあなたを追加し、あなたはそこにすべてのボーナスをダウンロードすることができます 力はシンプルさにあります! Owl Smart Levels   取引システムは非常に使いやすいので、専門家にも、市場を勉強し始めて自分で取引戦略を選択し始めたばかりの人にも適しています。 戦略と指標に秘密の数式や計算方法が隠されているわけではなく、すべての戦略指標は公開されています。 Owl Smart Levels を使用すると、取引を開始するためのシグナルをすばやく確認し、
MA CROSSES PRO MT4は移動平均クロスアローインジケーターです。インジケータパラメータには直感的な名前があり、各行は個別に構成されています。インジケータは、矢印を表示したり、音声信号を鳴らしたり、携帯端末や電子メールに通知を送信したりすることで、信号を通知できます。 インジケーターは再描画されません ろうそくの終わりにのみ信号 スキャルピングに最適 任意のペアと任意の時間枠で動作します 時間枠が古いほど、信号は良くなります アドオンとしてあらゆる取引戦略と互換性があります。 オプション: FASTER_MA-動きの速い移動期間; FASTER_MA_METHOD-高速移動平均法。 FASTER_MA_PRICE-中古価格; FASTER_MA_SHIFT-シフト; SLOWER_MA-動きの遅い移動期間。 SLOWER_MA_METHOD-動きの遅い平均化方法。 SLOWER_MA_PRICE-中古価格; SLOWER_MA_SHIFT-シフト; ALERT-ダイアログボックスを表示します。 PUSH_NOTIFICATIONS-モバイル端末に通
The indicator shows the potential trend direction by cyclical-wave dependence. Thus, all the rays of the intersection will be optimal rays, in the direction of which the price is expected to move, taking into account the indicator period. Rays can be used as a direction for potential market movement. But we must not forget that the approach must be comprehensive, the indicator signals require additional information to enter the market.
The indicator detects and displays 3 Drives harmonic pattern (see the screenshot). The pattern is plotted by the extreme values of the ZigZag indicator (included in the resources, no need to install). After detecting the pattern, the indicator notifies of that by a pop-up window, a mobile notification and an email. The indicator highlights the process of the pattern formation and not just the complete pattern. In the former case, it is displayed in the contour triangles. After the pattern is com
インディケータは現在のクオートを作成し、これを過去のものと比較して、これに基づいて価格変動予測を行います。インジケータには、目的の日付にすばやく移動するためのテキスト フィールドがあります。 オプション: シンボル - インジケーターが表示するシンボルの選択; SymbolPeriod - 指標がデータを取る期間の選択; IndicatorColor - インジケータの色; HorisontalShift - 指定されたバー数だけインディケータによって描画されたクオートのシフト; Inverse - true は引用符を逆にします。false - 元のビュー。 ChartVerticalShiftStep - チャートを垂直方向にシフトします (キーボードの上下矢印)。 次は日付を入力できるテキストフィールドの設定で、「Enter」を押すとすぐにジャンプできます。
Introduction to X3 Chart Pattern Scanner X3 Cherart Pattern Scanner is the non-repainting and non-lagging indicator detecting X3 chart patterns including Harmonic pattern, Elliott Wave pattern, X3 patterns, and Japanese Candlestick patterns. Historical patterns match with signal patterns. Hence, you can readily develop the solid trading strategy in your chart. More importantly, this superb pattern scanner can detect the optimal pattern of its kind. In addition, you can switch on and off individu
Reversal Pattern Pro
Boonyapagorn Rodvattanajinda
Reversal Patterns Pro Reversal Patterns Pro is a Price Action (PA) analytical tool that scans the reversal patterns.  - Finds and marks the most dependable Japanese candlestick patterns in real-time. - Supports all time frames (Best for Scalping) - Doesn't repaint making it an exceptional indicator for Expert Advisors. Input parameters : - Support & Resistance Mode ( true or false ) for enabling advanced filtering - Donchian Period - RSI Period - RSI Oversold Level - RSI Overbought Level - 
"The trend is your friend" is one of the best known sayings in investing, because capturing large trendy price movements can be extremely profitable. However, trading with the trend is often easier said than done, because many indicators are based on price reversals not trends. These aren't very effective at identifying trendy periods, or predicting whether trends will continue. We developed the Trendiness Index to help address this problem by indicating the strength and direction of price trend
The Divergent Accuracy indicator is designed to identify discrepancies on the price chart of a currency pair. The Divergent Accuracy indicator recognizes bullish and bearish divergences, and can also output a signal that a divergence has been detected... In addition to identifying divergences, the indicator works with overbought and oversold levels, and also shows arrows to enter the market...
インジケーターは、古典的なガンの角度と同様に、(特定のキャンドルをクリックした後)トレンドラインのファンを構築します。インジケーターの特徴は、固定スケールで角度を作成するだけでなく、特定の数のバーの平均価格を使用することです(オプション)。 インジケーターの角度の平均価格を計算する方法は2つあります(オプション)。 1)高値から安値への(特定の数のバーの)平均価格の動きの計算。 2)平均価格の計算はオープンからクローズに移動します。 オプション: 1.Method -コーナーを構築する方法。 2. FixedScale-固定スケール(メソッドでFixed_Scaleが選択されている場合)。 3.SecondaryAngles-二次角度を描画するための許可を制御します。 4.RayRight-トレンドラインの光線を設定します。 5.DrawBackground-背景として線を描画します。 6.AnglesQuantity-角度の数。 7. Bars_To_Process-期間、バーの数、これに基づいて平均価格が決定され
トレンドキャッチャー: アラートインジケーター付きのトレンドキャッチャーストラテジーは、市場トレンドやポテンシャルなエントリーポイントやエグジットポイントを特定するのに役立つ多目的な技術分析ツールです。動的なトレンドキャッチャーストラテジーを備えており、市場状況に適応してトレンドの方向を明確に視覚化します。トレーダーは、自身の好みやリスク許容度に合わせてパラメーターをカスタマイズできます。このインジケーターはトレンドの識別を支援し、ポテンシャルなリバーサルをシグナルし、トレイリングストップのメカニズムとして機能し、市場への迅速な対応のためのリアルタイムアラートを提供します。 特徴: - トレンドの識別:上昇トレンドと下降トレンドをシグナルします。 - トレンドのリバーサル:ローソク足の色が上昇から下降に変わった場合やその逆の場合に、ポテンシャルなリバーサルを警告します。 - リアルタイムアラート:新しいトレンドの識別に対するアラートを生成します。 推奨事項: - 通貨ペア:EURUSD、AUDUSD、XAUUSDなど... - タイムフレーム:H1。 - アカウン
FREE
We present you the indicator "Candle closing counter", which will become your indispensable assistant in the world of trading. That’s why knowing when the candle will close can help: If you like to trade using candle patterns, you will know when the candle will be closed. This indicator will allow you to check if a known pattern has formed and if there is a possibility of trading. The indicator will help you to prepare for market opening and market closure. You can set a timer to create a p
The main idea of this indicator is rates analysis and prediction by Fourier transform. The indicator decomposes exchange rates into main harmonics and calculates their product in future. The indicator shows 2 price marks in history, depicting price range in the past, and 2 price marks in future with price movement forecast. Buy or sell decision and take profit size are displayed in a text label in the indicator window. The indicator uses another indicator as an engine for calculations - FreqoMet
The indicator displays the data of the Stochastic oscillator from a higher timeframe on the chart. The main and signal lines are displayed in a separate window. The stepped response is not smoothed. The indicator is useful for practicing "manual" forex trading strategies, which use the data from several screens with different timeframes of a single symbol. The indicator uses the settings that are identical to the standard ones, and a drop-down list for selecting the timeframe. Indicator Parame
Trend Scanner
Vladimir Kalendzhyan
4.33 (6)
By purchasing this indicator, you have the right to receive a free copy of one of   my other indicator's or advisor’s!  (All future updates are included. No limits) . To get it , please contact me by  mql5 message ! The Trend Scanner trend line indicator displays the trend direction and its changes. The indicator works on all currency pairs and  timeframes. The indicator simultaneously displays multiple readings on the price chart: the support and resistance lines of the currency pair, the exist
This indicator is the undisputed leader among the indicators. And for this statement there is a good reason. The indicator builds a very high quality channel in which it generates signals to enter! What is the ideal strategy for the trader, since the trader always hesitates when choosing a strategy for the job. That is, this indicator will allow you to solve the dilemma of choosing a job by trend or to the channel, since it combines these two basic concepts. Working with the indicator is very
標準パラメーターを使用したMACDインジケーター波に基づく 最後と最後の2つのMACDウェーブで、それぞれ正と負のフィボナッチレベルを扱います。 現時点でMACDインジケーターで負の波が終了している場合、色は緑です。 現時点でMACDインジケーターの正の波が終了している場合、色は赤です。 Waveの終了基準は、MACDの符号が異なる2ティックです。 最後の4つのMACDウェーブのトレンドラインをプロットします。 専門家とうまく働く  その他のスクリーンショット: Figures MACD   https://www.mql5.com/ru/market/product/42031 https://www.mql5.com/en/charts/10581596/audusd-h1-alpari-international https://www.mql5.com/en/charts/10631979/usdjpy-m1-alpari-international https://www.mql5.com/en/charts/10628704/gbpusd-
The perfect tool for Scalng in the Forex markets You can trade both from signal to signal and using take profit  The algorithm does not use Zigzag!  No redrawing!  This is a channel instrument that uses a moving average as a filter. Moving Average  There are 2 parameters for the settings Ma Period = 5 period Moving Average  Channel 1.0 distance of channel lines from the chart Price Signal Filter - calculation of signal opening and filter There is a complete set of Alert There is a multi-timefram
Trade with Gann on your side!! MASTER CIRCLE 360 CIRCLE CHART, originally created by Gann admitted that this is “The Mother of all charts”. It is one of the last studies that this great trader left for us. The numeric tab le is apparently quite simple like all the tables and is based on square numbers, the SQUARE OF 12 and is by evolution, one of the most important square numbers. Here we can find CYCLE, PRICE AND TIME thanks to angles and grades, to show past and future support and resistance.
Chart Patterns Detect 15 patterns (Ascending Triangle, Descending Triangle, Rising Wedge, Falling Wedge, Bullish Flag, Bearish Flag, Bullish Rectangle, Bearish Rectangle Symmetrical triangle, Head and Shoulders, Inverted Head and Shoulders, Triple top, Triple Bottom, Double Top, Double Bottom) Use historical data to calculate the probability of each pattern to succeed (possibility to filter notification according to the chance of success) gives graphic indication about the invalidation level and
MT4用外国為替インジケーター「サポートレジスタンスレベル」 インジケーター「サポートレジスタンスレベル」はトレードに非常に役立つ補助インジケーターです 「サポート」と「レジスタンス」は価格によって考慮されるチャート上の重要なゾーンです サポートレベルとは、価格が定期的に下落を止めて反発するレベルです。 レジスタンスレベルとは、通常、価格の上昇が止まり、再び下落する場所です。 インジケーター「サポート抵抗レベル」は、最近のレベルを示します。 抵抗レベル - 赤い線。 サポートレベル - 青い線 計算に使用するバーの数、線の種類、色は設定で調整できます インジケーター「サポートレジスタンスレベル」は、価格アクションパターンによるテイクプロフィットターゲット、価格反転、再テストを計画するのに最適です。 // さらに優れたエキスパートアドバイザーとインジケーターはここから入手できます: https://www.mql5.com/en/users/def1380/seller 当MQL5サイトのみでご提供しているオリジナル商品です。
このプロダクトを購入した人は以下も購入しています
Gann Made Easy は、ミスター・ギャンの理論を使用した取引の最良の原則に基づいた、プロフェッショナルで使いやすい外国為替取引システムです。 W・D・ガン。このインジケーターは、ストップロスとテイクプロフィットレベルを含む正確な買いと売りのシグナルを提供します。 PUSH通知を利用して外出先でも取引可能です。 購入後はご連絡ください!私の取引のヒントと素晴らしいボーナスインジケーターを無料で共有します! おそらく、ギャンの取引手法についてはすでに何度も聞いたことがあるでしょう。通常、ギャンの理論は初心者のトレーダーだけでなく、すでにある程度の取引経験がある人にとっても非常に複雑なものです。なぜなら、ギャンの取引手法は理論的にはそれほど簡単に適用できるものではないからです。私はその知識を磨き、最良の原則を私の外国為替インジケーターに組み込むために数年を費やしました。 このインジケーターは非常に簡単に適用できます。必要なのは、それをチャートに添付し、簡単な取引推奨事項に従うだけです。このインジケーターは常に市場分析の仕事を行い、取引の機会を探します。適切なエントリーポイントを検出
指示する     ロシア     -        utilizar con   el indicador の ESP 推奨事項 -   TPSpro トレンド プロフェッショナル版 -   MT5のバージョン 最も重要なことは、将来においても最も重要なことです。 機能のプリンシパル: ゾーンのほとんどは、ベンダーとコンプラドールによってアクティブ化されます。 状況を直感的に把握できるよう、初期の衝動を修正します。 LOGIC AI: MUESTRA zonas (círculos) parabuscar puntos de entrada cuando se activa una plantilla 視覚的に優れた視覚効果があり、最も重要な機能がすべて揃っていることに注意してください。 優れたニベレス/ゾーンの視覚化 (modo MTF) 世界で最も人気のある場所/ゾーンです。これを使用するのに最適な方法です (   TPSproTREND PRO   )。 アルゴリズム プロフェッショナル セパラド パソ ア パソ パラ オペラ それは、オペラハウスやコントラ・デ・エラの指導におい
Trend Punch
Mohamed Hassan
4.95 (19)
This indicator is unstoppable when combined with our other indicator called  Support & Resistance . After purchase, send us a message and you will get it   for  FREE as a BONUS! Introducing Trend Punch , the revolutionary forex trend indicator that will transform the way you trade! Trend Punch is uniquely designed to provide precise buy and sell arrows during strong market trends, making your trading decisions clearer and more confident. Whether you're trading major currency pairs or exotic sym
TPSpro TREND PRO は 、市場を自動的に分析し、トレンドとその各変化に関する情報を提供し、再描画せずに取引に参加するためのシグナルを提供するトレンド指標です。 インディケータは各ローソク足を使用し、個別に分析します。さまざまなインパルス(アップまたはダウンインパルス)を指します。通貨、仮想通貨、金属、株、指数の取引への正確なエントリーポイント! バージョンMT5                   インジケーターの完全な説明   インジケーター -   RFI LEVELS と併用することをお勧めします。 主な機能: レンダリングなしで正確な入力信号! シグナルが表示された場合、それは関連性を維持します。これは、シグナルを提供してからそれを変更する可能性があり、入金時の資金の損失につながる可能性があるリドローインジケーターとの重要な違いです。より高い確率と精度で市場に参入できるようになりました。矢印が表示された後、ターゲットに達する (利益確定) か反転シグナルが表示されるまで、ローソク足を色付けする機能もあります。 STOP LOSS / TAKE PROFIT
まず第一に、この取引インジケーターは再描画されず、再描画されず、遅延しないことを強調する価値があります。これにより、手動取引とロボット取引の両方に理想的なものになります。 ユーザーマニュアル:設定、入力、戦略。 アトミックアナリストは、価格の強さとモメンタムを利用して市場でより良いエッジを見つけるためのPA価格アクションインジケーターです。ノイズや誤ったシグナルを除去し、取引ポテンシャルを高めるための高度なフィルターを備えています。複雑なインジケーターの複数のレイヤーを使用して、アトミックアナリストはチャートをスキャンし、複雑な数学的計算をシンプルなシグナルと色に変換します。これにより、どのような初心者トレーダーでも理解して使用し、一貫した取引の決定を行うことができます。 「アトミックアナリスト」は、新規および経験豊富なトレーダー向けにカスタマイズされた包括的な取引ソリューションです。プレミアムインジケーターとトップノッチの機能を1つの取引戦略に組み合わせ、すべてのタイプのトレーダーにとって汎用性のある選択肢にします。 デイリートレーディングとスキャルピング戦略:高
MetaBands M4
Vahidreza Heidar Gholami
5 (2)
MetaBandsは、強力でユニークなアルゴリズムを使用してチャンネルを描画し、トレンドを検出して、トレーダーに取引の入出ポイントを提供することができます。チャンネル指標に加えて、強力なトレンド指標でもあります。入力パラメータを使用して新しいチャンネルを作成するために、異なるタイプのチャンネルを統合することができます。MetaBandsは、市場のイベントについてユーザーに通知するために、すべてのタイプのアラートを使用します。 特徴 ほとんどのチャンネルアルゴリズムをサポート 強力なトレンド検出アルゴリズム 異なるタイプのチャンネルを統合する能力 マルチタイムフレームおよびマルチカレンシー(シグナルマトリックス) すべてのタイプのアラート機能(サウンド、画面フラッシャー、プッシュ通知、メール、ポップアップ、矢印) 再描画しない トレンド検出 MetaBandsは、チャネル内を振動する青いラインを使用してトレンドを検出します。ラインがチャネルの上部バンドに達すると、下降トレンドの開始を示し、下部バンドに達すると上昇トレンドの開始を示します。青いラインが中心ラインに近づくと、市場はコンソ
Dynamic Forex28 Navigator - 次世代の Forex 取引ツール。 現在 49% オフ。 Dynamic Forex28 Navigator は、長年人気のインジケーターを進化させたもので、3 つの機能を 1 つにまとめています。 Advanced Currency Strength28 インジケーター (レビュー 695 件)  + Advanced Currency IMPULSE with ALERT (レビュー 520 件) + CS28 コンボ シグナル (ボーナス)。 インジケーターの詳細 https://www.mql5.com/en/blogs/post/758844 次世代の Strength インジケーターが提供するもの  オリジナルで気に入っていたすべての機能が、新機能と精度の向上によって強化されました。 主な機能: 独自の通貨強度計算式。 すべての時間枠でスムーズかつ正確な強度ライン。 トレンドの特定と正確なエントリーに最適です。 ダイナミックマーケットフィボナッチレベル (マーケットフィボナッチ)。 このインジケー
An exclusive indicator that utilizes an innovative algorithm to swiftly and accurately determine the market trend. The indicator automatically calculates opening, closing, and profit levels, providing detailed trading statistics. With these features, you can choose the most appropriate trading instrument for the current market conditions. Additionally, you can easily integrate your own arrow indicators into Scalper Inside Pro to quickly evaluate their statistics and profitability. Scalper Inside
Enigmera
Ivan Stefanov
5 (3)
エニグメラ:市場の中核 https://www.enigmera.com はじめに このインディケータと取引システムは、金融市場に対する驚くべきアプローチです。ENIGMERAは、フラクタルサイクルを使用して、サポートとレジスタンスレベルを正確に計算します。本格的な蓄積局面を示し、方向性と目標を示します。 トレンド中でも調整中でも機能するシステムです。 どのように作動するのか? ENIGMERAは、支持線・抵抗線、目標線、乖離線の3つのラインで構成されています。このシステムは、過去のデータを現在と未来に外挿する典型的な市場指標とは異なり、現在の完全な画像を提供します。支持線上にある場合、それは本当の支持を意味し、抵抗線上にある場合、それは本当の抵抗を意味する。ある水準が破られた場合、それはトレンドの変化を意味する。再描画はしない。 市場は常に進化しているため、ENIGMERAはその評価ツールを適応させ、定期的に戦略を修正しています。  これにより、すべてのシナリオが徹底的に評価されることが保証されます。この市場指標の独自性は、その能力を見れば明らかです。  ENIGM
TrendMaestro
Stefano Frisetti
5 (3)
note: this indicator is for METATRADER4, if you want the version for METATRADER5 this is the link:  https://www.mql5.com/it/market/product/108106 TRENDMAESTRO ver 2.4 TRENDMAESTRO recognizes a new TREND in the bud, he never makes mistakes. The certainty of identifying a new TREND is priceless. DESCRIPTION TRENDMAESTRO identifies a new TREND in the bud, this indicator examines the volatility, volumes and momentum to identify the moment in which there is an explosion of one or more of these data a
mql5と Telegramの モーニング・ブリーフィングで、詳細とスクリーンショットを含む毎日のマーケット・アップデートをご覧 ください! FX Power MT4 NGは 、長年の人気を誇る通貨強度計FX Powerの次世代モデルです。 この次世代ストレングスメーターは何を提供するのでしょうか?初代FXパワーの魅力すべて プラス GOLD/XAUの強さ分析 より正確な計算結果 個別に設定可能な分析期間 カスタマイズ可能な計算上限値により、さらに優れたパフォーマンスを実現 もっと見たい人のための特別なマルチインスタンス設定 すべてのチャートでお好みの色を無限に設定可能 数え切れないほどの通知オプションにより、重要なことを見逃すことはありません。 Windows 11とmacOSのスタイルで角を丸くした新しいデザイン 魔法のように動くインジケーターパネル FXパワーの主な機能 すべての主要通貨の強さの完全な履歴 すべての時間枠における通貨の強さの履歴 すべてのブローカーとチャートで同一の計算結果 100%信頼できるリアルタイム計算 -> リペイントなし ドロップダウン・リストから
現在20%OFF! 初心者やエキスパートトレーダーのためのベストソリューション! このダッシュボードソフトウェアは、28の通貨ペアで動作しています。それは私達の主要な指標(高度な通貨の強さ28と高度な通貨インパルス)の2に基づいています。それは全体の外国為替市場の大きい概観を与えます。それは、すべての(9)時間枠で28の外国為替ペアのための高度な通貨の強さの値、通貨の動きの速度と信号を示しています。チャート上で1つのインディケータを使用して市場全体を観察し、トレンドやスキャルピングの機会をピンポイントで見つけることができたら、あなたのトレードがどのように改善されるか想像してみてください。 このインディケータには、強い通貨と弱い通貨の識別、潜在的な取引の識別と確認がより簡単になるような機能が搭載されています。このインディケータは、通貨の強さや弱さが増加しているか減少しているか、また、すべての時間枠でどのように機能しているかをグラフィカルに表示します。 新機能として、現在の市場環境の変化に適応するダイナミックなマーケットフィボナッチレベルが追加され、すでに当社のAdvan
FX Volume
Daniel Stein
4.58 (33)
mql5と Telegramの モーニング・ブリーフィングで、詳細とスクリーンショットを含む毎日のマーケット・アップデートをご覧 ください! FX Volumeは、ブローカーの視点から市場のセンチメントをリアルに洞察する、最初で唯一の出来高インジケーターです。 ブローカーのような機関投資家が外国為替市場でどのようなポジションをとっているか、COTレポートよりもはるかに速く、素晴らしい洞察を提供します。 この情報をチャート上で直接見ることは、あなたの取引にとって真のゲームチェンジャーであり、画期的なソリューションです。 以下のようなユニークなマーケットデータ洞察から利益を得てください。 比率は 、通貨のロングポジションとショートポジションの比率をパーセントで表示します。 比率の変化は 、選択した期間内のロング比率とその変化率を表示します。 Volumes Totalは 、通貨の取引量(ロングとショート)の合計をロット単位で表示します。 Volumes Long :全通貨のロングポジションの取引量を表示します。 Volumes(ショート )は、全通貨のショートポジションの取引量を表示
Bomb Bank Signal
Igor Pereira Calil
5 (1)
Bomb Bank シグナル: MetaTrader 4 の信頼度インジケーター Bomb Bank Signal は、金融市場で最も関連性の高いトレンドを特定するように設計された MetaTrader 4 の強力なインジケーターです。動きを正確に予測するツールをお探しなら、Bomb Bank が最適です。 仕組み: このインジケーターは、出来高分析、ローソク足終値、対称トレンドという 3 つの異なる方法を組み合わせて、売買の機会を検出してシグナルを送ります。 Bomb Bank は、買いの機会を特定するときは「爆弾」のようなものであり、売りシグナルを検出するときは「ドクロ」のようなものです。 ボムバンクはなぜ違うのですか? 完全な信頼性: Bomb Bank Signal は信号を削除しません。一度シグナルが発せられると、シグナルは残り続けるので、チャンスを逃すことはありません。 極めて高い精度: Bomb Bank は誤った信号を送信しません。リアルタイムで最新情報を更新し、市場の進化に合わせて調整しながら、以前のシグナルの透明性を維持します。 ライブアップデ
TakePropips Donchian Trend Pro
Eric John Pajarillaga Aldana
4.44 (16)
TakePropips Donchian Trend Pro   (MT4) は、ドンチャン チャネルを使用してトレンドの方向を自動的に検出し、エントリーとエグジットの取引シグナルを提供する強力で効果的なツールです! この多機能インジケーターには、トレンド スキャナー、取引シグナル、統計パネル、スクリーナー、取引セッション、およびアラート履歴ダッシュボードが含まれます。取引シグナルを提供し、チャートを分析する時間を節約するように設計されています! ユーザー マニュアルとインストール ガイドは、ブログ投稿 (   https://www.mql5.com/en/blogs/post/751368   ) からダウンロードできます。 今日は 50% オフ! 98ドルから49ドルに値下げ! このインジケーターは、ストラテジー テスターでテストできます (ビジュアル モードを有効にします)。 詳細については、説明の下にあるビデオ チュートリアルも利用できます。 ご不明な点やサポートが必要な場合は、私に連絡してください。 TakePropips Donchian Trend Pro イン
現在20%OFF! このダッシュボードは、複数のシンボルと最大9つのタイムフレームで動作するソフトウェアの非常に強力な部分です。 このソフトは、弊社のメインインジケーター(ベストレビュー:Advanced Supply Demand)をベースにしています。    Advanced Supply Demand ダッシュボードは、素晴らしい概要を提供します。それは示しています。  ゾーン強度評価を含むフィルタリングされた需給値。 ゾーン内/ゾーンへのPips距離。 ネストされたゾーンがハイライトされます。 選択されたシンボルの4種類のアラートを全ての(9)時間枠で提供します。 それはあなたの個人的なニーズに合わせて高度に設定可能です。 あなたの利益! すべてのトレーダーにとって最も重要な質問です。 市場に参入するのに最適なレベルはどこか? 成功のチャンスとリスク/リターンを得るために、強力な供給/需要ゾーン内またはその近くで取引を開始します。 損切りの最適な位置はどこですか? 最も安全なのは、強力な供給/需要ゾーンの下/上にストップを置くことで
現在26%オフ 初心者やエキスパートトレーダーに最適なソリューション! このインジケーターは、独自の機能と新しい計算式を取り入れた、ユニークで高品質、かつ手頃な価格のトレーディングツールです。たった1枚のチャートで28の為替ペアの通貨強度を読み取ることができます。新しいトレンドやスキャルピングチャンスの引き金となるポイントを正確に特定することができるので、あなたのトレードがどのように改善されるか想像してみてください。 ユーザーマニュアルはこちら  https://www.mql5.com/en/blogs/post/697384 これが最初の1本、オリジナルだ! 価値のないクローンを買わないでください。 特別な サブウィンドウの矢印で強い通貨の勢いを表示 GAPがあなたのトレードを導く! 基準通貨や気配値が売られすぎ・買われすぎのゾーン(外相フィボナッチレベル)にあるとき、個別チャートのメインウィンドウに警告表示。 通貨がレンジの外側から反落した場合、プルバック/リバーサルのアラート。 クロスパターンの特別なアラート 複数の時間枠を選択可能で、トレンドを素早く
まず第一に、この取引ツールはノンリペイント、ノンリドロー、ノンラグの指標であり、プロの取引に理想的ですことを強調する価値があります。 オンラインコース、ユーザーマニュアル、デモ。 スマートプライスアクションコンセプトインジケーターは、新米から経験豊富なトレーダーまで、非常 に強力なツールです。Inner Circle Trader AnalysisやSmart Money Concepts Trading Strategiesなど、20以上の有用な指標を1つに組み合わせています。このインジケーターはスマートマネーコンセプトに焦点を当て、大手機関の取引方法を提供し、彼らの動きを予測するのに役立ちます。 特に、流動性分析に優れており、機関がどのように取引しているかを理解しやすくしています。市場のトレンドを予測し、価格の動きを慎重に分析するのに優れています。機関の戦略とトレードを合わせることで、市場の動向についてより正確な予測ができます。このインジケーターは多目的であり、市場構造を分析し、重要な注文ブロックを特定し、さまざまなパターンを認識するのに優れています。 このインジケー
通貨強さウィザードは、取引を成功させるためのオールインワン ソリューションを提供する非常に強力な指標です。このインジケーターは、複数の時間枠のすべての通貨のデータを使用して、このまたはその外国為替ペアのパワーを計算します。このデータは、使いやすい通貨インデックスと通貨パワーラインの形式で表され、特定の通貨のパワーを確認するために使用できます。 必要なのは、取引したいチャートにインジケーターを接続することだけです。インジケーターは、取引する通貨の実際の強さを示します。このインジケーターは、トレンドに合わせて取引するときに有利に利用できる売買高の圧力の極値も示します。このインジケーターには、フィボナッチに基づく可能なターゲットも表示されます。 このインジケーターは、PUSH 通知を含むあらゆるタイプのアラートを提供します。 購入後ご連絡下さい。私の取引のヒントをあなたと共有し、素晴らしいボーナスインジケーターを無料で提供します! 幸せで有益な取引をお祈りします。
現在31%オフ! 初心者やエキスパートトレーダーに最適なソリューション! このインジケータは、独自の機能と秘密の数式を組み込んだ、ユニークで高品質かつ手頃な価格のトレーディングツールです。たった1枚のチャートで28の通貨ペアのアラートを表示します。新しいトレンドやスキャルピングチャンスの引き金となるポイントを正確に把握することができるので、あなたのトレードがどのように改善されるか想像してみてください! 新しい基本的なアルゴリズムに基づいて構築されているため、潜在的な取引の特定と確認がより簡単になります。これは、通貨の強さや弱さが加速しているかどうかをグラフィカルに表示し、その加速のスピードを測定するためです。加速すると物事は明らかに速く進みますが、これはFX市場でも同じです。つまり、反対方向に加速している通貨をペアにすれば、利益を生む可能性のある取引を特定することができるのです。 通貨の勢いを示す縦の線と矢印は、あなたの取引の指針となるでしょう。 ダイナミックマーケットフィボナッチ23レベルはアラートトリガーとして使用され、市場の動きに適応します。もしインパルスが黄色
トレンドカッターは、M1 や M5 などの下位時間枠を含むあらゆる時間枠で使用できるトレンド指標です。このインジケーターは日中取引を好むトレーダーにとって理想的であり、長期取引を好むトレーダーにも役立ちます。このインジケーターは、取引システムの基礎として、またはスタンドアロンの取引ソリューションとして使用できます。 このインジケーターは、PUSH 通知を含むあらゆるタイプのアラートを提供します。 インジケーターの使い方はとても簡単です。信号に従えばいいだけです。また、このインジケーターのすべてのユーザーに、このメソッドをできるだけ効率的に使用するのに役立つ追加のインジケーターも無料で提供します。 取引のヒントと素晴らしいボーナスを入手するには、購入後にご連絡ください。
Please contact me after purchase to immediately get your PDF strategy + documentation for Trend Pulse !  Introducing Trend Pulse , a unique and robust indicator capable of detecting bullish, bearish, and even ranging trends! Trend Pulse uses a special algorithm to filter out market noise with real precision. If the current symbol is moving sideways, Trend Pulse will send you a ranging signal, letting you know that it's not a good time to enter a trade. This excellent system makes Trend Pulse
PZ Day Trading
PZ TRADING SLU
3.67 (3)
このインディケータは、価格アクション分析とドンチャンチャネルのみを使用して、ジグザグ方式で価格の反転を検出します。再描画やバックペインティングを一切行わずに、短期取引向けに特別に設計されています。それは彼らの操作のタイミングを増やすことを目指している賢明なトレーダーにとって素晴らしいツールです。 [ インストールガイド | 更新ガイド | トラブルシューティング | よくある質問 | すべての製品 ] 驚くほど簡単に取引できます すべての時間枠で価値を提供します 自己分析統計を実装します 電子メール/音声/視覚アラートを実装します 可変長のブレイクアウトと混雑ゾーンに基づいて、インディケータは価格アクションのみを使用して取引を選択し、市場が非常に高速に行っていることに反応します。 過去のシグナルの潜在的な利益が表示されます この指標は、独自の品質とパフォーマンスを分析します 負けブレイクアウトは強調表示され、説明されます インジケータは、非バックペインティングおよび非再ペイントです この指標は、日中のトレーダーが単一の価格反転を見逃さないようにするのに役立ちます。ただし、す
Advanced Supply Demand
Bernhard Schweigert
4.91 (294)
現在33%オフ 初心者にもエキスパートトレーダーにも最適なソリューション このインジケーターは独自の機能と新しい公式を多数内蔵しており、ユニークで高品質かつ手頃な取引ツールです。このアップデートでは、2つの時間枠ゾーンを表示できるようになります。より長いTFだけでなく、チャートTFとより長いTF(ネストゾーンを表示)の両方を表示できます。すべてのSupply Demandトレーダーの皆さんのお気に召すはずです。:) 重要情報の公開 Advanced Supply Demandの可能性を最大化するには、 https://www.mql5.com/ja/blogs/post/720245 にアクセスしてください。   エントリーまたはターゲットの正確なトリガーポイントを正確に特定できれば取引がどのように改善されるか想像してみてください。新しい基盤となるアルゴリズムに基づいて構築されているため、買い手と売り手の間の潜在的な不均衡をさらに簡単に特定できます。これは、最も強い需要と供給のゾーンと、過去のパフォーマンス(古いゾーンを表示)がグラフィカルに表現されるためです。これらの機能は、最適
Scalper Vault は、スキャルピングを成功させるために必要なすべてを提供するプロフェッショナルなスキャルピング システムです。このインジケーターは、外国為替およびバイナリー オプションのトレーダーが使用できる完全な取引システムです。推奨される時間枠は M5 です。 システムは、トレンドの方向に正確な矢印シグナルを提供します。また、トップとボトムのシグナルとギャン マーケット レベルも提供します。 インジケーターは、プッシュ通知を含むすべてのタイプのアラートを提供します。 インジケータの購入後にご連絡ください。私の個人的な取引の推奨事項と素晴らしいボーナス指標を無料で共有します! 幸せで有益な取引をお祈りします!
Gold Channel is a volatility-based indicator, developed with a specific timing algorithm for the XAUUSD pair, which consists of finding possible corrections in the market. This indicator shows two outer lines, an inner line (retracement line) and an arrow sign, where the theory of the channel is to help identify overbought and oversold conditions in the market. The market price will generally fall between the boundaries of the channel. If prices touch or move outside the channel it is a tra
現在20%OFF! 初心者やエキスパートトレーダーに最適なソリューションです。 このインディケータは、エキゾチックペア・コモディティ・インデックス・先物など、あらゆるシンボルの通貨の強さを表示することに特化したインディケータです。金、銀、原油、DAX、US30、MXN、TRY、CNHなどの通貨の強さを表示するために、9行目にどのシンボルでも追加することができます。独自の機能を多数搭載し、新しい計算式を採用したため、ユニークで高品質、かつ手頃な価格のトレーディングツールとなっています。新しいトレンドやスキャルピングチャンスのトリガーポイントを正確に把握することができるため、あなたのトレードがどのように改善されるか想像してみてください。 ユーザーマニュアル:ここをクリック   https://www.mql5.com/en/blogs/post/708876 すべての時間枠に対応します。あなたはすぐにトレンドを見ることができるようになります! 新しいアルゴリズムに基づいて設計されているため、潜在的な取引の特定と確認がより簡単になります。これは、8つの主要通貨と1つのシンボ
Order Block Hunter
Noha Mohamed Fathy Younes Badr
5 (6)
Order block hunter indicator is the best indicator for  hunt the order blocks that area where there has been a large concentration of limit orders waiting to be executed Order blocks are identified on a chart by observing previous price action and looking for areas where the price experienced significant movement or sudden changes in direction .This indicator does that for you by using very complicated codes and helps you to take the best areas To buy and sell because it make marks at the best a
Currency pairs never go up or down in a straight line. They rise and fall constantly, creating pullbacks and reversals. And with each rise and fall, so your emotions rise and fall. Hope, then fear, then hope. This is when the market will try to frighten you out of a strong position. It is when you are most vulnerable. But not if you have the Quantum Trend Monitor. And here, you even get two indicators for the price of one! The Quantum Trend Monitor has been designed to absorb these temporary pau
The Quantum VPOC indicator has been developed to expand the two dimensional study of volume and price, to a three dimensional one which embraces time. The volume/price/time relationship then provides real insight to the inner workings of the market and the heartbeat of sentiment and risk which drives the price action accordingly. The Quantum VPOC indicator displays several key pieces of information on the chart as follows: Volume Profile - this appears as a histogram of volume on the vertical pr
作者のその他のプロダクト
Range Volume Profile The indicator Range Volume Profile shows the distribution of transactions on the price scale in a given time range. This tool simplifies the analysis of the market situation and helps to find the price levels where a large player is sitting.   Features: shows the distribution of tick volumes relative to the price. shows the distribution of real volumes relative to the price. If your broker provides them. you can select the part of the chart that you want to explore. for cert
The Visual Risk Calculator is the indicator that allows calculating the risks, before placing an order. Features: - Calculation of potential profits and losses in points, interest and in the base currency, including the brokerage commission. - calculation of the ratio of profit to potential loss. - informing about the calculated levels of stop-loss and take-profit. - the ability to drag the levels of entry into the market, stop-loss, and take-profit on the graph for preview before pl
Visual Trade History Visualizer of trading history. The graph displays the levels of SL, TP, points of entry and exit from the market. Features : It is possible to display only orders with a profit greater than a given number. There is the ability to display only executed orders or not executed, or all. For convenience, the analysis for each type of order, you can configure your own color.
Trading zones
Oleksandr Martsynyshen
The indicator determines the best moments for entering the market. It is written on the basis of well-known indicators such as Alligator and CC I. For fine-tuning, it contains all the parameters of parents. The indicator works on all timeframes. The basic setting of the indicator is performed by changing the values of two parameters "Precision" and "CCI Period". All other parameters can be left unchanged.
フィルタ:
レビューなし
レビューに返信