MagicLines MT5

  • インディケータ
  • Mostafa Ghanbari
    Mostafa Ghanbari
    ✅ MGH Products 創設者
    ✅ ソフトウェアエンジニア|カスタムインジケーター・エキスパートアドバイザー(EA)開発者
    ✅ MQL5.com 掲載著者
    こんにちは!Mostafa と申します。複雑な取引戦略を高性能で信頼性の高いツールへと変えることに情熱を注ぐ、ソフトウェアエンジニアです。ソフトウェア工学の確かな学術的背景と、長年にわたるプロフェッショナルなプログラミング経験を活かし、厳密なソフトウェアアーキテクチャとダイナミックなアルゴリズム取引の世界の橋渡しをしています。
    🛠 技術的な専門分野:
  • バージョン: 1.1
  • アップデート済み: 13 7月 2026
  • アクティベーション: 5

MGH-MagicLine — Trend & Multi-Timeframe Divergence in One Tool

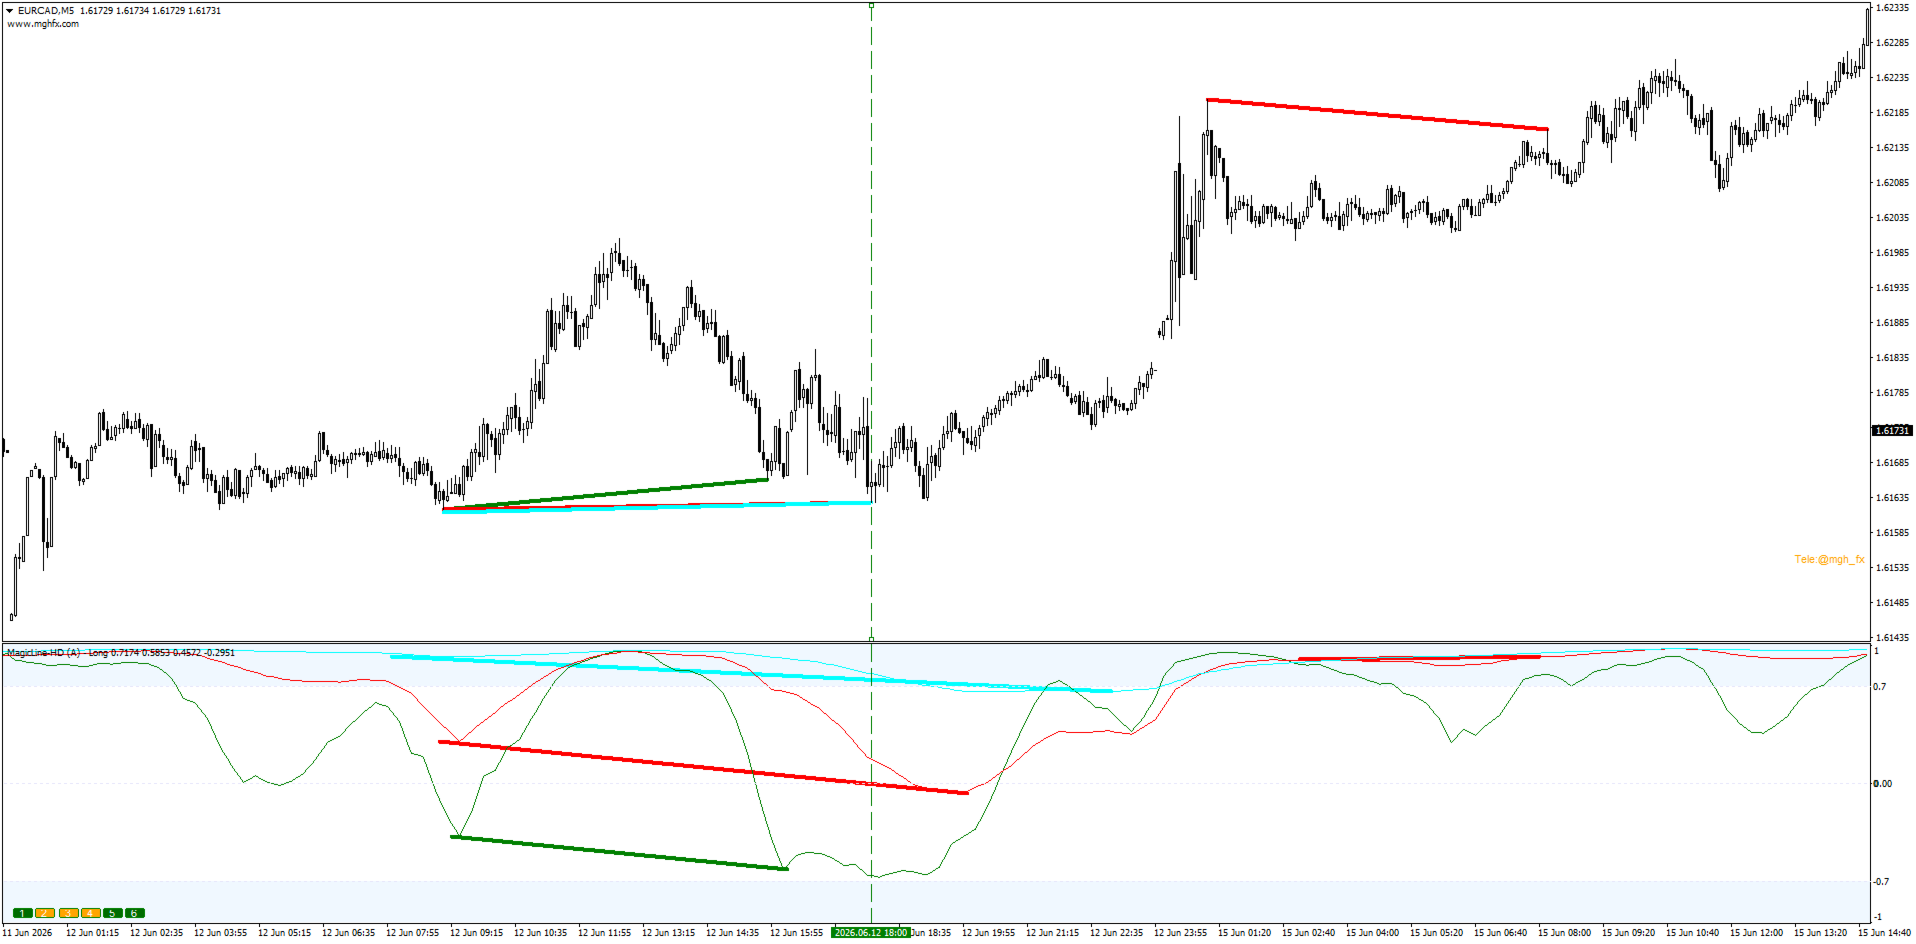
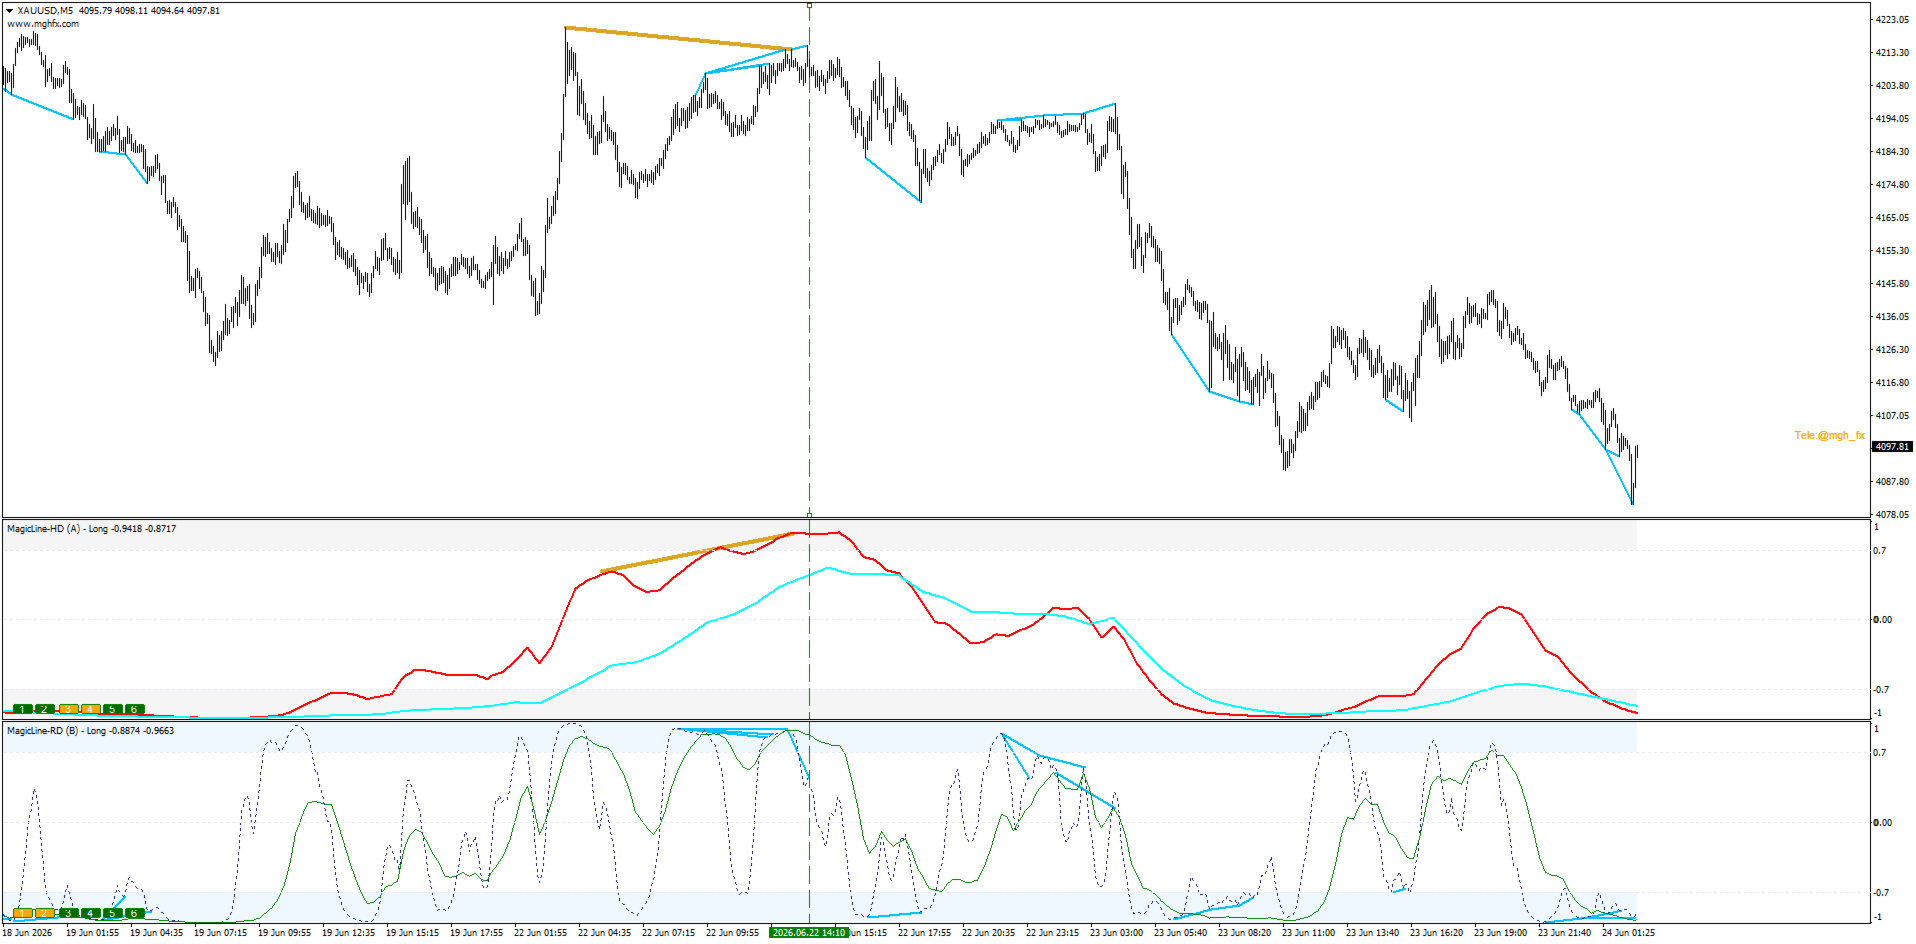
MagicLine combines trend detection and divergence analysis into a single indicator — a refined alternative to running MultiStoch and MultiMACD separately, with cleaner output and less lag.

It is a confirmation and analysis tool. It does not give entry points, Take Profit or Stop Loss. Instead, it adds a strong, flexible confirmation layer that fits almost any trend-based strategy and helps you read the market with more clarity.

Three Line Modes — One Indicator

Choose the Line Type in settings; the active mode is shown directly in the indicator window name, so you always know what you are looking at:

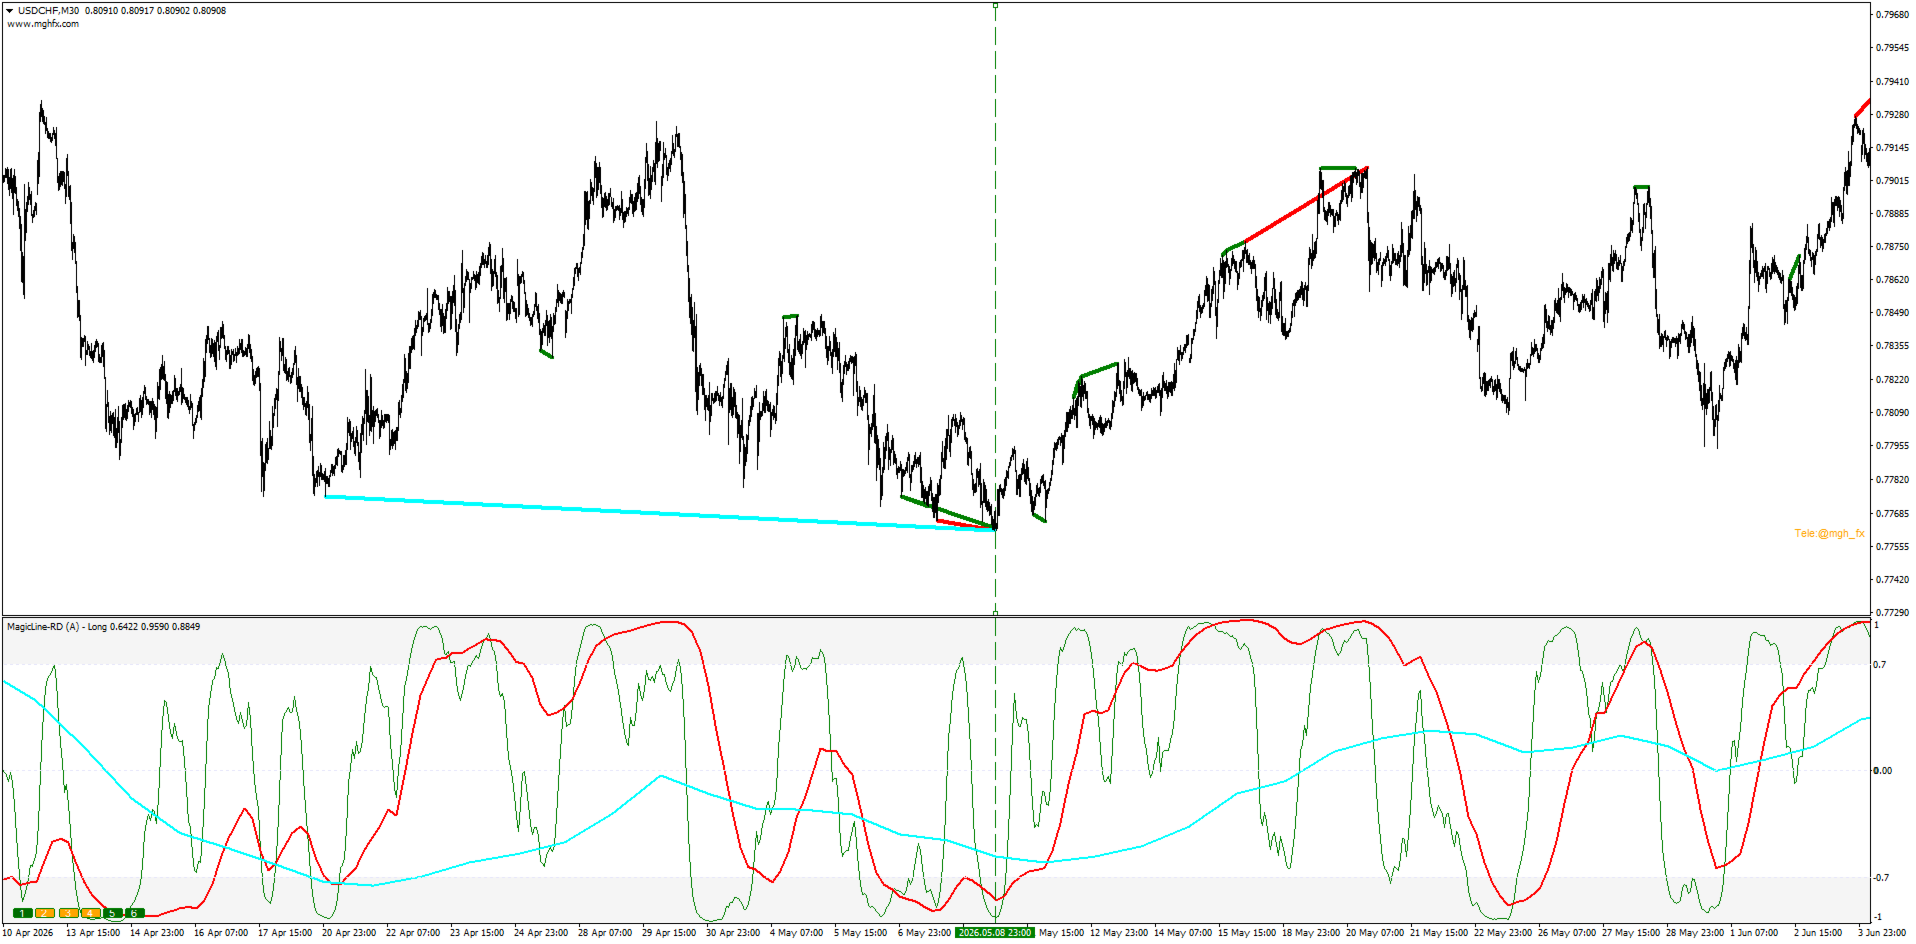
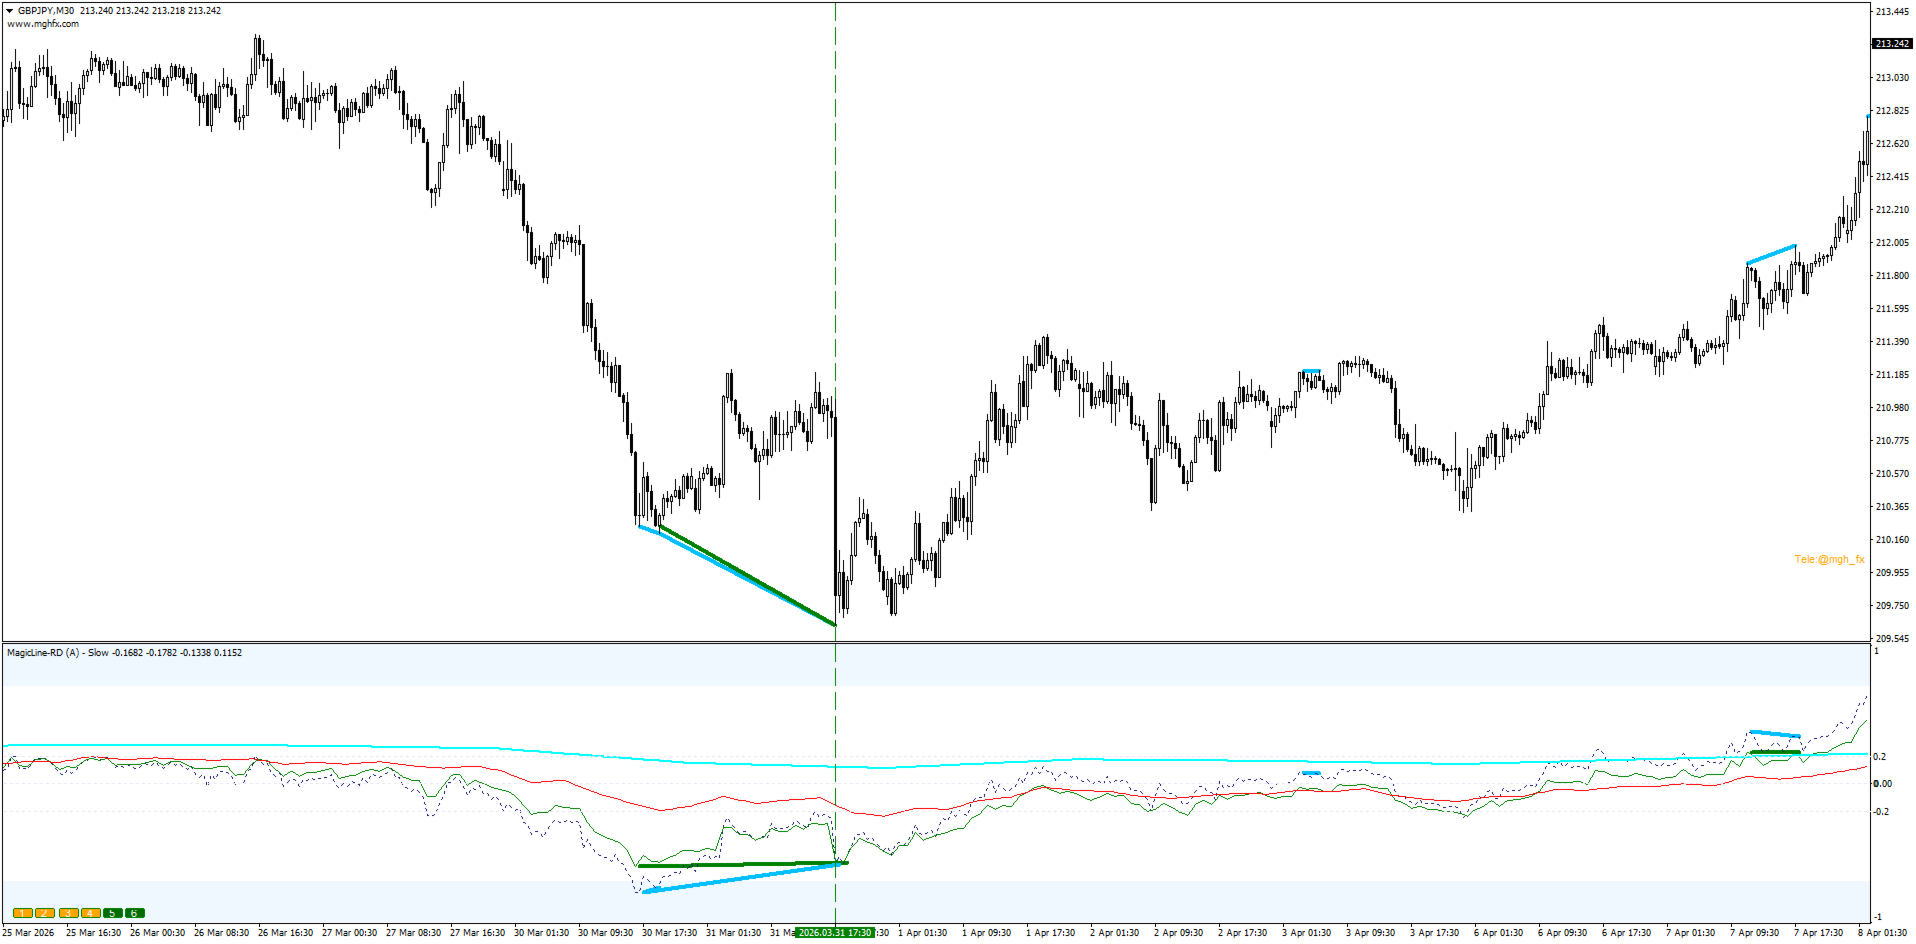
  • Slow — lowest noise, built to read the long-term trend direction. Lines reaching the ±0.2 zone confirm the dominant trend.
  • Long — clean trend detection with more responsiveness. A balanced, everyday choice.
  • Fast — quickest reaction, suited to scalping and intraday momentum.

One indicator, three distinct behaviors — adapt it to your timeframe and your style.

Multi-Timeframe Lines — Now With Full Timeframe Control (MT5)

Because MetaTrader 5 supports a wider range of timeframes than MT4, this version adds per-line timeframe selection — giving you complete control over which timeframe each line represents.

Set TimeFrame Type to choose how timeframes are assigned:

  • Auto — the indicator applies a smart neighboring-timeframe rule: each successive line is assigned a timeframe at least 3× larger than the previous one, adapting automatically to whatever chart period you are on. No manual configuration needed.
  • From Inputs — set each line's timeframe independently (L1 through L6) from a full list of MetaTrader 5 periods, from M1 all the way to Monthly.

The result: up to 6 lines, each on its own timeframe, covering exactly the multi-timeframe spread that matches your strategy — automatically or manually, your choice.

  • Hover any line to confirm its timeframe instantly.
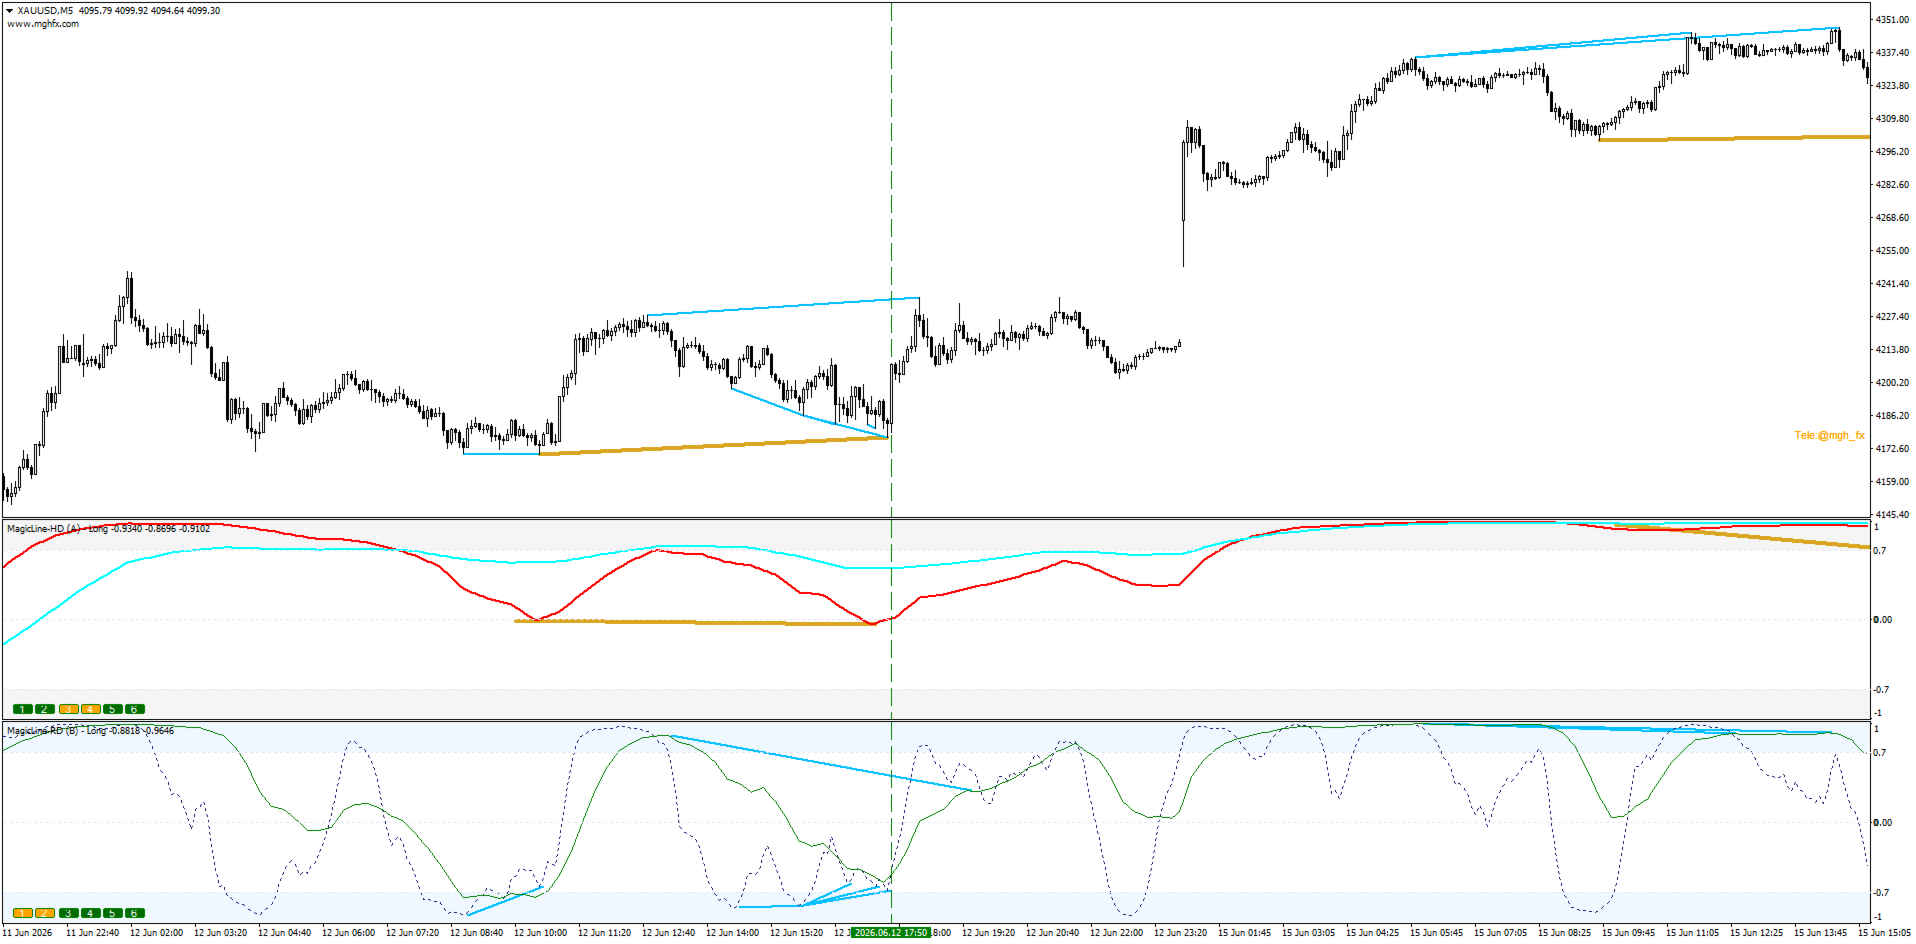
  • Toggle each line ON/OFF with the on-chart buttons (1–6).

See the higher-timeframe picture and your entry timeframe together, in one window.

Regular & Hidden Divergence

Set Divergence Type to Regular or Hidden; the mode (RD / HD) is added to the indicator name so multiple instances stay easy to identify on the same chart.

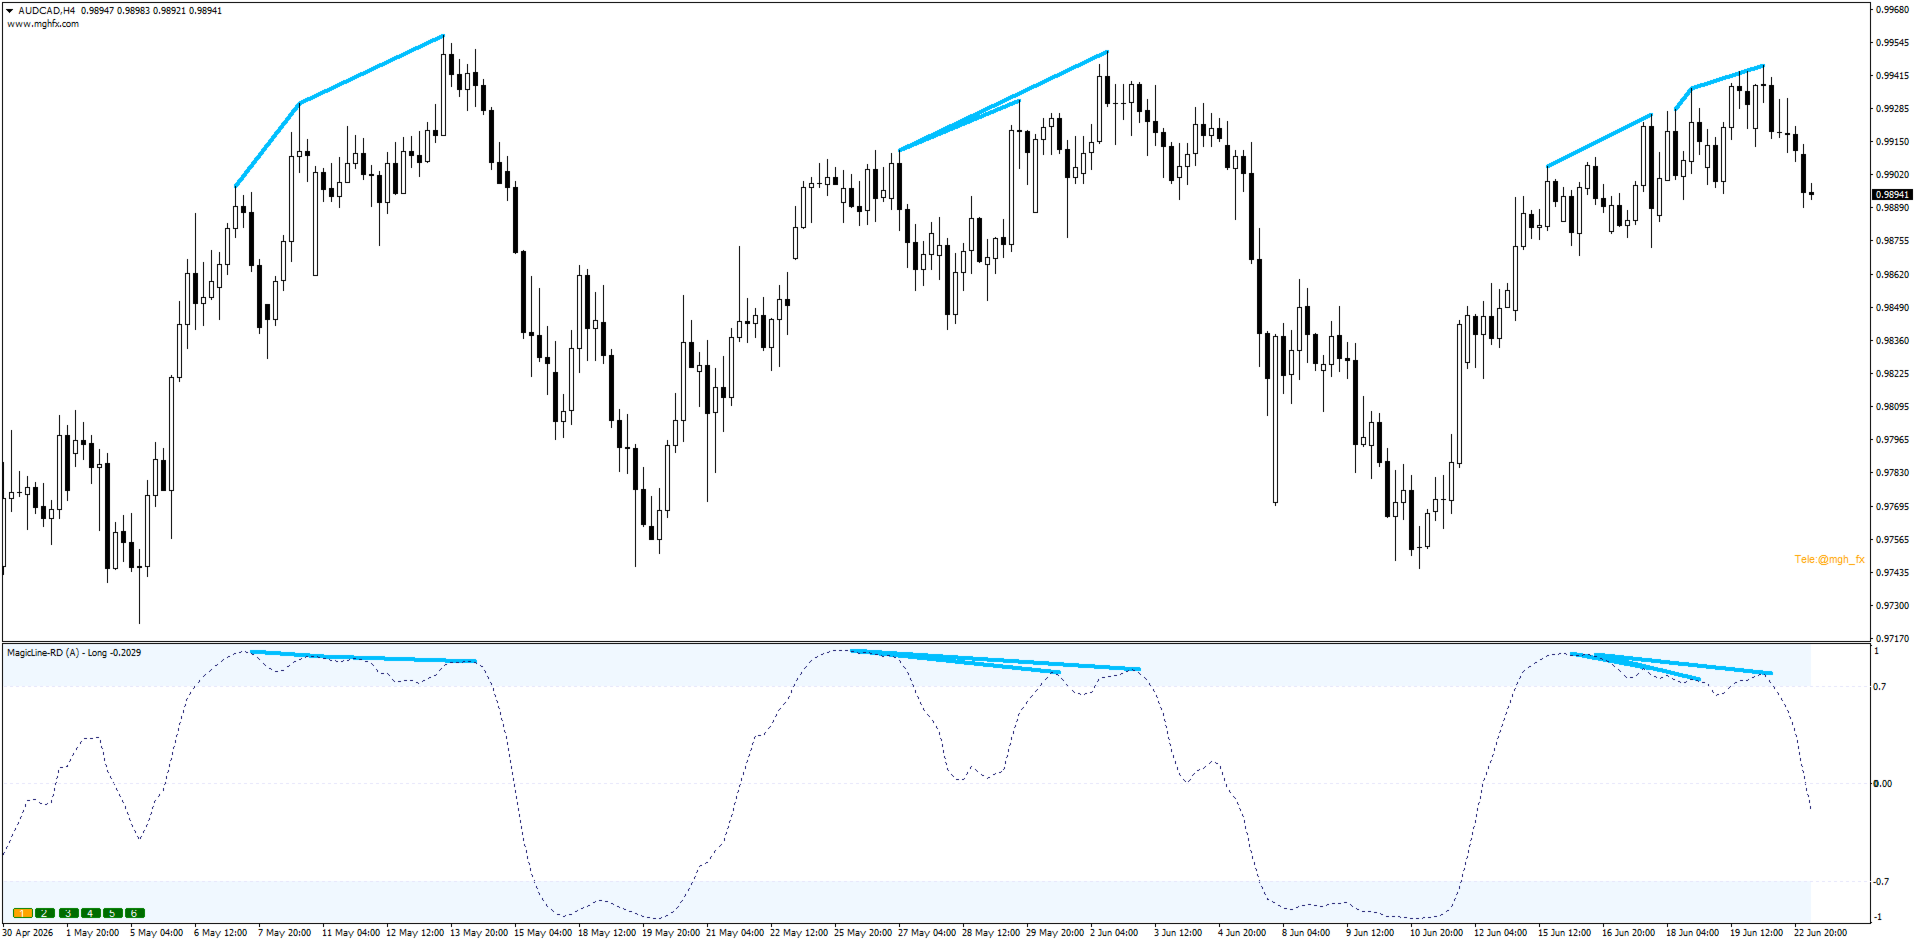
  • Regular (RD) — highlights potential reversals.
  • Hidden (HD) — highlights trend continuation.

Each divergence is drawn both in the indicator window and directly on the price chart, color-coded per timeframe — no need to match peaks and troughs by eye. The Increase Divergence Range input extends detection to farther peaks and valleys for setups that are easy to miss otherwise.

Two Practical Approaches

1. Divergence stacking — multiple RD (or multiple HD) signals from different timeframes converging on the same candle, for a higher-conviction setup. The more lines that align, the stronger the picture.

2. RD + HD confluence — Hidden divergence from a higher timeframe (Daily/Weekly) for direction, combined with Regular divergence from a lower timeframe (H1/H4) for timing.

Built-In Alerts

Three independent alerts — Overbought/Oversold break, Center line break, and Divergence — delivered via popup, sound, email, or push notification, so you never have to watch the screen all day.

Input Parameters

Lines

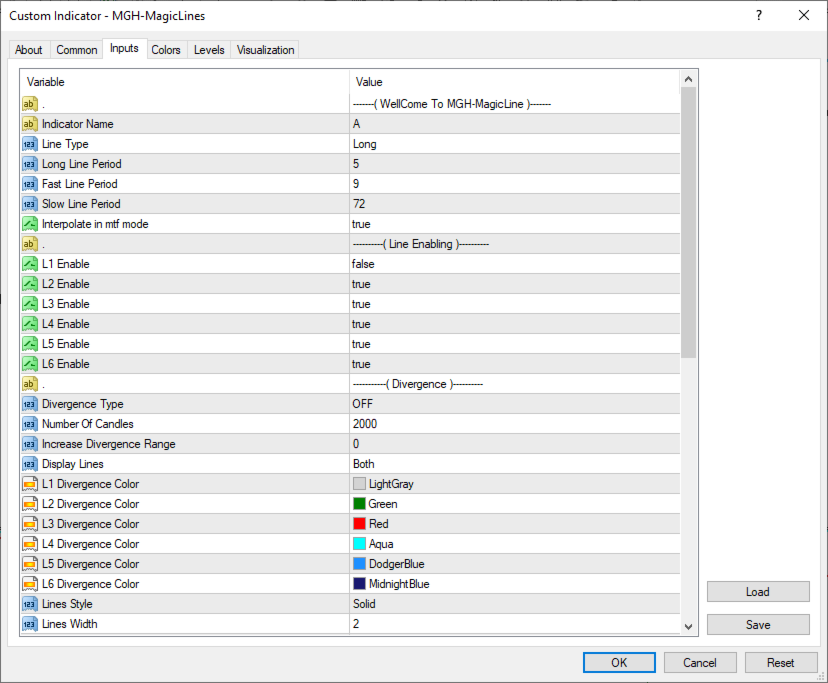
  • Indicator Name — custom label for the indicator window.
  • Line Type — Long / Fast / Slow engine selection.
  • Long / Fast / Slow Line Period — independent period for each engine.
  • Interpolate in MTF mode — smooths lines in multi-timeframe mode.
  • L1–L6 Enable — turn each of the 6 timeframe lines on or off (color shown in brackets).

Line TimeFrame (MT5 exclusive)

  • TimeFrame Type — Auto or From Inputs.
    • Auto: the indicator automatically selects neighboring timeframes following the rule that each successive timeframe is at least 3× larger than the previous one, based on your current chart period.
    • From Inputs: assign each line's timeframe manually from the full MT5 period list.
  • L1–L6 TimeFrame — active only when TimeFrame Type is set to From Inputs.

Divergence

  • Divergence Type — Regular / Hidden / OFF.
  • Number Of Candles — history depth scanned for divergence.
  • Increase Divergence Range — widens detection to farther peaks/troughs.
  • Display Lines — show divergence in the window, on the chart, or both.
  • L1–L6 Divergence Color — color per timeframe.
  • Lines Style / Lines Width — divergence line appearance.

Alerts

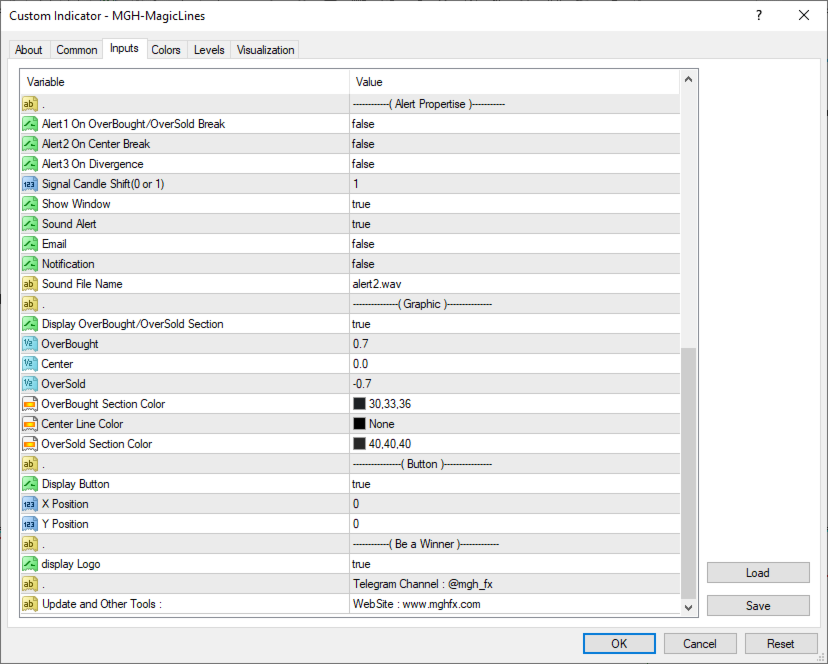
  • Alert on Overbought/Oversold Break, Center Break, Divergence — enable each independently.
  • Signal Candle Shift (0 or 1) — signal on the closed or current candle.
  • Sound / Email / Notification — choose delivery method.
  • Sound File Name — custom alert sound.

Graphic

  • Overbought / Center / Oversold — adjustable zone levels.
  • Section & Center Line Colors — visual customization.
  • Show Window, Display Button, X/Y Position — layout controls.

Important

MagicLine is a confirmation tool, not an automated strategy. It works best when combined with your own analysis and risk management. Past behavior of any indicator does not guarantee future results.

Download the demo and test MagicLine on your own charts and strategy — see how it fits before you decide.

MT4 Version: https://www.mql5.com/en/market/product/182884


If you're looking for a more automated, multi-timeframe approach built on this same divergence-detection logic, check out MGH-MagicTrigger. It scans a chain of timeframes automatically, confirms higher-timeframe divergence with matching divergence on the lower timeframes, and draws an entry trigger, stop loss, and two targets for every confirmed signal.

MagicTrigger link:

MT5: https://www.mql5.com/en/market/product/186243

MT4: https://www.mql5.com/en/market/product/186226

おすすめのプロダクト
Crypto_Forex MT5用インジケーター「 WPR with 2 Moving Averages 」(リペイント機能なし) - WPR自体はスキャルピングに最適なオシレーターの1つです。 - 「WPR and 2 Moving Averages」インジケーターを使用すると、WPRオシレーターの高速移動平均線と低速移動平均線を確認できます。 - このインジケーターを使用すると、価格調整を早期に把握できます。 - このインジケーターはパラメータで簡単に設定でき、どの時間枠でも使用できます。 - 買いと売りのエントリー条件は画像で確認できます。 - WPR MA クロスの PC およびモバイル アラート付き。 買いシグナルの条件例: (1) - 高速MAが低速MAを下向きにクロスし、WPR値が-50を下回っている場合:買いトレードを開きます。 (2) - WPR値が-20を超える買われすぎゾーンに入ったら:買いトレードを終了します。 売りシグナルの条件例: (1) - 高速MAが低速MAを下向きにクロスし、WPR値が-50を超えている場合:売りトレードを開きます。 (2) WP
HiperCube VIX へようこそ Darwinex Zero 25%割引コード: DWZ2328770MGM この指標は、sp500 / us500 の市場のボリュームに関する実際の情報を提供します 定義 CBOE ボラティリティ インデックスとして知られる HiperCube VIX は、市場の恐怖やストレスを測る広く認知された指標です。株式市場の不確実性とボラティリティのレベルを示し、S&P 500 インデックスを広範な市場の代理として使用します。VIX インデックスは、S&P 500 インデックスのオプション契約の価格に基づいて計算されます。 機能: カスタムカラー カスタムチャートカラー メイングラフを明瞭に保つためにサブウィンドウにインジケーターを表示 解釈が簡単 完全にカスタマイズ可能 Chat gptとAIが開発に使用されました 使用例: VIX は実際の市場に関する優れた情報を提供するボリュームインジケーターです。このインジケーターの値が高いということは、ボラティリティが高いことを意味します ボラティリティが高いということは、市場の動きにアプローチし、市場
FREE
この情報インジケーターは、アカウントの現在の状況を常に把握したい人にとって役立ちます。 VERSION MT 4 -   More useful indicators このインジケーターには、ポイント、パーセンテージ、通貨での利益、現在のペアのスプレッド、現在の時間枠でバーが閉じるまでの時間などのデータが表示されます。 チャート上に情報線を配置するには、いくつかのオプションがあります。 価格の右側 (価格の後ろにあります)。 コメントとして (グラフの左上隅に); 画面の選択した隅。 情報区切り記号を選択することもできます。 | / \ # このインジケーターは使いやすく、非常に有益です。設定で不要な情報項目を無効にすることも可能です。 設定 外観の種類     - 情報行の表示タイプ。次の 3 つのオプションがあります。 価格に従ってください     - 価格に従う。 コメントとして     - コメントとして; 画面の選択した隅に     - 画面の選択した隅にあります。 添付用グラフコーナー     - 表示タイプを選択した場合 画面の選択されたコーナーでは、この項目を使用して
FREE
PROMETHEUS TECHNICAN VERSION Free | By THE SONS A gift from The Sons — no strings, no trial, no expiry. Every trader deserves access to professional-grade market intelligence. That belief is why Prometheus Technical Version exists, and why it costs nothing. Consider it our handshake to the trading community. What You're Getting This is not a simplified tool dressed up as a gift. Prometheus Technican Version is a fully built, institutional-quality technical analysis indicator running a dual-model
FREE
This indicator is especially for the binary trading. Time frame is 1 minutes and exp time 5 or 3 minutes only. You must be use martingale 3 step. So you must put lots size is 10 % at most. You should use Mt2 trading platform to connect with my indicator to get more signal without human working. This indicator wining rate is over 80% but you may get 100% of profit by using martingale 3 step. You should use MT2 Trading Platform to connect meta trader platform and binary platform . You can get mt2
FREE
This indicator is a zero-lag indicator and displays  strength of trend change . True Trend  Oscillator Pro works best in combination with True Trend Moving Average Pro that displays exact trend as is. Oscillator value is exact price change in given direction of the trend. True Trend Moving Average Pro: https://www.mql5.com/en/market/product/103586 If you set PERIOD input parameter to 1 this indicator becomes a sharpshooter for binary options. Developers can use True Trend Oscillator in Exper
FREE
Radar Trade Analytic
Jeverson Rodrigues Ferreira
Radar Trade Analytic 2.0 – MT5用クオンツパネル Radar Trade Analyticとは? Radar Trade Analyticは、Radar Tradeエコシステムのクオンツ(定量分析)モジュールです。メインチャートの下に独立したウィンドウで表示され、同一の独自エンジン「Sigma」で構築された4つの同期レイヤーを表示します。チャート上で見えるものとパネルで読み取れるものが直接対応することを保証しています。 売買シグナルはありません。ターゲットもありません。アラートもありません。Radar Trade Analyticは本当に重要なデータだけを整理し、明確な判断ができるようにします。 バージョン2.0での変更点 # 改善点 旧バージョン (1.00) バージョン2.0 1 Delta Flow (CVD) M1足のみを使用して計算(下位時間足での推定値) TICK_FLAG_BUY/SELLフラグ付きティックによる実際のアグレッション・デルタ。プロ向けプラットフォームと同じデータを使用 2 自動フォールバック M1が利用できな
Best SAR MT5
Ashkan Hazegh Nikrou
4.33 (3)
説明 :  外国為替市場(PSAR)で専門的で人気のあるインジケーターの1つに基づいた新しい無料インジケーターをご紹介します。このインジケーターは元のパラボリックSARインジケーターの新しい変更です。プロSARインジケーターでは、ドットと価格チャートのクロスオーバーを見ることができます。クロスオーバーはシグナルではありませんが、動きの終わりの可能性について話します。新しい青いドットで購入を開始し、最初の青いドットの1 atr前にストップロスを配置し、最後にドットが価格チャートを横切るとすぐに終了できます。 売買シグナルを開く方法は? 最初の青い点によるオープンバイトレードと最初の赤いドットによるオープンセルトレード 正しいストップロスはどこにありますか? 安全なストップロスは最初のドットにある可能性があります(最初の青いドットの買いの場合と最初の赤い点の売りの場合) 正しいテイクプロフィットはどこにありますか? テイクプロフィットはストップロス距離とRRに基づいて調整できるので、私の提案は2 RRで、ストップロスの2倍です。 利益を上げているのにtpを達成できなかった場合
FREE
Follow The Line MT5
Oliver Gideon Amofa Appiah
4.6 (35)
This indicator obeys the popular maxim that: "THE TREND IS YOUR FRIEND" It paints a GREEN line for BUY and also paints a RED line for SELL. (you can change the colors). It gives alarms and alerts of all kinds. IT DOES NOT REPAINT and can be used for all currency pairs and timeframes. Yes, as easy and simple as that. Even a newbie can use it to make great and reliable trades. NB: For best results, get my other premium indicators for more powerful and reliable signals. Get them here: https://www.m
FREE
RM Sync Master
Mohammadreza Mahdi Mavaddat
5 (1)
IF YOU FIND THIS TOOL HELPFUL, PLEASE LEAVE A 5-STAR RATING & REVIEW! Your feedback helps us maintain and update this FREE tool for the trading community. ================================================================= RM Sync Master - Ultimate Multi-Chart & Multi-Timeframe Sync Utility ================================================================= RM Sync Master is a powerful chart synchronization utility for MetaTrader designed to link and synchronize multiple charts instantly. Align
FREE
This indicator idea comes from Tushar Chande called Qstick. Technical indicators quantify trend direction and strength in different ways. One way is to use the difference between close and open for each bar and to sum it up over a period of time. The formual is: Qstick (period ) = Average ((close-open ), period ) In this indicator, we can choose how to calculate body by two famous chart types. The first and default indicator settings are based on Heiken Ashi chart, and the second is based
FREE
GDS Renko Entry Helper - Free Renko Price Interaction Indicator for MetaTrader 5 GDS Renko Entry Helper is a free Renko price interaction indicator for MetaTrader 5. It helps traders highlight important areas where price reacts, slows down, returns to a zone or changes behavior around support and resistance. The tool is designed for manual Renko analysis. It does not generate buy or sell signals and does not tell the trader when to enter the market. Its purpose is to help focus attention on area
FREE
GDS Renko Pip ST Chart - Pip-Based Renko Chart Indicator for MetaTrader 5 GDS Renko Pip ST Chart is a pip-based Renko chart indicator for MetaTrader 5. It helps traders build and study cleaner Renko price movement using a practical fixed pip or point-based brick structure. This tool is designed as a Renko chart foundation for manual analysis. It does not predict the market, does not generate buy or sell signals and does not decide whether a trade should be opened. What Pip ST Chart Does Renko ch
FREE
The SMMA Bands indicator is an advanced volatility-based trading tool that creates 6 dynamic support and resistance levels around an envelope formed by two Smoothed Moving Averages (SMMA).  This indicator combines the reliability of SMMA trend identification with the precision of standard deviation-based volatility bands, making it suitable for both trend-following and mean-reversion strategies. Every band has its own buffer for use in EA. feel free to make suggestions and add reviews , i will
FREE
製品概要 KMB Smart Pattern Analyzer PRO は、ユーザーが指定したチャート範囲内で市場パターンを検出し、技術的な一致度に基づいてランキングする高度なテクニカル分析インジケーターです。 複数の分析エンジンを1つのプロフェッショナルなツールに統合しています。 ローソク足パターン分析 クラシックチャートパターン認識 ハーモニック構造検出 市場構造 / SMC分析 チャート全体にランダムなシグナルを表示するのではなく、ユーザーが指定した市場エリアに集中し、最も強いパターン候補、方向性、ブレイクアウトレベル、無効化レベル、予測ターゲットゾーンを構造的に分析します。 主な機能 最も一致度の高い Top 3パターン を検出・ランキング 対応分析: ローソク足パターン クラシックチャートパターン ハーモニックパターン Market Structure / SMC ユーザー指定範囲の分析 以下を表示: パターンタイプ 市場方向 Score Momentum Breakoutレベル T1 / T2 / T3ターゲット Invalidationレベル Structure情報 選択
Calmer chart context, kept practical Northstar Flow Candles MT5 is a chart-window indicator that presents Heikin Ashi candles with a five-state trend context. It is designed for traders who want a quieter view of price while keeping the native chart available as an optional reference. Visual-only indicator: Northstar Flow Candles MT5 does not place trades and does not send popup, push, or email notifications. What appears on the chart Five candle states: strong bullish, bullish, balanced, bearis
FREE
VFI Quantum
Nikita Berdnikov
5 (1)
Introducing VFI (Volume Flow Indicator) – a trading indicator that analyzes the relationship between volume and price movement to identify key trading opportunities. The indicator displays the strength and direction of volume flow, providing clear signals about potential entry and exit points. Signals are formed based on zero line crossovers, crossovers between the VFI line and its exponential moving average (EMA), and when the indicator exits overbought and oversold zones. Attention! This stra
FREE
この指標は、2つの移動平均の差をヒストグラムの形で示しています。 移動平均には巨大なカスタマイズオプションがあります。 ヒストグラムの色が変わると、あらゆる方法で通知されます。端末でビープ音が鳴り、電話に通知を送信し、メールに電子メールを送信します。今、あなたは間違いなく取引を見逃すことはありません。 チャート上の線の形で完全に無料の移動平均交差点インジケータ: https://www.mql5.com/ja/market/product/148478 あなたのフィードバックは私にとって非常に重要です。 フィードバックは開発をはるかに良くし、私たちが一緒に前進するのに役立ちます。 ご質問がありますか、あなたの意見を共有したいですか? コメントを書いたり、メッセージを送信します-私はいつも連絡を取り合っています! このツールは、市場を監視するルーチンを引き継ぐあなたの信頼性の高いアシスタントになります。 交差点の瞬間を見越してチャートを常に見る代わりに、このタスクをインジケーターに委ねることができます。 明確なヒストグラム列を使用してトレンド強度のダイナミクスを視覚化するだけでなく、最も
FREE
Price Magnet — Price Density and Attraction Levels Indicator Price Magnet is a professional analytical tool designed to identify key support and resistance levels based on statistical Price Density. The indicator analyzes a specified historical period and detects price levels where the market spent the most time. These zones act as “magnets,” attracting price action or forming a structural base for potential reversals. Unlike traditional Volume Profile tools, Price Magnet focuses on price-time d
Gold Venamax - これは最高の株式テクニカル指標です。 指標アルゴリズムは資産の価格変動を分析し、ボラティリティと潜在的なエントリーゾーンを反映します。 インジケーターの機能: これは、快適で収益性の高い取引のためのマジックとトレンド矢印の 2 つのブロックを備えたスーパー インジケーターです。 チャート上にブロックを切り替えるための赤いボタンが表示されます。 マジックはインジケーター設定で設定されているため、異なるブロックを表示する 2 つのチャートにインジケーターをインストールできます。 Gold Venamax は、異なる矢印バッファー (GV と SD) を備えた 2 つのチャートに配置できます。 これを行うには、設定で異なる Magic を選択する必要があります。たとえば、あるマジック = 999、別のマジック = 666 を選択します。次に、チャート上の赤いボタンで矢印バッファを選択できます。 インジケーター設定の各矢印バッファー (GV および SD) には、快適で収益性の高い取引のための個別の矢印フィルターがあります (UseFiltrGV = true;
The Half ma arrow indicator for the MetaTrader 5 trading terminal is a simple but effective tool that gives a signal about a change in the current trend. The Half ma indicator looks like a solid dynamic line that changes color at the points where the trend changes. At these points, the indicator draws arrows of the corresponding color and direction.The Half ma arrow indicator for the MT5 terminal is not an independent source of input signals. It will be most effective to use it as a trend filte
Free automatic Fibonacci is an indicator that automatically plots a Fibonacci retracement based on the number of bars you select on the BarsToScan setting in the indicator. The Fibonacci is automatically updated in real time as new highest and lowest values appears amongst the selected bars. You can select which level values to be displayed in the indicator settings. You can also select the color of the levels thus enabling the trader to be able to attach the indicator several times with differe
FREE
Reverse TradeCopier for Followers can copy trades from an account that is running   Reverse TradeCopier for Source . Features: Copies trades from one source (master) account to multiple following (slave) accounts. Allow investor (read only) password for source (master) account. There are no complicated settings and input parameters, everything is easy. Works with different brokers. Works with different quotes symbols (EURUSD_FX, eurusd_m, etc.). Can copy orders from 4-digit quotes platform to 5-
FREE
VolumeBasedColorsBars — Free Powerful Volume Analysis for All Traders Unlock the hidden story behind every price bar! VolumeBasedColorsBars is a professional-grade, 100% FREE indicator that colorizes your chart candles based on real, adaptive volume analysis. Instantly spot surges in market activity, identify exhaustion, and catch the moves that matter. This indicator gives you:    • Dynamic color-coded bars for instant volume context    • Adaptive thresholds based on historical, session-awar
FREE
概要 このインジケーターは、クラシックな ドンチャンチャネル を強化したバージョンで、実践的なトレード機能を追加しています。 標準の3本線(上限、下限、中央線)に加え、 ブレイクアウト を検出し、チャート上に矢印で視覚的に表示します。また、チャートを見やすくするために、 現在のトレンド方向と逆側のラインのみを表示 します。 インジケーターの機能: 視覚的シグナル :ブレイクアウト時にカラフルな矢印を表示 自動通知 :ポップアップ、プッシュ通知、Eメール RSIフィルター :市場の相対的な強弱に基づいてシグナルを検証 カスタマイズ可能 :色、ラインの太さ、矢印コード、RSI閾値など 動作原理 ドンチャンチャネルは次のように計算します: 上限線 :直近N本のクローズ済みローソク足の最高値 下限線 :直近N本のクローズ済みローソク足の最安値 中央線 :最高値と最安値の平均値 上方ブレイクアウト は終値が上限線を超えたときに発生し、 下方ブレイクアウト は終値が下限線を下回ったときに発生します。 インジケーターは以下を行います: 3本のドンチャンラインを描画 方向転換後の最初のブレイクアウト
FREE
CCI Advanced is an enhanced Commodity Channel Index indicator for MetaTrader 5. It keeps the classic CCI engine but adds a clearer visual interface, automatic buy/sell signals, a dynamic histogram, and strong-signal and divergence detection. Features Automatic signals: prints buy/sell cues from CCI behavior at the zero and extreme levels. Dynamic color histogram: shows momentum strength and direction at a glance. Divergence detection: highlights divergence between price and CCI as an early rever
FREE
Enhanced FVG Enhanced FVG is a technical indicator for MetaTrader 5 that identifies Fair Value Gaps on the chart and measures the buyer-to-seller volume ratio within each detected gap. Volume classification is performed using M1 timeframe tick volume data, applying the same methodology used in standard Volume Profile analysis. How It Works The indicator scans three consecutive candlesticks to detect Fair Value Gaps. A Bullish FVG is identified when the high of the first candle does not overlap w
FREE
TradeInfos
Dustin Ricardo Pierenz
Track your spread and all position PnLs (Buy & Sell) in real-time – stay in control of your trades at a glance! Features: Real-time spread display (in pips) Total Buy position PnL Total Sell position PnL Clean, non-intrusive display layout Works with all symbols and timeframes Perfect for: Scalpers needing quick spread awareness Day traders monitoring long/short performance Risk managers optimizing exposure No need to switch tabs or rely on external tools — everything you need is visible at
FREE
This   Demand & Supply Zone Indicator with Volume Filtering   is a technical analysis tool for MetaTrader that identifies key price zones where buying (demand) or selling (supply) pressure is concentrated. It uses fractals, volume analysis, and price action to detect and highlight these zones on the chart. Key Features: Zone Detection Based on Fractals Identifies demand (support) and supply (resistance) zones using   fractal patterns   (local highs/lows). Zones are formed from   open prices   ar
FREE
KCI Candle: Advanced Kinematics Price Action The KCI (Kinematics Computing Index) Candle is a next-generation analytical tool designed to transform raw market data into crystal-clear visual intelligence. By painting the chart's candles based on deep mathematical kinematics, this indicator provides traders with an immediate, unambiguous reading of the current market direction and momentum. Built for professional traders who demand clean charts and pure data, the KCI Candle eliminates second-guess
FREE
このプロダクトを購入した人は以下も購入しています
FX-AIEA Smart Supply and Demand Zone Identification Indicator (Supply and Demand Indicators MT5) Version: 2.51 | Compatible Platform: MetaTrader 5  Why do trades need supply and demand zones? Supply and demand zones are the core manifestation of institutional order flow, reflecting real buying and selling power more accurately than traditional support and resistance. However, manual drawing is not only time-consuming but also highly subjective and prone to missing key areas. FX-AIEA Supp
Session High Low Lines Indicator that plots key intraday reference levels directly on the chart: the previous day's high/low and the current day's high/low, updated automatically as the new day forms. An optional previous week high/low can also be displayed. These levels are widely used as reference points for potential support and resistance zones, breakout confirmation, and range context during a trading session. Features Previous day High/Low lines Current day High/Low lines (updates in real
PrimeScalping is a powerful trading companion designed to generate high-probability entry signals with dynamic TP/SL/DP levels based on volatility. Built-in performance tracking shows win/loss stats, PP1/PP2 hits, and success rates — all updated live. Key Features: Buy/Sell signals with adaptive volatility bands Real-time TP/SL/DP levels based on ATR Built-in MA Filter with optional ATR/StdDev volatility Performance stats panel (Success, Profit/Loss, PP1/PP2) Alerts via popup, sound, push, or e
note: this indicator is for METATRADER4, if you want the version for METATRADER5 this is the link:  https://www.mql5.com/it/market/product/108106 TRENDMAESTRO ver 2.5 TRENDMAESTRO recognizes a new TREND from the start, he never makes mistakes. The certainty of identifying a new TREND is priceless. DESCRIPTION TRENDMAESTRO identifies a new TREND in the bud, this indicator examines the volatility, volumes and momentum to identify the moment in which there is an explosion of one or more of these da
BTCUSD PRO Signal Solution for MT5 BTCUSD PRO is a decision-support indicator for MetaTrader 5, designed for traders who analyze BTCUSD or BTCUSD# with a structured signal workflow. The product is not an automated trading system. It does not open, close, or manage trades automatically. It provides analytical buy and sell signal information and displays a visual trade plan on the chart so the user can make their own trading decisions. Main purpose BTCUSD PRO is designed for traders who prefe
SmartScalping is a powerful trading companion designed to generate high-probability entry signals with dynamic TP/SL/DP levels based on volatility. Built-in performance tracking shows win/loss stats, PP1/PP2 hits, and success rates — all updated live. Key Features: Buy/Sell signals with adaptive volatility bands Real-time TP/SL/DP levels based on ATR Built-in MA Filter with optional ATR/StdDev volatility Performance stats panel (Success, Profit/Loss, PP1/PP2) Alerts via popup, sound, push, or e
ScalpPoint is a powerful trading companion designed to generate high-probability entry signals with dynamic TP/SL/DP levels based on volatility. Built-in performance tracking shows win/loss stats, PP1/PP2 hits, and success rates — all updated live. Key Features: Buy/Sell signals with adaptive volatility bands Real-time TP/SL/DP levels based on ATR Built-in MA Filter with optional ATR/StdDev volatility Performance stats panel (Success, Profit/Loss, PP1/PP2) Alerts via popup, sound, push, or emai
MasterTrend Indicator for MT5 A powerful trend-following and signal-evaluation tool MasterTrend   is a custom MT5 indicator that combines Moving Averages and ATR-based risk/reward logic to generate clear buy/sell signals. It visualizes dynamic SL/TP levels, evaluates past trade outcomes, and displays win/loss statistics in a clean on-chart panel. Key features include: Buy/Sell signals based on MA crossovers ATR-based SL/TP1/TP2/TP3 levels with visual lines and labels Signal outcome tracking wit
このインジケーターは、市場で 関心が示されたゾーン をハイライトし、その後に 注文の蓄積ゾーン を表示します。 これは、大規模な**板情報(オーダーブック)**のように機能します。 これは、 巨大な資金 のためのインジケーターです。その性能は卓越しています。 市場にどんな関心が存在していても、 必ず目に見えるようになります 。 (これは 完全に再設計され、自動化されたバージョン です。もはや手動分析は必要ありません。) トランザクションスピード(取引速度) は新しい概念のインジケーターで、市場で大口注文が どこに・いつ 集中しているかを示し、それに基づいたチャンスを提供します。 トレンドの変化を 非常に早い段階 で察知することができます。 FXでは「出来高」と呼ばれているものは誤解されています。実際には、これは 時間あたりの価格変動量 です。したがって、正しい名称は トランザクションスピード です。 考え方・行動・分析の仕方すべてが問われます。 分析パラダイムの転換は非常に重要です。 このインジケーターは、FXにおける出来高の考え方を 根本から再定義 し、論理的な形で正確に活用する、
MetaTrader 5 向けスマート多層ブレイクアウト&プルバック検出器 「スマート・シンプル・ファスト!」 高確率のブレイクアウトエントリーを見逃すことにうんざりしていませんか? 複数のチャートを何時間もスキャンし、ブレイクアウトをトレンド方向と通貨のモメンタムに合わせようとして、それでも動きを逃してしまうことはありませんか? Break Pullback は、1つのインジケーターでそのすべてを解決します。 Break Pullback とは何ですか? Break Pullback は、マーケットストラクチャー、ブレイクアウト、トレンド継続のセットアップを取引するトレーダー向けに特別に設計されたプロフェッショナルグレードの MetaTrader 5 インジケーターです。 リアルタイムで複数の通貨ペアにわたるブレイクとプルバックの形成を自動的に検出し、3層の確認を通じてすべてのシグナルをフィルタリングします: ストラクチャラルブレイクアウト検出 — チャート上の主要なブレイクレベルを特定 HTF 日足バイアス — エントリーを支配的な日足トレンド方向に合わせる 通貨強弱指数 —
相場が本当は何をしているのかを見抜く。   3つの市場フェーズ(収縮・拡張・トレンド)を目の前でライブに捉え、トレンド・フェーズの初期段階でより優れたエントリーを取りましょう   。      当て推量はもう終わり。機関投資家やスマートマネーのように相場を読み始めましょう。   Apex Market Structure Pro(MT5版)は、ノイズを取り除き、あらゆるローソク足の下にある真の構造を見せる高精度のスマートマネー分析ツ   ールです。流動性、構造転換、蓄積ゾーン、トレンドバイアスを、ひとつのクリーンでプロフェッショナルなオーバーレイに集約します。遅行   指標に見切りをつけ、明晰さをもってトレードする準備のできた本気のトレーダーのために作られました。   重要:本インジケーターは Heikin Ashi(平均足)ローソク足での動作を前提に設計されています。使用前にチャートを Heikin Ashi   に設定し、その真価を解き放ってください。分析のすべては Heikin Ashi の価格の流れを軸に構築されています。Apex Market Structure Pr
OrderFlow Absorption – MT5用プロフェッショナル・デルタ&アブソープションシグナルインジケーター OrderFlow Absorptionで本物のオーダーフロー分析の力を解き放ちましょう。MetaTrader 5向けの究極のデルタヒストグラム&アブソープションシグナルインジケーターです。あらゆる価格変動の裏側で何が起きているのかを知りたいトレーダーのために設計されており、市場を動かす隠れた買い/売り圧力や吸収イベントを明らかにします。 特徴 デルタヒストグラムの可視化:   買い圧力・売り圧力を色分けされたヒストグラムで即座に表示。 アブソープションシグナル検出:   高度なロジックで強気・弱気の吸収イベントを特定し、反転の兆しを早期に通知。 チャートマーカー:   吸収シグナルをチャート上に直接マークし、視覚的に分かりやすく表示。 ポップアップアラート:   新しい吸収シグナルが出現した際にリアルタイムで通知。 カスタマイズ可能な閾値:   弱いシグナルを除外し、高確率のセットアップに集中。 リソース管理:   大きなチャートでも高速に動作する効率的な計算。
マーケットメーカーのためのツール。 Meravith は次の機能を提供します: すべての時間足を分析し、現在有効なトレンドを表示します。 強気と弱気の出来高が等しくなる流動性ゾーン(出来高均衡)を強調表示します。 異なる時間足のすべての流動性レベルをチャート上に直接表示します。 テキスト形式の市場分析を生成し、参考情報として表示します。 現在のトレンドに基づいて目標値、サポートレベル、ストップロスを計算します。 取引のリスクリワード比を算出します。 口座残高に基づいてポジションサイズを計算し、潜在的な利益を推定します。 また、市場に大きな変化があった場合には警告を表示します。 インジケーターの主要ライン: 強気/弱気の出来高エグゾーストライン ― 目標値として機能します。 市場のトレンドを示すライン。市場が強気か弱気かによって色が変わり、トレンドのサポートとして機能します。主にその色が市場センチメントを示します。 出来高均衡ライン(Eq)。Eq(Volume Equilibrium)ラインはシステムの中核です。これは買い手と売り手の出来高のバランスポイントを表します。市場の流動性を示し
==================================================================== SMC Pro v6.1 APEX AI — XAUUSD Gold Empire MetaTrader 5 インジケーター · Smart Money Concepts · 予測インテリジェンス・エンジン ==================================================================== SMC Pro v6.1 APEX AI は、MetaTrader 5 上の XAUUSD(ゴールド)専用に構築された、プロフェッショナルな Smart Money Concepts インジケーターシステムです。 完全な SMC フレームワーク — Order Blocks、Liquidity sweeps(流動性スイープ)、Fair Value Gaps、Break of Structure、Change of Character — に加え、AI を活用した 8 つの新モジュールを組み合わせ、精密なビ
「 Dynamic Scalper System MT5 」インジケーターは、トレンド波の中でスキャルピング取引を行う手法のために設計されています。 主要通貨ペアと金でテスト済みで、他の取引商品との互換性があります。 トレンドに沿った短期的なポジションオープンのシグナルを提供し、追加の価格変動サポートも提供します。 インジケーターの原理 大きな矢印はトレンドの方向を決定します。 トレンド波の中では、小さな矢印の形でスキャルピングシグナルを生成するアルゴリズムが機能します。 赤い矢印は強気方向、青い矢印は弱気方向です。 トレンドの方向には敏感な価格変動ラインが描かれ、小さな矢印のシグナルと連動します。 シグナルは次のように機能します。適切なタイミングでラインが現れるとエントリーシグナルが形成され、ラインが開いている間はポジションが保持され、完了すると取引が終了します。 推奨される動作時間枠はM1~H4です。 矢印は現在のローソク足に形成され、次のローソク足が開いている場合は、前のローソク足の矢印は再描画されません。 入力パラメータ Trend Wave Period - トレ
VTrende Pro
Andrii Diachenko
5 (1)
VTrende Pro - MTF indicator for trend trading with a display panel for MT5 *** Videos can be translated into any language using subtitles (video language - Russian) Although the signals of the VTrende Pro indicator can be used as signals of a full-fledged trading system, it is recommended to use them in conjunction with the Bill Williams TS. VTrende Pro is an extended version of the VTrende indicator. Difference between Pro version and VTrende: - Time zones - Signal V - signal 1-2 waves -    S
ARIPoint
Temirlan Kdyrkhan
1 (1)
ARIPoint is a powerful trading companion designed to generate high-probability entry signals with dynamic TP/SL/DP levels based on volatility. Built-in performance tracking shows win/loss stats, PP1/PP2 hits, and success rates all updated live. Key Features: Buy/Sell signals with adaptive volatility bands Real-time TP/SL/DP levels based on ATR Built-in MA Filter with optional ATR/StdDev volatility Performance stats panel (Success, Profit/Loss, PP1/PP2) Alerts via popup, sound, push, or email Cu
This indicator automatically detects internal & swing market structure, Fibonacci Retracement and Fibo Levels. Features Full internal & swing market structure labeling in real-time Fibonacci Retracement Fibonacci Levels After purchasing the indicator, the full source code is provided, and via indicator buffers it can be easily integrated into your Expert Advisors (EAs) for automated trading strategies.
OmniSync Projection
Antonio-alin Teculescu
5 (1)
Chronos Fractal Engine is an innovative price projection indicator for MetaTrader 5, designed to transform your technical analysis by intelligently identifying and projecting historical price patterns. Built upon an advanced correlation algorithm and the fractal principles of the market, this powerful tool visualizes potential future price movements, giving you a unique edge in your trading decisions. What is Chronos Fractal Engine? At its core, the Chronos Fractal Engine employs a sophisticat
Euro Escalper — Puro no Kikan Toshi Sukyarupingu Injikeeta Euro Escalper wa, subete no entori de kikan toshi reberu no seido wo motomeru toreedaa no tame ni sekkei sareta kooseinou torihiki injikeeta desu. Gousei Shisuu (Deriv), Forex, oyobi MetaTrader 5 de riyou kanou na subete no shisan de kinoushimasu. Fibonacci beisu no ryuudousei zoon, naizou SuperTrend enjin, oyobi riaru taimu no purofesshonaru dasshubooddo wo kumiawasemasu. Shuyo na Riten Sai Egaki Nashi: Shingou yajirushi wa rousoku ashi
MERAVITH SCANNERは、MetaTrader 5用のプロフェッショナルな金融市場インジケーターで、複数の分析ツールを一つの統合システムにまとめています。独自の出来高加重平均価格(VWAP)手法を使用してすべての計算を自動で行い、主観的な解釈を完全に排除します。 このインジケーターは、すべての資産クラス(FX、株式、指数、商品、暗号通貨)およびM1から月足までのすべての時間軸で動作します。基本原理は「価格は出来高に従う」というものです。MERAVITHは機関投資家の出来高が集中するポイントを特定し、その集中から数学的に正確な価格レベルを導き出します。予測や投機は行わず、計算のみを行います。 MERAVITH SCANNERを使用すると、28の主要FX通貨ペアをすべての時間軸でわずか2~3分でスキャンできます。また、任意の市場をスキャンすることも可能です。例えば、約100銘柄の株式を約10分でスキャンできます。 インジケーターは、消耗レベル、均衡線、偏差、統計レベル、およびターゲット予測を算出します。 チャート要素 Origin Point :すべての計算が始まる起点です。イン
Big Player Range
Thalles Nascimento De Carvalho
5 (3)
BigPlayerRange — MT5向け最強インジケーター BigPlayerRange は、MetaTrader 5 で日経ミニやドル先物などの取引において、 最も効果的なインジケーター と評価されています。大口投資家(機関投資家)の行動を可視化し、高精度なテクニカル分析を可能にします。 どのように機能するのか? BigPlayerRangeは、買い圧力ゾーン(緑ライン)と売り圧力ゾーン(赤ライン)を描画し、価格がその範囲を超えるとトレンド方向への動きを示唆します。 緑のライン上で終値: 買いの勢いが強く、上昇トレンドの可能性。 赤のライン下で終値: 売り圧力が優勢で、下落が予想される。 範囲内での価格: レンジ相場でブレイクを待つ段階。 主なメリット: 機関投資家ゾーンの検出: 大口のエントリーポイントを視覚化。 自動ターゲット計算: 利確ポイントを戦略的に設定。 プルバックの可能性分析: リスク管理に役立つ情報提供。 推奨の使い方: Imbalance DOM Pro と併用してゾーンブレイクを確認。 SwingVolum
プレミアムレベルは、正しい予測の精度が80%を超える独自の指標です。 この指標は、最高のトレーディングスペシャリストによって2か月以上テストされています。 あなたが他のどこにも見つけられない作者の指標! スクリーンショットから、このツールの正確さを自分で確認できます。 1は、1キャンドルの有効期限を持つバイナリーオプションの取引に最適です。 2はすべての通貨ペア、株式、商品、暗号通貨で機能します 手順: 赤い矢印が表示されたらすぐにダウントレードを開き、青い矢印が表示されたら閉じます。青い矢印の後に開くこともできます。 試してテストしてください!推奨設定はデフォルトです! 日足チャートで最高の精度を示します! インディケータは、2600 Pipsの収益性に対して、約10Pipsという非常に小さなマージンを使用します。
SMC Institutional Suite v3.7 Professional Smart Money Concept Indicator for MetaTrader 5 What is New in Version 3.7 - Visual Stability Update This release focuses entirely on one goal: making every zone, label, and line on your chart rock-solid stable. There is no more flickering, no more zones disappearing on a new candle, and no more duplicate drawings. Order Block (OB) zones no longer flicker or disappear. Once drawn, they stay permanently on the chart. Equal Highs and Equal Lows (EQH / EQL)
MATADOR GOLD XAUUSD M5 Scalp Signals for MT5 MATADOR GOLD is a decision-support indicator for MetaTrader 5, designed for traders who analyze short-term Gold movement on the M5 timeframe. The indicator does not open, close, or manage trades automatically. It provides buy and sell signal guidance so the user can make their own trading decisions according to their risk plan, broker conditions, and trade management rules. Main purpose MATADOR GOLD is built to help traders avoid noisy signal flow and
ZIVA Signal Intelligence
Hassan Abdullah Hassan Al Balushi
ZIVA Signal Intelligence An Adaptive, Modular Market Intelligence System ZIVA Signal Intelligence is not positioned as a conventional trading indicator. It is a fully integrated, proprietary market intelligence system engineered to deliver structured, high-precision interpretation of price behavior within a controlled analytical environment. Developed through an independent architectural approach, ZIVA does not rely on, derive from, or replicate existing indicators. It represents a standalone
First time on MetaTrader, introducing IQ Star Lines - an original Vedic Astrology based indicator. "Millionaires don't use astrology, billionaires do" . - J.P. Morgan, Legendary American financier and banker. Welcome to  the new and updated  IQ Star Lines , the ultimate fusion of ancient planetary harmonic cycles and modern quantitative trading. published for the   first time on Metatrader. This is an indicator built by the developer, who has spent almost 2 decades trading while studying Vedic
+++++++++++++++++++++++++++++++++++++++++++++++++++++++++++++++++++++++++++++++++++++++++++++++++ +++ Link to EURUSD Only Free Version -->  https://www.mql5.com/en/market/product/156904?source=Unknown +++++++++++++++++++++++++++++++++++++++++++++++++++++++++++++++++++++++++++++++++++++++++++++++++ Hallo Trader, This is a traditional GANN & FIBONACCI strategy based on detection of an impulsive move in the opposite direction. This is called a Breakout. At the moment of Breakout, the indicator draw
Hidden Trend Channel Project 17 Tool SPECIAL NOVEMBER SALE is now finished. Price goes back to normal.  This is an Automated Tool for Multi Timeframe Trend Channel Analysis Visualization with Intelligent Range Market, Trending Market, Reversal, Breakout Detection.  It draws multiple Trend Channels with multiple sub-trendlines levels inside the channel for perfectly give you the trader, the crystal clear Trend channels where price trend direction is moving. This tool is accurately useful for T
作者のその他のプロダクト
MagicTrigger — マルチタイムフレーム HD/RD ダイバージェンス確認インジケーター MagicTrigger は、上位足(HD)における構造的ダイバージェンスを検出し、同一の価格ゾーン内で下位足(RD)に現れる一致したダイバージェンスによる確認を待つ、マルチタイムフレームのダイバージェンス検出エンジンです。上位足のスイング構造と下位足の確認が一致した場合にのみ、インジケーターはシグナルをマークし、推奨エントリートリガー、ストップロス、2つのターゲットレベルを同時に表示します。 動作の仕組み インジケーターは、チャートの現在の期間の上下にある一連のタイムフレームをスキャンします。上位足では、価格のスイングとスムージングされたオシレーターラインとの間のダイバージェンスパターン(「HD」ダイバージェンス)を探します。次に、HD構造によって定義された時間・価格ゾーン内で、下位足にも同じ方向のダイバージェンス(「RD」ダイバージェンス)が現れているかを確認します。シグナルは、必要な最小数の下位足が上位足の構造を確認した場合にのみ生成され、単一タイムフレームの孤立したダイバージェン
Unlock the power of "Psychological Numbers" with RoundLevel . Large financial institutions, banks, and hedge funds don't place orders at random prices; they prefer round numbers (e.g., 1.1000, 105.00, 2000). These levels act as invisible magnets for price action, serving as high-probability support and resistance zones. Key Features: Universal Compatibility: Works perfectly on Forex, Gold (XAUUSD), Indices, and Stocks. Clean Visualization: Automatically draws horizontal levels without cluttering
Persian Ichimoku Pro: The Fibonacci Evolution for MT4 Why settle for 1930s formulas when you can trade with 21st-century precision? Most traders fail with Ichimoku because they use static, outdated settings.   Persian Ichimoku Pro   breaks these limits by integrating   Advanced Fibonacci Mathematics   and the exclusive   Future Quality Line —a combination never seen before in standard indicators. ### THE "UNFAIR ADVANTAGE": WHAT’S INSIDE? 1. The Quality Line (Your Trend Sentinel) This is the "S
MGH-CrossAlert — Multi-Line, Multi-Timeframe Crossover Alert Indicator MGH-CrossAlert is a crossover detection indicator for MetaTrader 5 that monitors two user-selected lines and generates alerts when they cross or reach equality. Unlike standard moving average crossover tools, this indicator supports a wide range of line types and allows each line to be drawn from an independent timeframe. Supported Line Types Each of the two monitored lines can be configured independently as one of the follo
Overview MGH-CrossAlert Histogram is a sub-window histogram indicator for MetaTrader 5. It displays the relationship between any two configurable lines as a color-coded histogram bar by bar, showing which line is dominant, how large the gap between them is, and when a crossover occurs. The histogram runs in a separate sub-window, keeping the price chart uncluttered. How It Works Each bar on the histogram reflects the live relationship between the two selected lines: Green — Line 1 is above Line
Overview MGH-MultiMACD-RD is a multi-timeframe MACD divergence indicator for MetaTrader 4. It monitors up to 6 timeframes simultaneously on a single chart, detects both regular and hidden divergences, and delivers alerts when a divergence is confirmed. The indicator was developed to address three common limitations found in standard MACD divergence tools: single-timeframe analysis, signal repainting, and inconsistent divergence line drawing. Key Features Multi-Timeframe Analysis The indicator di
Multi-Timeframe MACD Hidden Divergence Detector The trend continuation signal most traders never see — now detected automatically across 6 timeframes. Overview Regular divergence tells you when a trend may be reversing. Hidden divergence tells you when it is about to continue — and it is the signal that professional trend-following traders rely on most. The problem is that hidden divergence is significantly harder to spot than regular divergence, and virtually no indicator on MQL5 Market detect
MGH-MultiStoch — Multi-Timeframe Trend Detection and Wave Analysis MGH-MultiStoch is a multi-timeframe trend indicator that displays up to 6 timeframes simultaneously in one window. It helps traders confirm trend direction across timeframes, count market waves visually, and build forward-looking wave scenarios based on higher-timeframe crosses. The indicator uses a custom multi-timeframe calculation method developed specifically for this product. It is available for both MetaTrader 4 and MetaTra
MGH-MagicLine — Trend & Multi-Timeframe Divergence in One Tool MagicLine combines trend detection and divergence analysis into a single indicator — a refined alternative to running MultiStoch and MultiMACD separately, with cleaner output and less lag. It is a confirmation and analysis tool . It does not give entry points, Take Profit or Stop Loss. Instead, it adds a strong, flexible confirmation layer that fits almost any trend-based strategy and helps you read the market with more clarity. Thre
Elevate your trading with the precision of "Big Figures." Financial markets are not driven by random numbers; they are driven by institutional liquidity. Central banks, hedge funds, and major commercial traders consolidate their orders at whole integer levels (e.g., 1.1000, 2000.00, 150.00). These are the "Psychological Magnets" where the real price action happens. RoundLevel Pro for MetaTrader 5 is a high-performance tool designed to visualize this invisible grid of institutional interest with
Persian Ichimoku Pro: The Fibonacci Evolution for MT5 Why settle for 1930s formulas when you can trade with 21st-century precision? Most traders fail with Ichimoku because they use static, outdated settings. Persian Ichimoku Pro breaks these limits by integrating Advanced Fibonacci Mathematics and the exclusive Future Quality Line —a combination never seen before in standard indicators. ### THE "UNFAIR ADVANTAGE": WHAT’S INSIDE? 1. The Quality Line (Your Trend Sentinel) This is the "Secret Sauce
MGH-CrossAlert — Multi-Line, Multi-Timeframe Crossover Alert Indicator MGH-CrossAlert is a crossover detection indicator for MetaTrader 5 that monitors two user-selected lines and generates alerts when they cross or reach equality. Unlike standard moving average crossover tools, this indicator supports a wide range of line types and allows each line to be drawn from an independent timeframe. Supported Line Types Each of the two monitored lines can be configured independently as one of the follo
Overview MGH-CrossAlert Histogram is a sub-window histogram indicator for MetaTrader 5. It displays the relationship between any two configurable lines as a color-coded histogram bar by bar, showing which line is dominant, how large the gap between them is, and when a crossover occurs. The histogram runs in a separate sub-window, keeping the price chart uncluttered. How It Works Each bar on the histogram reflects the live relationship between the two selected lines: Green — Line 1 is above Line
Overview MGH-MultiMACD-RD is a multi-timeframe MACD divergence indicator for MetaTrader 5. It monitors up to 6 timeframes simultaneously on a single chart, detects both regular and hidden divergences, and delivers alerts when a divergence is confirmed. The indicator was developed to address three common limitations found in standard MACD divergence tools: single-timeframe analysis, signal repainting, and inconsistent divergence line drawing. Key Features Multi-Timeframe Analysis The indicator di
Multi-Timeframe MACD Hidden Divergence Detector The trend continuation signal most traders never see — now detected automatically across 6 timeframes. Overview Regular divergence tells you when a trend may be reversing.   Hidden divergence tells you when it is about to continue   — and it is the signal that professional trend-following traders rely on most. The problem is that hidden divergence is significantly harder to spot than regular divergence, and virtually no indicator on MQL5 Market det
MGH-MultiStoch — Multi-Timeframe Trend Detection and Wave Analysis (MT5) MGH-MultiStoch is a multi-timeframe trend indicator that displays up to 6 timeframes simultaneously in one window. It helps traders confirm trend direction across timeframes, count market waves visually, and build forward-looking wave scenarios based on higher-timeframe crosses. This is the MetaTrader 5 version. Because MT5 supports a wider range of timeframes, this version adds full per-line timeframe selection, so you ca
MagicTrigger — マルチタイムフレーム HD/RD ダイバージェンス確認インジケーター(MT5版) MagicTrigger は、上位足(HD)における構造的ダイバージェンスを検出し、同一の価格ゾーン内で下位足(RD)に現れる一致したダイバージェンスによる確認を待つ、マルチタイムフレームのダイバージェンス検出エンジンです。上位足のスイング構造と下位足の確認が一致した場合にのみ、インジケーターはシグナルをマークし、推奨エントリートリガー、ストップロス、2つのターゲットレベルを同時に表示します。 このMetaTrader 5版は、標準期間に加えて、M2、M3、M4、M6、M12、M20、H2、H3、H6、H8、H12を含む、MT5で利用可能な期間の全範囲を使用してタイムフレームチェーンを構築します。インジケーターが設定されるタイムフレームによって、スキャンチェーンは最大15のタイムフレームを含むことができ、標準的なMT4の期間セットのみで構築されたチェーンよりも、明らかにきめ細かいマルチタイムフレーム構造のビューを提供します。 動作の仕組み インジケーターは、チャートの現在の期
フィルタ:
zahra g.h
161
zahra g.h 2026.07.29 09:14 
 

ユーザーは評価に対して何もコメントを残しませんでした

Ashkan
167
Ashkan 2026.07.26 18:12 

 

ユーザーは評価に対して何もコメントを残しませんでした

Ali Ghandi
129
Ali Ghandi 2026.07.25 02:07 
 

ユーザーは評価に対して何もコメントを残しませんでした

aretrader
15
aretrader 2026.07.24 01:03 
 

ユーザーは評価に対して何もコメントを残しませんでした

Mostafa Ghanbari
3569
開発者からの返信 Mostafa Ghanbari 2026.07.24 03:23
Great to hear! Glad the multi-timeframe approach is proving both useful and profitable for you 🙏
mohsen yari
108
mohsen yari 2026.07.23 06:34 
 

ユーザーは評価に対して何もコメントを残しませんでした

Mostafa Ghanbari
3569
開発者からの返信 Mostafa Ghanbari 2026.07.24 03:22
Really glad to hear that! Appreciate you finding it profitable in your trading 🙏
Mahmoudrezakheiri
168
Mahmoudrezakheiri 2026.07.23 06:16 
 

ユーザーは評価に対して何もコメントを残しませんでした

Mostafa Ghanbari
3569
開発者からの返信 Mostafa Ghanbari 2026.07.24 03:22
Thank you so much! Glad the crossover signals from the magic lines are working well for your trades 🙏
Mehdi Saberi
88
Mehdi Saberi 2026.07.22 13:49 
 

ユーザーは評価に対して何もコメントを残しませんでした

Mostafa Ghanbari
3569
開発者からの返信 Mostafa Ghanbari 2026.07.24 03:21
Great to hear! Glad the trend and divergence analysis is coming through clear without crowding the chart, and that the Fast/Long/Slow modes plus alerts are working well as confirmation for your trend strategies 🙏
Hossein Nabi
168
Hossein Nabi 2026.07.22 11:26 
 

ユーザーは評価に対して何もコメントを残しませんでした

Mostafa Ghanbari
3569
開発者からの返信 Mostafa Ghanbari 2026.07.24 03:21
Really appreciate that! Glad the effort is coming through as useful for you 🙏
mehdi emrahpour
99
mehdi emrahpour 2026.07.21 16:33 
 

ユーザーは評価に対して何もコメントを残しませんでした

Mostafa Ghanbari
3569
開発者からの返信 Mostafa Ghanbari 2026.07.24 03:20
Glad to hear that! 🙏
Parsaei
164
Parsaei 2026.07.21 13:53 
 

ユーザーは評価に対して何もコメントを残しませんでした

Mostafa Ghanbari
3569
開発者からの返信 Mostafa Ghanbari 2026.07.24 03:19
Really glad to hear that! Appreciate you finding it valuable across the board 🙏
Mohammad panahi
169
Mohammad panahi 2026.07.20 18:23 
 

ユーザーは評価に対して何もコメントを残しませんでした

Mostafa Ghanbari
3569
開発者からの返信 Mostafa Ghanbari 2026.07.21 02:59
Really appreciate that! Glad it's running smoothly and delivering exactly the functionality you needed 🙏
Ben_Ns
164
Ben_Ns 2026.07.19 21:09 
 

ユーザーは評価に対して何もコメントを残しませんでした

Mostafa Ghanbari
3569
開発者からの返信 Mostafa Ghanbari 2026.07.20 02:42
Thank you so much! Really glad it's delivering exactly what you needed. Appreciate the recommendation 🙏
aminaran
168
aminaran 2026.07.19 18:45 
 

ユーザーは評価に対して何もコメントを残しませんでした

Mostafa Ghanbari
3569
開発者からの返信 Mostafa Ghanbari 2026.07.20 02:41
Thank you so much for the kind words! Glad the creativity behind it stood out to you 🙏
mahagh59
15
mahagh59 2026.07.19 18:33 
 

ユーザーは評価に対して何もコメントを残しませんでした

Mostafa Ghanbari
3569
開発者からの返信 Mostafa Ghanbari 2026.07.20 02:40
Thank you so much for these heartfelt words! Really appreciate your kindness and support. Wishing you all the best in your trading journey 🙏
alisaadat
167
alisaadat 2026.07.19 17:49 
 

ユーザーは評価に対して何もコメントを残しませんでした

Mostafa Ghanbari
3569
開発者からの返信 Mostafa Ghanbari 2026.07.20 02:40
Thank you! 🙏
ems ri
170
ems ri 2026.07.19 16:38 
 

ユーザーは評価に対して何もコメントを残しませんでした

Mostafa Ghanbari
3569
開発者からの返信 Mostafa Ghanbari 2026.07.20 02:39
Thank you for the thoughtful and balanced feedback! Glad it's simplifying your market analysis and helping you stay focused on decisions. Completely agree — it's meant to complement a solid strategy, not replace it. Appreciate you seeing it as a useful addition to your toolkit 🙏
Vahid Sadeghi
160
Vahid Sadeghi 2026.07.19 14:59 
 

ユーザーは評価に対して何もコメントを残しませんでした

Mostafa Ghanbari
3569
開発者からの返信 Mostafa Ghanbari 2026.07.20 02:39
Thank you so much for this fantastic review! It's incredibly rewarding to hear that the setup was quick and the charts stayed clean while the signals proved reliable right from the start. Catching a clean win on BTCUSD M15 so early on is a great sign, and it's exactly the kind of consistency we aim for with MagicLine. Boosting trading confidence is really the core goal behind this tool, so knowing it's already making a difference for you means a lot. Wishing you continued success and many more solid trades ahead 🙏
alifakhroddin
95
alifakhroddin 2026.07.19 14:41 
 

ユーザーは評価に対して何もコメントを残しませんでした

Mostafa Ghanbari
3569
開発者からの返信 Mostafa Ghanbari 2026.07.20 02:36
Thank you so much! 🙏
HAMED HAJI AHMADI
149
HAMED HAJI AHMADI 2026.07.19 09:07 
 

ユーザーは評価に対して何もコメントを残しませんでした

Mostafa Ghanbari
3569
開発者からの返信 Mostafa Ghanbari 2026.07.20 02:35
Thank you so much, glad it was helpful 🙏
Shayan Navidi
88
Shayan Navidi 2026.07.19 07:41 
 

ユーザーは評価に対して何もコメントを残しませんでした

Mostafa Ghanbari
3569
開発者からの返信 Mostafa Ghanbari 2026.07.20 02:34
Thank you so much for the thoughtful review! Really glad the multi-timeframe trend and divergence analysis is coming through clean and clutter-free on your charts 🙏
12
レビューに返信