Multi Stoch MT5
- インディケータ
- バージョン: 1.0

MGH-MultiStoch — Multi-Timeframe Trend Detection and Wave Analysis (MT5)
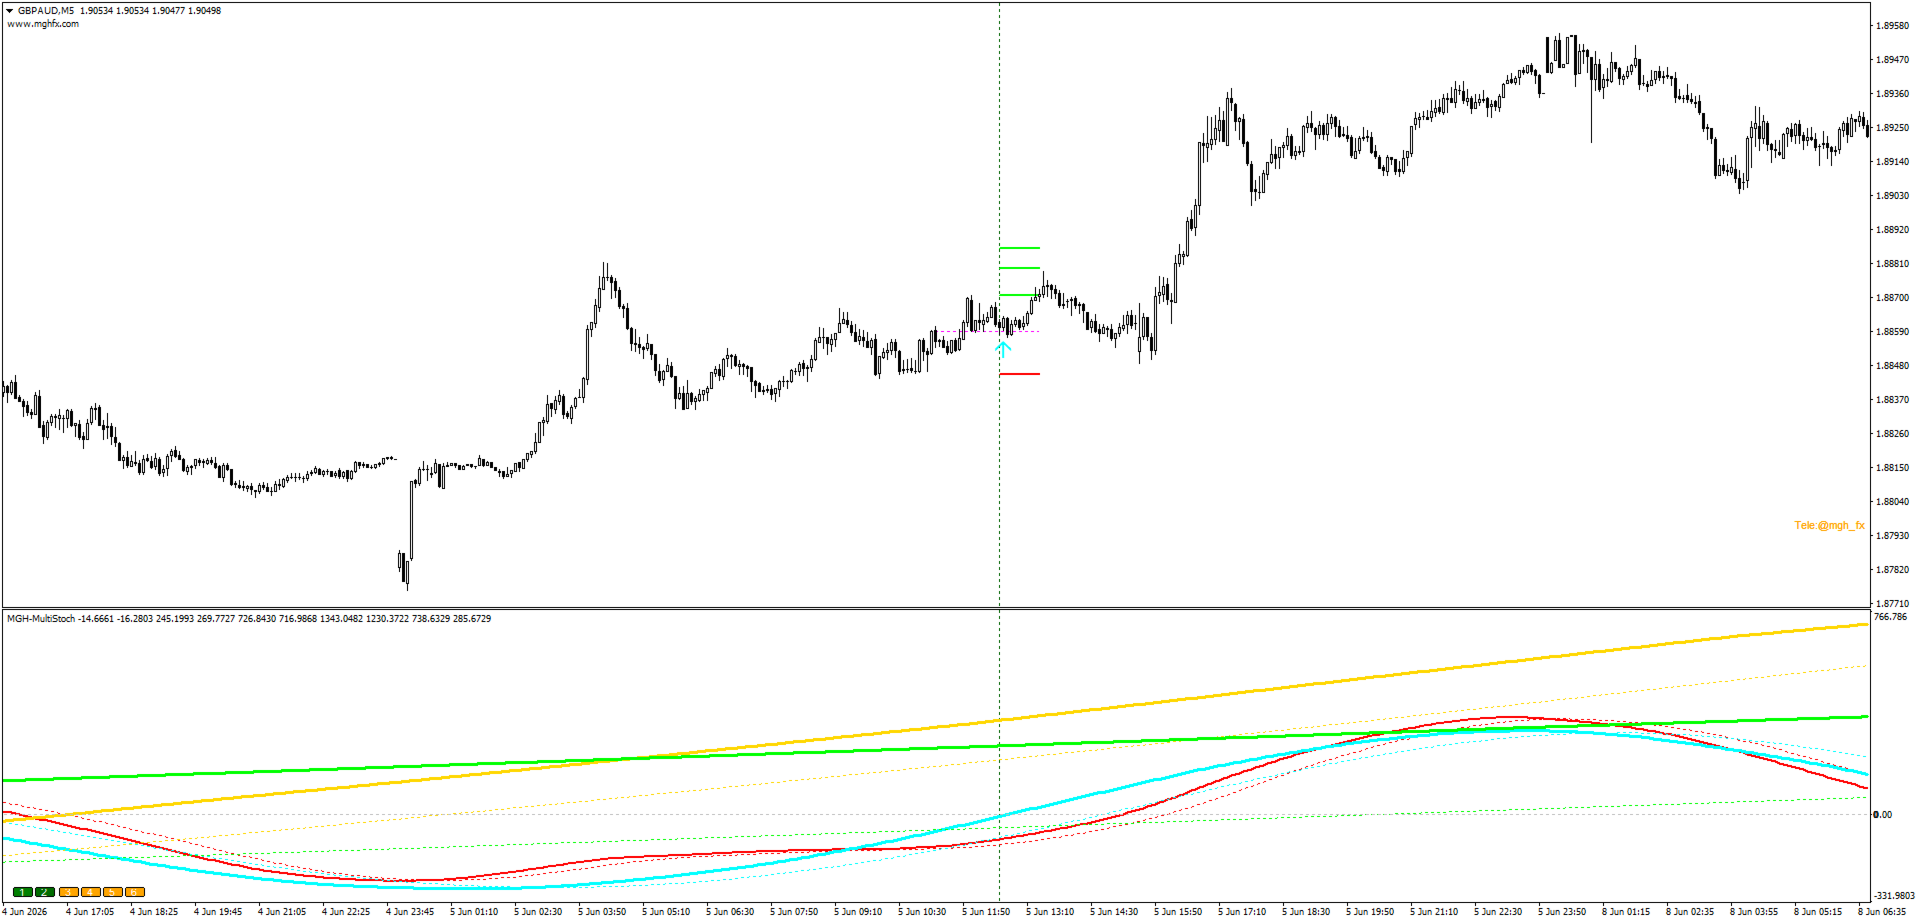
MGH-MultiStoch is a multi-timeframe trend indicator that displays up to 6 timeframes simultaneously in one window. It helps traders confirm trend direction across timeframes, count market waves visually, and build forward-looking wave scenarios based on higher-timeframe crosses.
This is the MetaTrader 5 version. Because MT5 supports a wider range of timeframes, this version adds full per-line timeframe selection, so you can assign an independent timeframe to each of the six lines.
The Problem It Addresses
A common difficulty in trading is receiving a signal on the current chart that lacks confirmation from higher timeframes. Experience in designing automated trading systems shows that correct multi-timeframe alignment is an important factor in the final results of a trading system.
MGH-MultiStoch displays the trend state of up to 6 timeframes in a single window. This allows you to quickly check whether a signal on your working timeframe agrees with the larger market structure.
Timeframe Selection: Auto or From Inputs
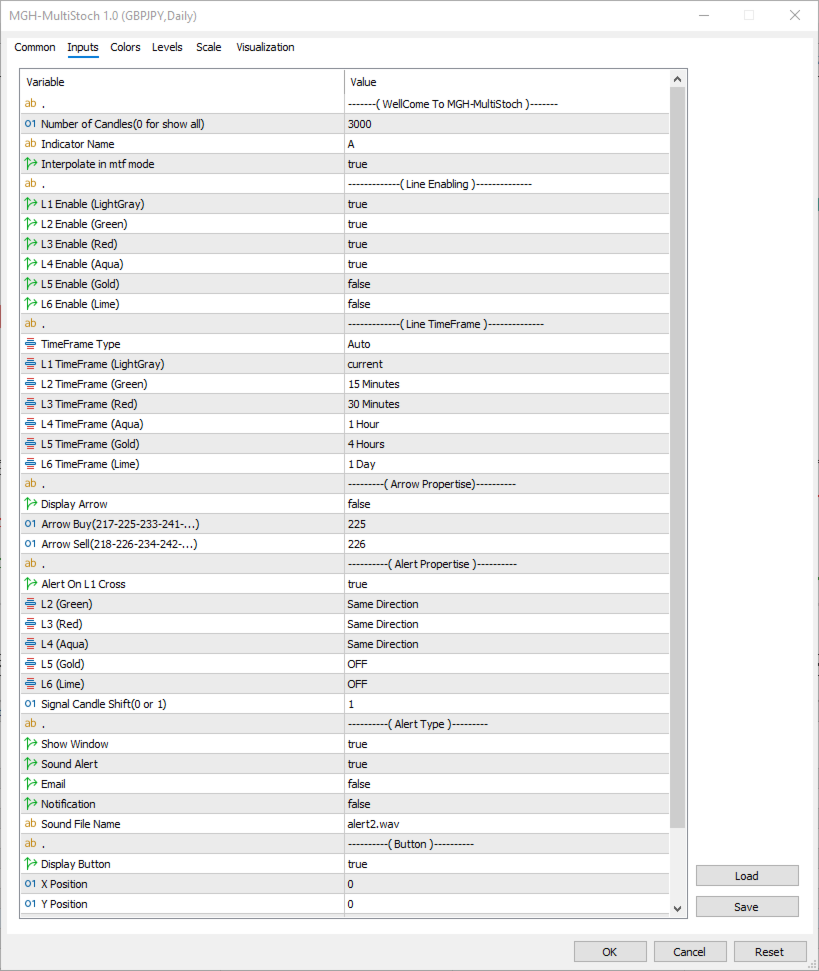
This MT5 version gives you two ways to set the timeframes for the six lines, controlled by the TimeFrame Type setting.
When TimeFrame Type is set to Auto, the indicator selects the timeframes automatically, following the principle of adjacent timeframes with a ratio of about 4 to 6 times. You do not need to set anything manually.
When TimeFrame Type is set to From Inputs, the indicator reads the timeframe of each line directly from the input settings. You assign a timeframe to each line independently, for example L1 current, L2 M15, L3 M30, L4 H1, L5 H4, L6 D1. This gives you full control over the exact series you want to analyse.
Use as a Confirmation Filter
The indicator can serve as a confirmation tool for trend-following and reversal strategies.
For trend strategies, you can require that one or two higher timeframes agree with your signal direction before entering. This filter can improve the quality of signals in many trading systems.
For reversal strategies, you can observe the moment a new cross appears on a higher timeframe, which is an early structural sign of a possible change in direction.
For wave analysis, the line crosses divide the market into segments, which makes Elliott wave counting simpler and more visual.
Wave Projection Method
The indicator supports a structured method for building forward wave scenarios.
Use adjacent timeframes with a ratio of about 4 to 6 times. For example, M15, H1, H4 and H12 or D1 form a suitable series for wave analysis.
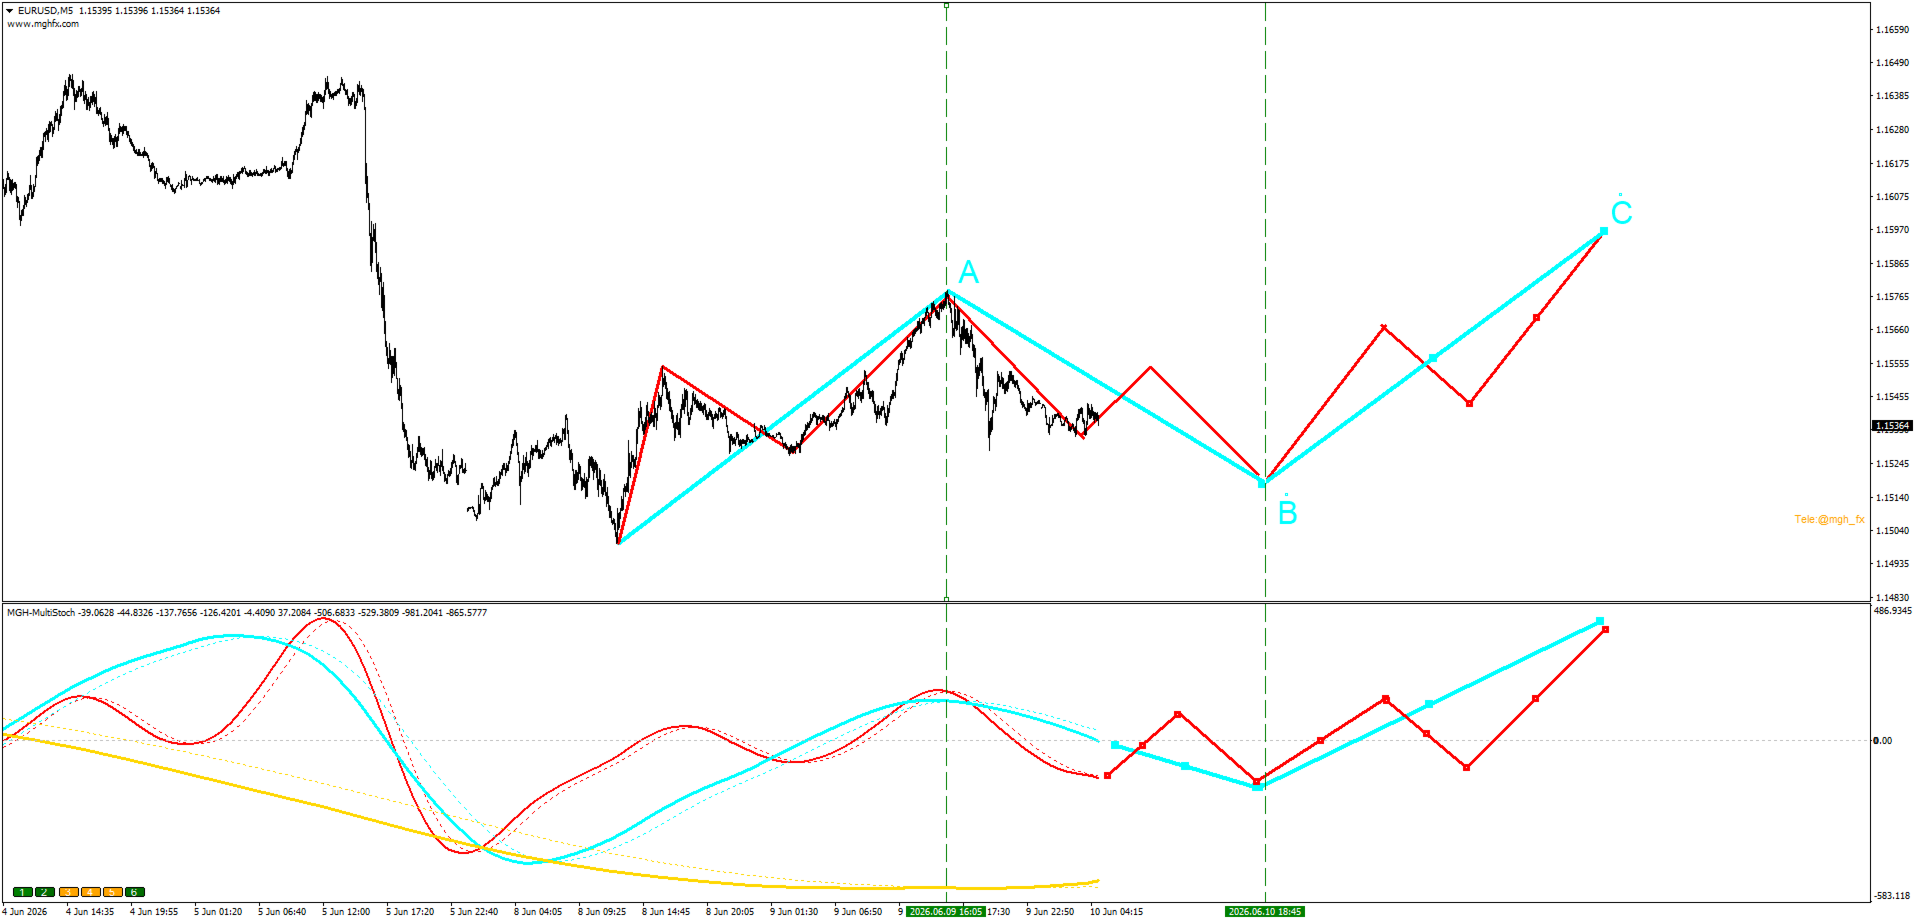
When working on M15, a motive wave on H1 is typically built from an a-b-c-d-e sequence on M15. These swings need to form before the H1 motive wave completes, with a minimum of a-b-c. A corrective wave on H1 is typically built from an a-b-c sequence on M15, with a minimum of a single a-wave.
The method is most applicable right after a new cross on a higher timeframe such as H4 or D1. At that moment, depending on whether the developing H1 wave is motive or corrective, you can outline the expected wave structure on both M15 and H1 in advance.
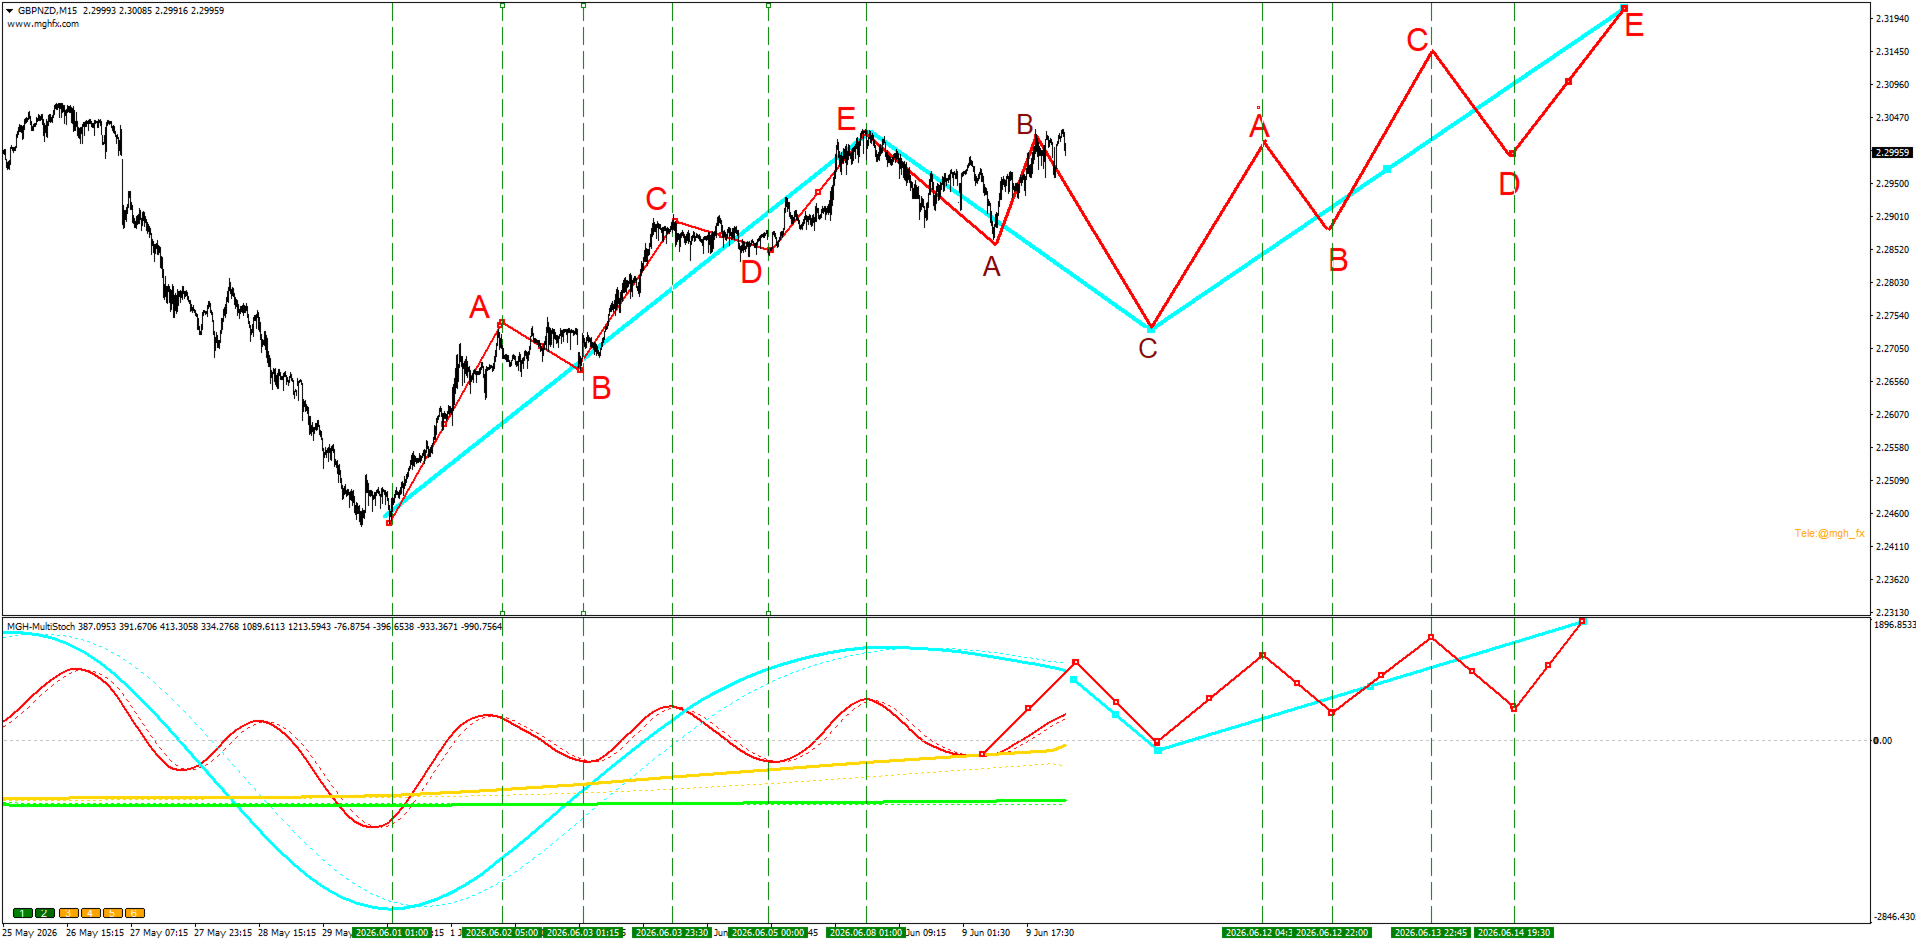
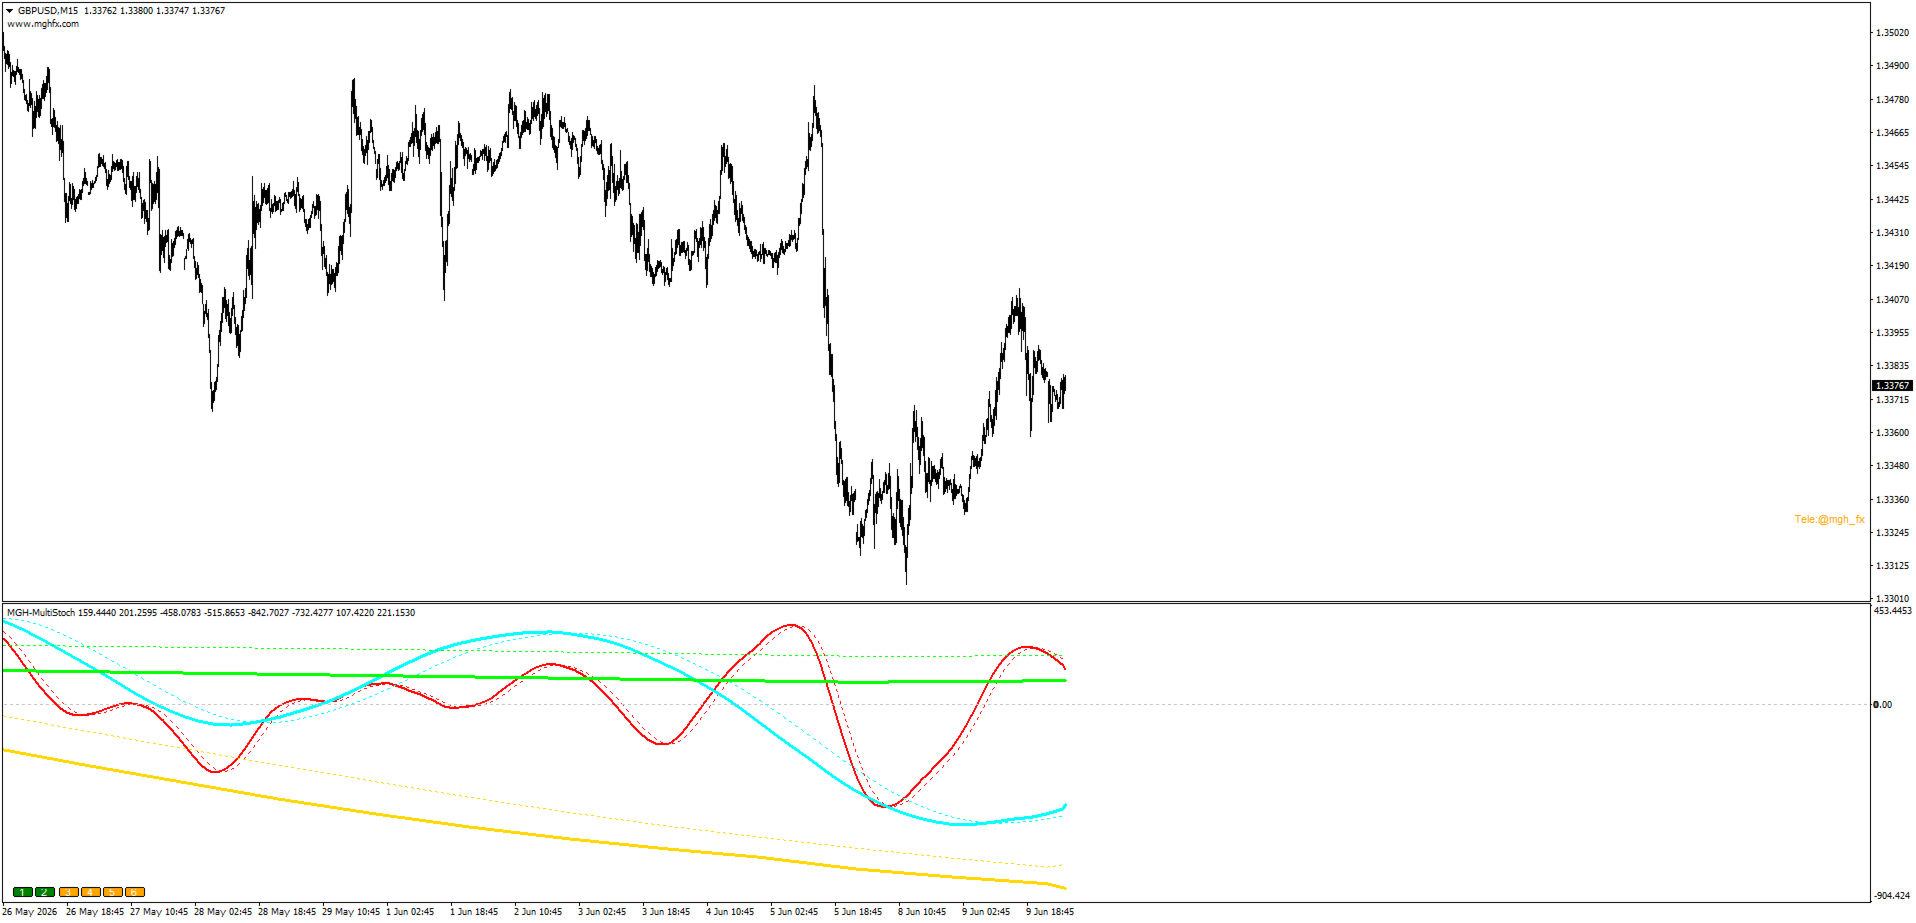
Example from the GBPNZD M15 screenshot: the red line is H1, blue is H4, yellow is Daily and green is Weekly. A new cross has formed on the Daily and Weekly lines. Since an a-b-c-d-e motive wave has completed on H1, a corrective phase on H4 can be expected, meaning a three-wave a-b-c sequence may form on H1 before the upward movement continues. The projected path in the screenshot was drawn manually to illustrate this scenario.
Note: the wave lines and labels visible in the screenshots were drawn manually to demonstrate how the indicator crosses align with wave structure and how a forward scenario can be constructed. They are not drawn automatically by the indicator.
Alerts
The alert system goes beyond a simple cross alert and can be configured in detail.
The alert fires on the current-timeframe cross and is filtered by the state of the other timeframes. For each line independently you can choose Same Direction, Opposite Direction or OFF. For example, you can receive an alert only when the current timeframe crosses upward while the green and red lines are rising and the gold line is falling.
You can select the signal candle: 0 or 1. Candle 0 gives a faster signal, while candle 1 reduces the probability of repainting. This lets you choose your own balance between speed and reliability.
Available alert types: pop-up window, sound with a selectable sound file, email and push notification.
Features
Display and timeframes:
- Up to 6 timeframes shown in one window
- TimeFrame Type: Auto for automatic adjacent-timeframe selection, or From Inputs for manual control
- Independent timeframe assignment for each of the six lines (From Inputs mode)
- Each line can be enabled or disabled with on-chart buttons or from the inputs
- The buttons can be repositioned or hidden
- Holding the cursor on a line shows its timeframe
- Interpolation option for smooth lines in multi-timeframe mode
- Adjustable number of calculated candles
Alerts:
- Direction condition per line: Same Direction, Opposite Direction or OFF
- Signal candle selection: 0 or 1
- Pop-up window, sound, email and push notification
- Selectable sound file
Other:
- Optional buy and sell arrows with configurable arrow codes
- Built for MetaTrader 5; an MetaTrader 4 version is also available
Who It Is For
- Trend traders who want higher-timeframe confirmation before entering
- Wave analysts who want a more objective way to count waves
- Reversal traders looking for early structural switch points
- System builders who need a configurable confirmation filter
Getting Started
- Attach the indicator to your working timeframe, for example M15.
- Choose the TimeFrame Type: Auto for automatic selection, or From Inputs to set each line yourself.
- In From Inputs mode, assign a 4 to 6 times series, for example M15, M30, H1, H4 and D1.
- Watch for a new cross on the highest active timeframe.
- Outline the expected wave sequence on the lower timeframes.
- Set a conditional alert that matches your scenario.
If you have questions or need help with setup, please use the Comments section of this product page.
Risk note: trading involves substantial risk. This indicator is an analysis tool and does not guarantee any trading results. Test it on a demo account first.
MT4 Version : https://www.mql5.com/en/market/product/181181


very good and usefull indicator in my trading thank u