MagicLines MT5

  • 지표
  • Mostafa Ghanbari
    Mostafa Ghanbari
    ✅ MGH Products 창립자
    ✅ 소프트웨어 엔지니어 | 맞춤형 지표 및 엑스퍼트 어드바이저(EA) 개발자
    ✅ MQL5.com 게재 저자
    안녕하세요! 저는 Mostafa입니다. 복잡한 트레이딩 전략을 고성능의 신뢰할 수 있는 도구로 변환하는 데 열정을 가진 소프트웨어 엔지니어입니다. 소프트웨어 공학의 탄탄한 학문적 배경과 수년간의 전문 프로그래밍 경험을 바탕으로, 엄격한 소프트웨어 아키텍처와 역동적인 알고리즘 트레이딩의 세계를 연결합니다.
    🛠 기술 전문성:
  • 버전: 1.1
  • 업데이트됨: 13 7월 2026
  • 활성화: 5

MGH-MagicLine — Trend & Multi-Timeframe Divergence in One Tool

MagicLine combines trend detection and divergence analysis into a single indicator — a refined alternative to running MultiStoch and MultiMACD separately, with cleaner output and less lag.

It is a confirmation and analysis tool. It does not give entry points, Take Profit or Stop Loss. Instead, it adds a strong, flexible confirmation layer that fits almost any trend-based strategy and helps you read the market with more clarity.

Three Line Modes — One Indicator

Choose the Line Type in settings; the active mode is shown directly in the indicator window name, so you always know what you are looking at:

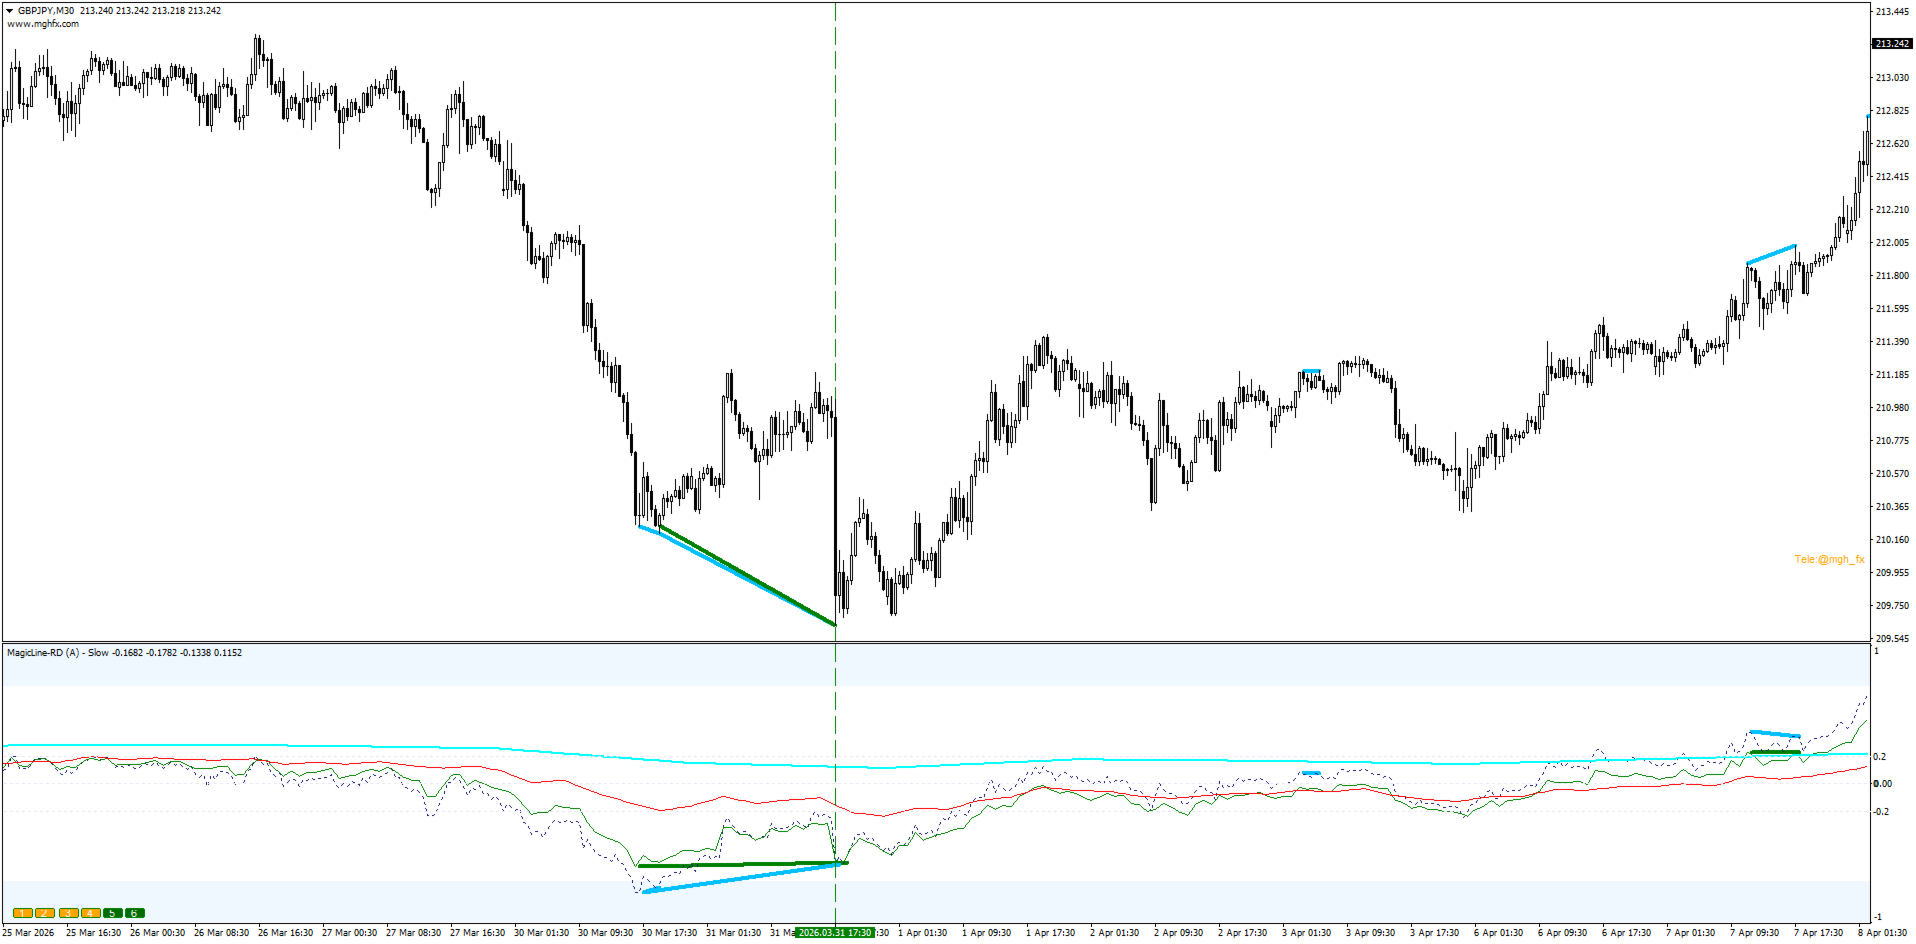
  • Slow — lowest noise, built to read the long-term trend direction. Lines reaching the ±0.2 zone confirm the dominant trend.
  • Long — clean trend detection with more responsiveness. A balanced, everyday choice.
  • Fast — quickest reaction, suited to scalping and intraday momentum.

One indicator, three distinct behaviors — adapt it to your timeframe and your style.

Multi-Timeframe Lines — Now With Full Timeframe Control (MT5)

Because MetaTrader 5 supports a wider range of timeframes than MT4, this version adds per-line timeframe selection — giving you complete control over which timeframe each line represents.

Set TimeFrame Type to choose how timeframes are assigned:

  • Auto — the indicator applies a smart neighboring-timeframe rule: each successive line is assigned a timeframe at least 3× larger than the previous one, adapting automatically to whatever chart period you are on. No manual configuration needed.
  • From Inputs — set each line's timeframe independently (L1 through L6) from a full list of MetaTrader 5 periods, from M1 all the way to Monthly.

The result: up to 6 lines, each on its own timeframe, covering exactly the multi-timeframe spread that matches your strategy — automatically or manually, your choice.

  • Hover any line to confirm its timeframe instantly.
  • Toggle each line ON/OFF with the on-chart buttons (1–6).

See the higher-timeframe picture and your entry timeframe together, in one window.

Regular & Hidden Divergence

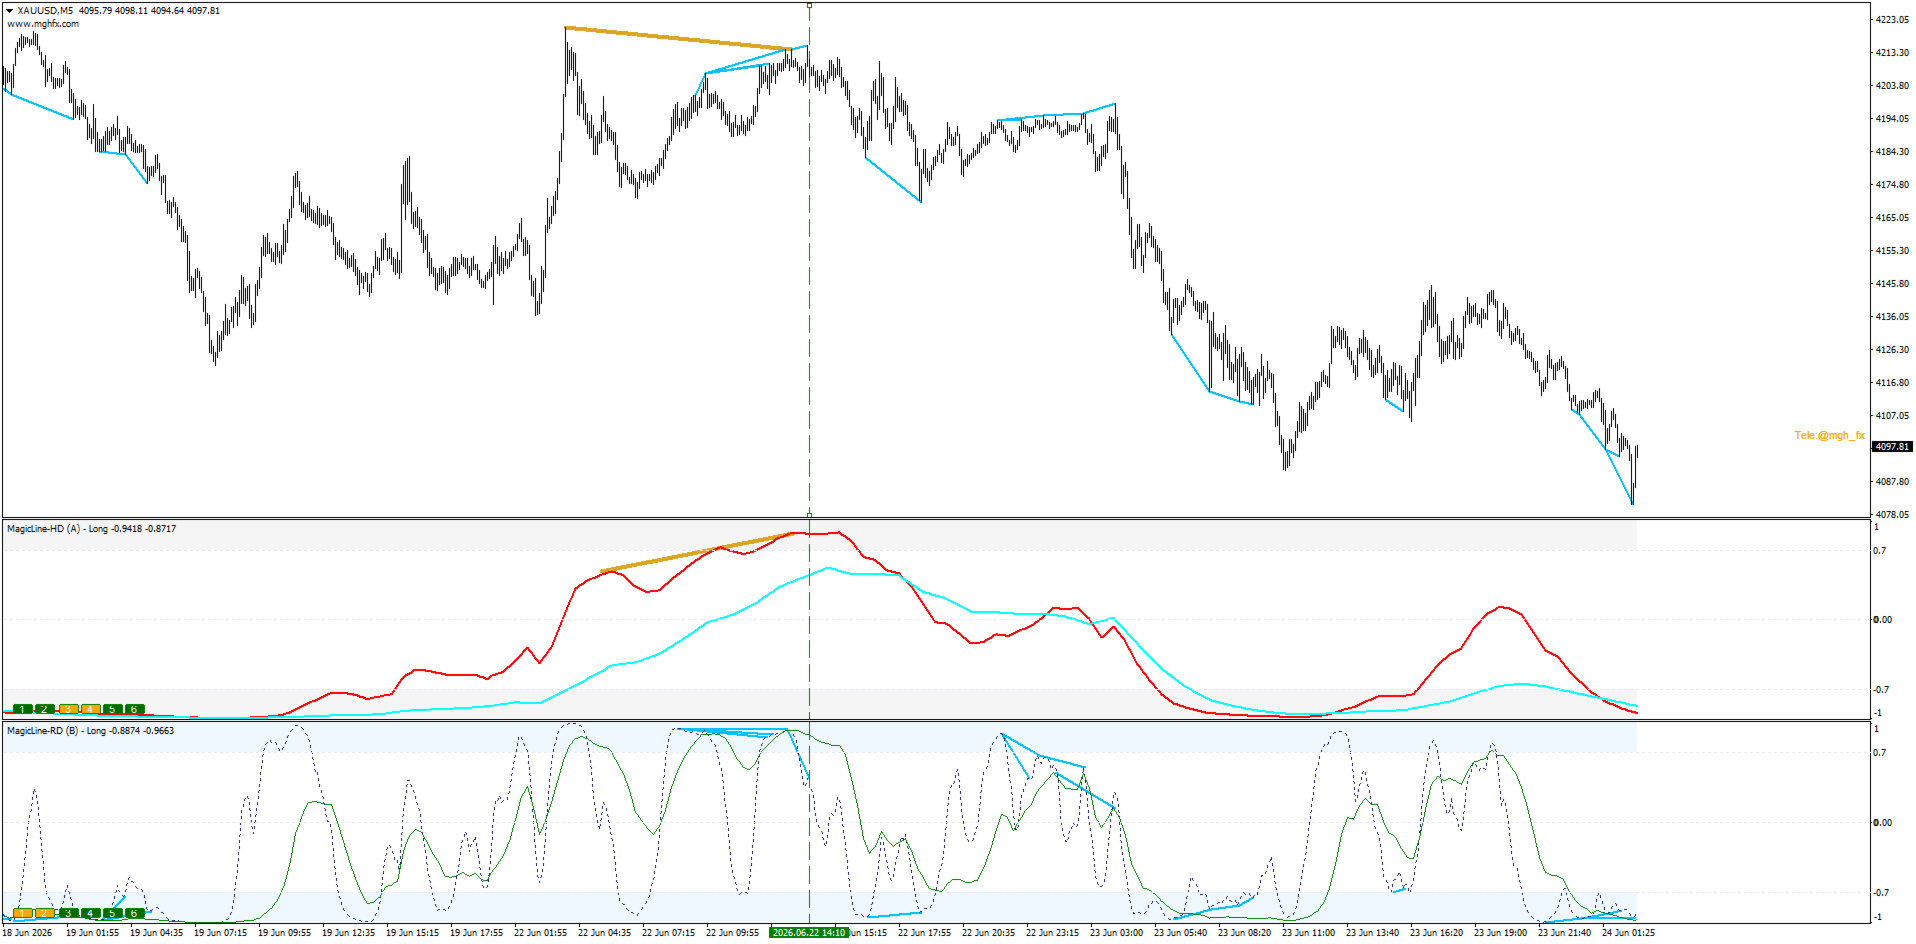
Set Divergence Type to Regular or Hidden; the mode (RD / HD) is added to the indicator name so multiple instances stay easy to identify on the same chart.

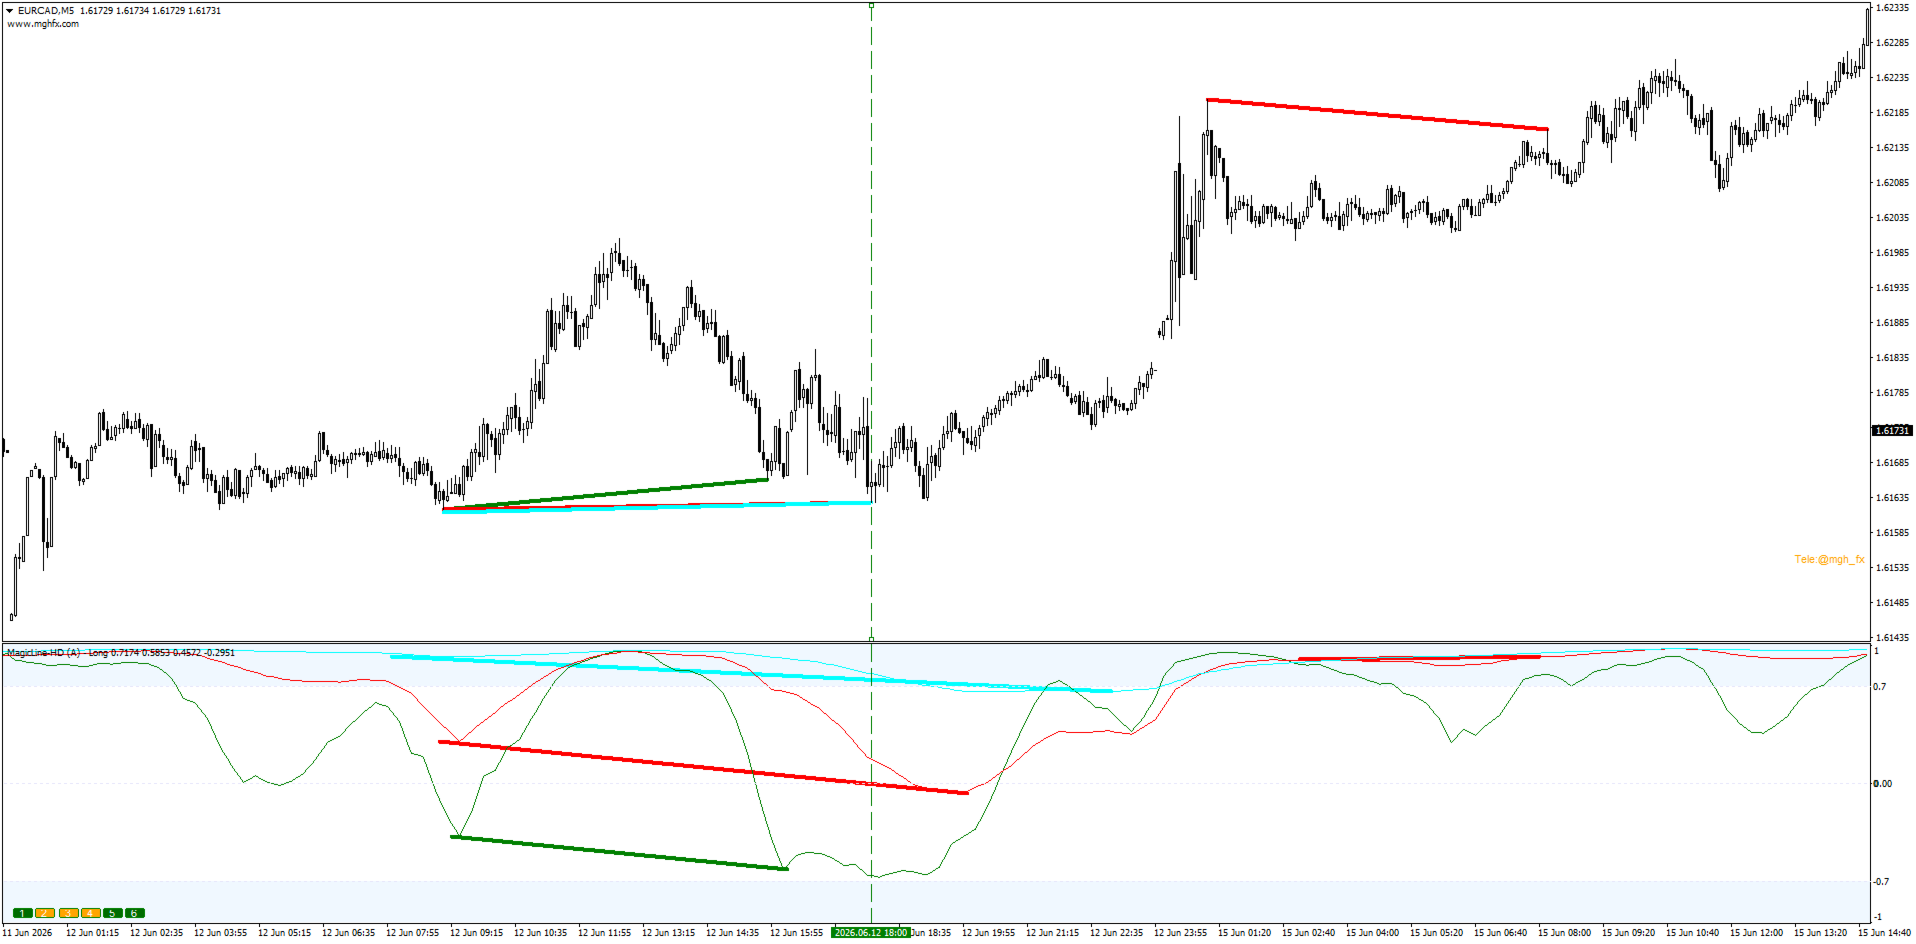
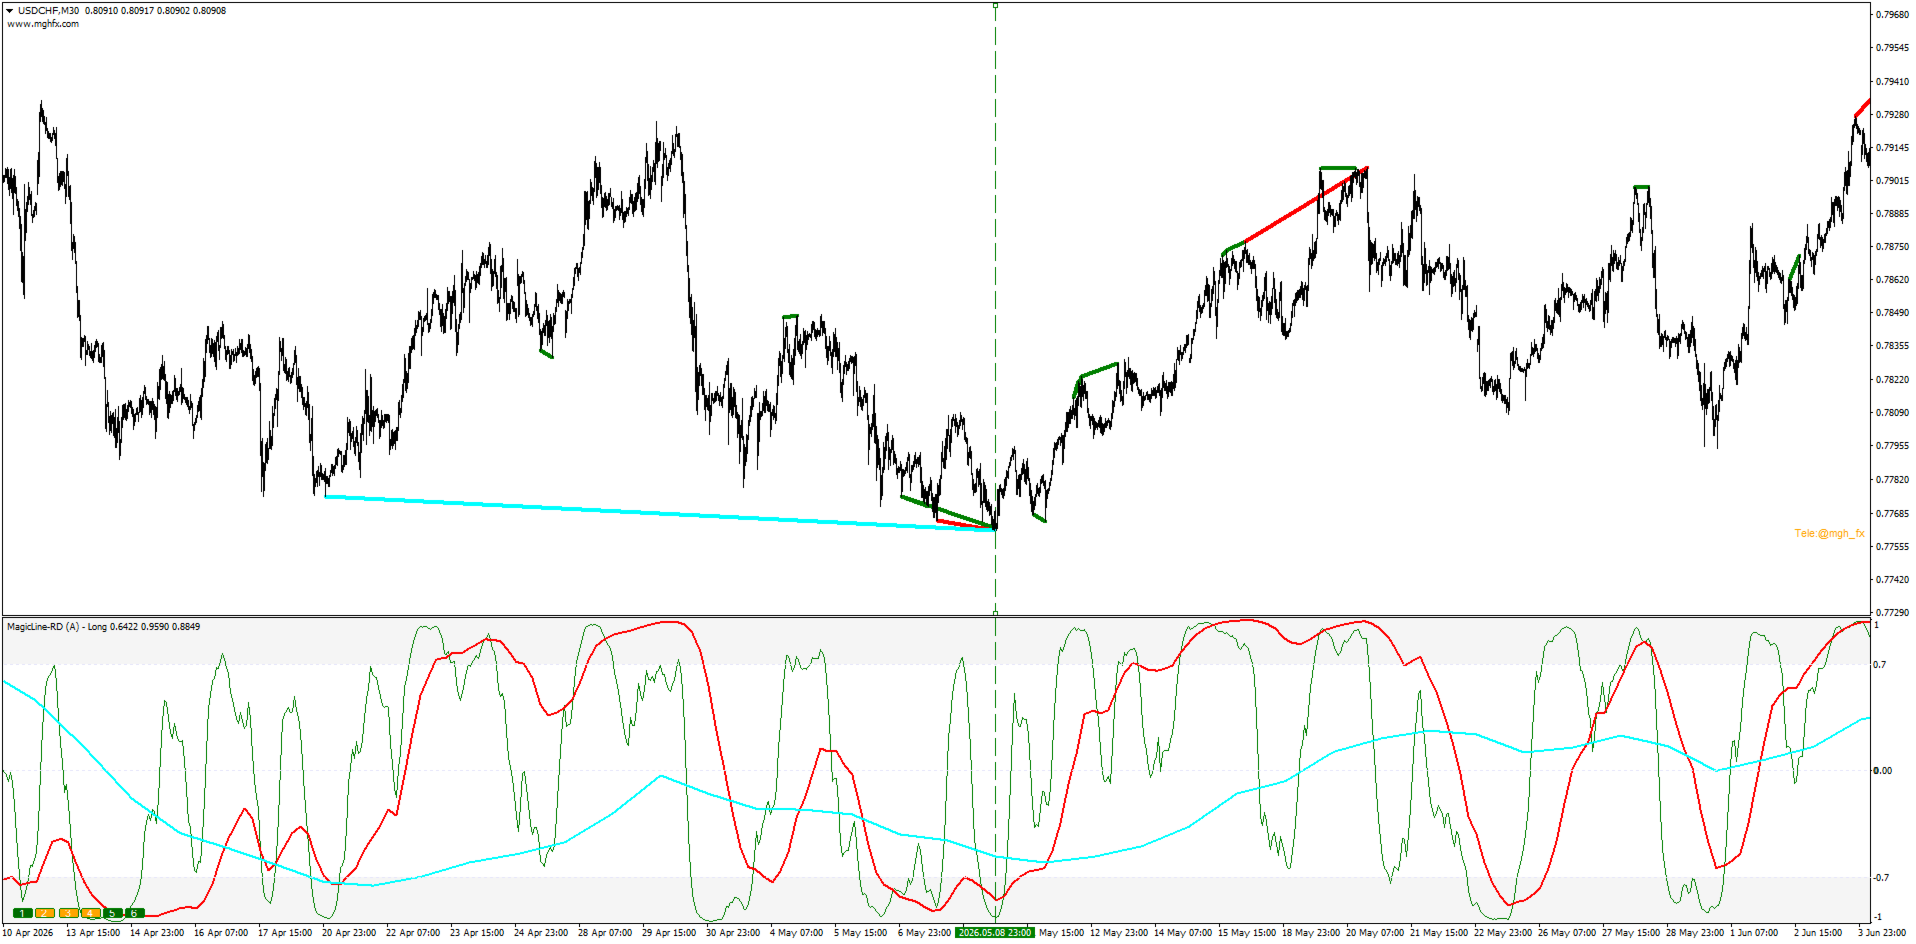
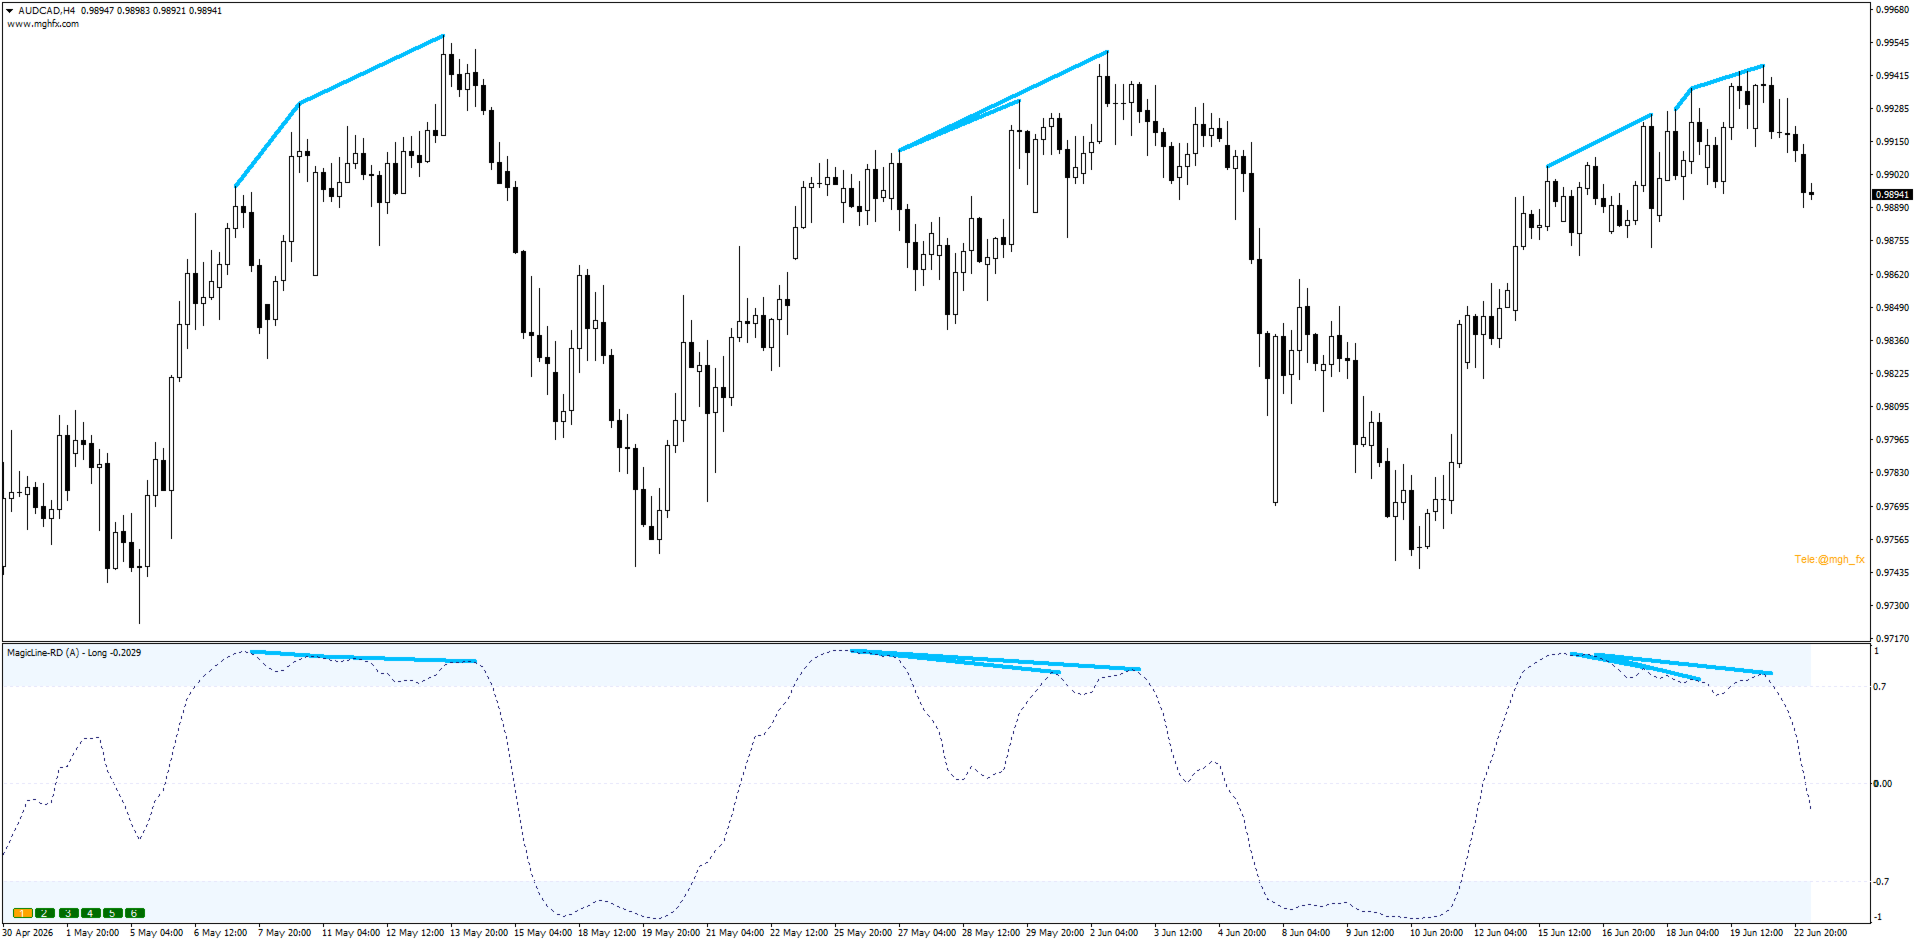
  • Regular (RD) — highlights potential reversals.
  • Hidden (HD) — highlights trend continuation.

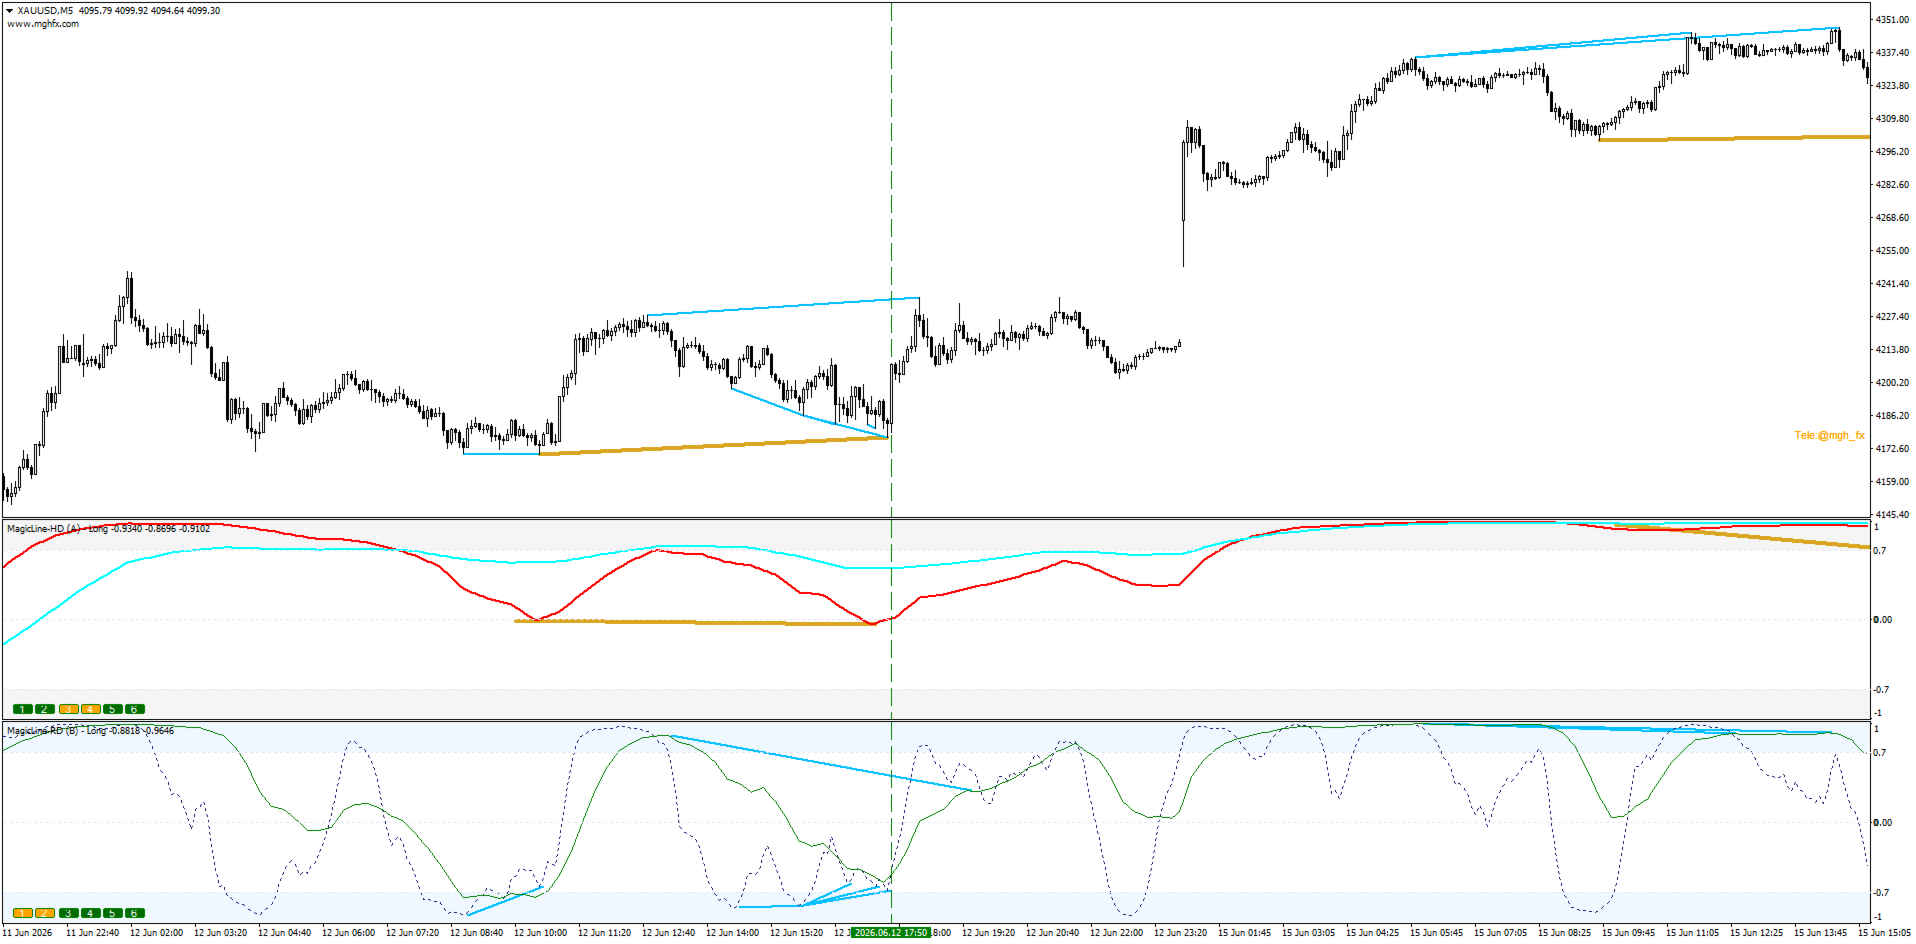
Each divergence is drawn both in the indicator window and directly on the price chart, color-coded per timeframe — no need to match peaks and troughs by eye. The Increase Divergence Range input extends detection to farther peaks and valleys for setups that are easy to miss otherwise.

Two Practical Approaches

1. Divergence stacking — multiple RD (or multiple HD) signals from different timeframes converging on the same candle, for a higher-conviction setup. The more lines that align, the stronger the picture.

2. RD + HD confluence — Hidden divergence from a higher timeframe (Daily/Weekly) for direction, combined with Regular divergence from a lower timeframe (H1/H4) for timing.

Built-In Alerts

Three independent alerts — Overbought/Oversold break, Center line break, and Divergence — delivered via popup, sound, email, or push notification, so you never have to watch the screen all day.

Input Parameters

Lines

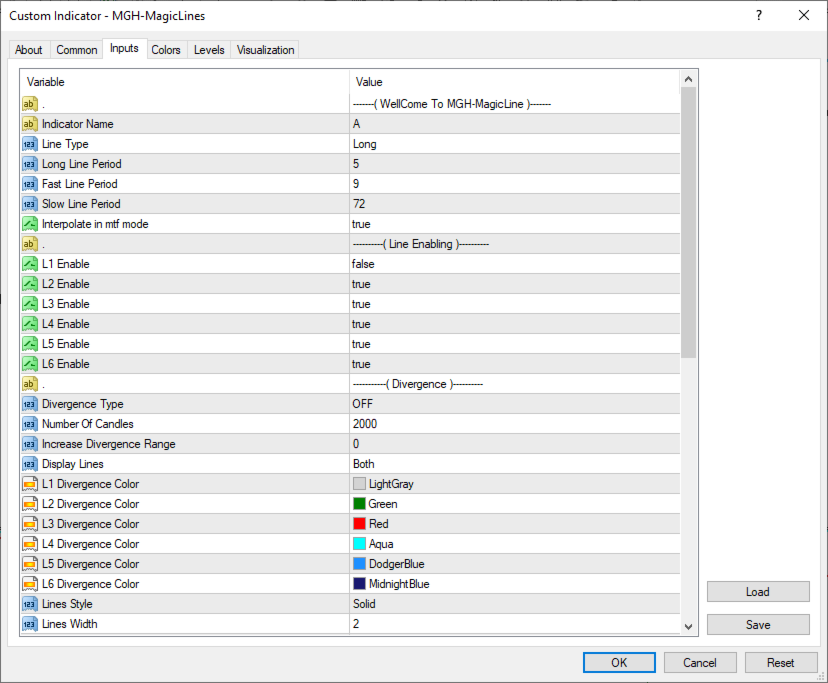
  • Indicator Name — custom label for the indicator window.
  • Line Type — Long / Fast / Slow engine selection.
  • Long / Fast / Slow Line Period — independent period for each engine.
  • Interpolate in MTF mode — smooths lines in multi-timeframe mode.
  • L1–L6 Enable — turn each of the 6 timeframe lines on or off (color shown in brackets).

Line TimeFrame (MT5 exclusive)

  • TimeFrame Type — Auto or From Inputs.
    • Auto: the indicator automatically selects neighboring timeframes following the rule that each successive timeframe is at least 3× larger than the previous one, based on your current chart period.
    • From Inputs: assign each line's timeframe manually from the full MT5 period list.
  • L1–L6 TimeFrame — active only when TimeFrame Type is set to From Inputs.

Divergence

  • Divergence Type — Regular / Hidden / OFF.
  • Number Of Candles — history depth scanned for divergence.
  • Increase Divergence Range — widens detection to farther peaks/troughs.
  • Display Lines — show divergence in the window, on the chart, or both.
  • L1–L6 Divergence Color — color per timeframe.
  • Lines Style / Lines Width — divergence line appearance.

Alerts

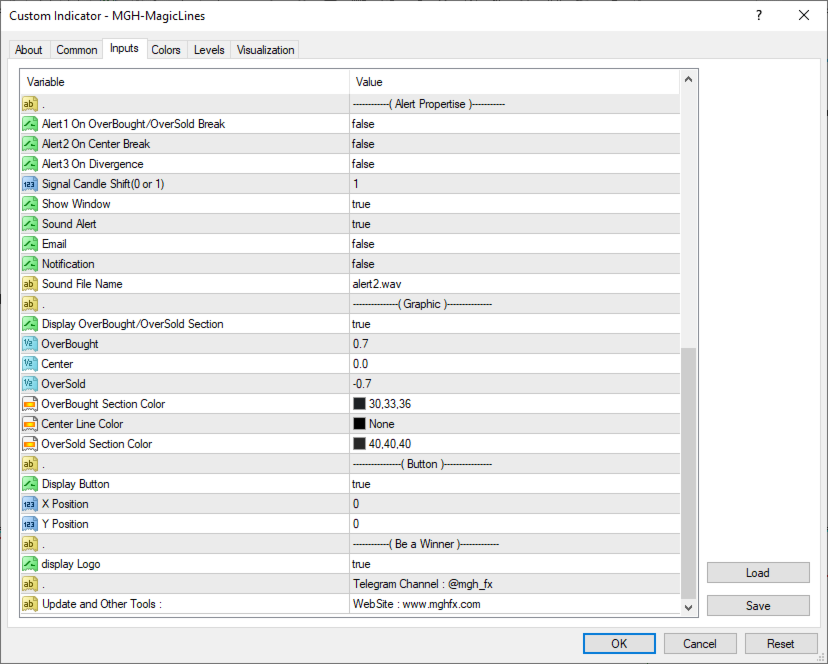
  • Alert on Overbought/Oversold Break, Center Break, Divergence — enable each independently.
  • Signal Candle Shift (0 or 1) — signal on the closed or current candle.
  • Sound / Email / Notification — choose delivery method.
  • Sound File Name — custom alert sound.

Graphic

  • Overbought / Center / Oversold — adjustable zone levels.
  • Section & Center Line Colors — visual customization.
  • Show Window, Display Button, X/Y Position — layout controls.

Important

MagicLine is a confirmation tool, not an automated strategy. It works best when combined with your own analysis and risk management. Past behavior of any indicator does not guarantee future results.

Download the demo and test MagicLine on your own charts and strategy — see how it fits before you decide.

MT4 Version: https://www.mql5.com/en/market/product/182884


If you're looking for a more automated, multi-timeframe approach built on this same divergence-detection logic, check out MGH-MagicTrigger. It scans a chain of timeframes automatically, confirms higher-timeframe divergence with matching divergence on the lower timeframes, and draws an entry trigger, stop loss, and two targets for every confirmed signal.

MagicTrigger link:

MT5: https://www.mql5.com/en/market/product/186243

MT4: https://www.mql5.com/en/market/product/186226

추천 제품
Darwin Assistant
Ramzi Abuwarda
혁신적인 MT5 지표인 DARWIN Assistant   을 소개합니다. 성공적인 거래의 세계로 가는 궁극적인 관문입니다! 정확성과 전문성으로 설계된 DARWIN Assistant   은 RSI, 스토캐스틱, CCI 및 추세와 같은 고급 기술 지표의 힘을 모든 시간대에 걸쳐 활용하는 특별한 전략에 따라 운영됩니다. 이 최첨단 지표는 진입을 위한 가장 정확한 신호를 제공하므로 비교할 수 없는 확신을 가지고 시장을 탐색할 수 있으므로 특별한 거래 경험에 대비하십시오. DARWIN 트래픽을 사용하면 가장 수익성이 높은 거래 기회를 감지할 수 있도록 세심하게 보정된 중요한 지표에 대한 포괄적인 분석에 액세스할 수 있습니다. 불확실성에 작별을 고하고 정보에 입각한 의사 결정의 새로운 시대를 맞이하십시오. RSI, Stochastics, CCI 및 Trends가 DARWIN Assistant   내에서 원활하게 수렴되어 전례 없는 시장 역학을 생생하게 보여줍니다. DARWIN Assist
Smart ATR Grid Pro
Syamsurizal Dimjati
SMART ATR GRID PRO++ – Adaptive Grid Intelligence Suite is a next-generation, institutional-grade grid trading indicator engineered for traders who demand precision, adaptability, and comprehensive market structure analysis. By seamlessly integrating   Adaptive Volatility Grid System ,   KAMA Candle Trend Filtering ,   Multi-Factor Trend Detection (ADX + EMA20/50) ,   Dynamic Heatmap Zone Engine , and   Real-Time Market Regime Classification , this indicator delivers a complete decision-making
https://youtu.be/JJanqcNzLGM ,  https://youtu.be/l70MIHaQQa4 ,  https://youtu.be/pg0oiT5_8y0   Automated Supply and Demand Trading Edge MT5. These videos demonstrate how we apply the supply and demand system to our latest trading review and market analysis Enhance your Trading Strategy with the Supply and Demand Trading Edge MT5. Gain a competitive market advantage with the Supply and Demand Trading Edge MT5 indicator, a powerful tool that combines MACD signals with supply and demand zones. By
RBreaker
Zhong Long Wu
RBreaker Gold Indicators는 금 선물을 위한 단기 데이 트레이딩 전략으로, 추세 추종과 데이 내 반전의 두 가지 거래 방식을 결합합니다. 추세 장에서 수익을 포착할 수 있을 뿐만 아니라, 시장이 반전될 때 적시에 이익을 확정하고 추세에 맞춰 반대 포지션을 잡을 수 있습니다. 이 전략은 미국 잡지 Futures Truth에서 15년 연속으로 가장 수익성 높은 트레이딩 전략 상위 10위 안에 선정되었습니다. 긴 라이프사이클을 자랑하며, 현재까지 국내외에서 널리 사용되고 연구되고 있습니다. 본 지표는 2026년 금 선물의 움직임을 반영하여 14일 ATR 지표를 기반으로 돌파 계수 A, 관찰 계수 B, 반전 계수 R을 보다 합리적인 값으로 정의했습니다. 매우 훌륭한 지표이며, 안정적인 연간 수익성을 달성했습니다. 강력히 추천합니다~ 위 지표는 변동성이 높은 상품에 적합하며, 매개변수는 금 선물, 주가 지수 선물 등에 적합합니다. 다른 상품이 필요한 경우 돌파 계수 A
Engulfing with EMAs Indicator Unlock the power of advanced candlestick pattern detection with the Engulfing with EMAs Indicator , a cutting-edge tool designed for MetaTrader 5. This futuristic indicator combines the precision of engulfing pattern analysis with the trend-following strength of Exponential Moving Averages (EMA 21 and EMA 50), empowering traders to identify high-probability setups across all currency pairs and timeframes. Key Features: Comprehensive Engulfing Detection : Detects b
한 문장으로 이해하면 이 인디케이터는 RSI와 MACD, 두 전문가를 하나로 묶은 것 입니다. 두 지표를 따로 보며 판단할 필요 없이, 둘 다 동의할 때만 "매수" 또는 "매도" 화살표를 보여줍니다. 화살표는 다시 그려지지 않습니다 . 한 번 나타나면 그 자리에 고정됩니다. "콤보"의 의미 보통 트레이더는 RSI(가격 움직임의 힘)와 MACD(추세 방향)를 따로 봅니다. 그런데 둘의 신호가 충돌할 때가 많죠. 이 인디케이터는 두 지표가 동시에 같은 방향을 가리킬 때만 신호를 냅니다 . 덕분에 가짜 신호가 훨씬 줄어듭니다. 화면에서 보이는 것 가격 차트와 분리된 인디케이터 창 파란색과 빨간색 화살표 – 바로 쓸 수 있는 매매 신호 확대된 MACD 히스토그램 (모멘텀을 쉽게 파악하도록 더 크고 선명하게 표시) RSI와 MACD 선도 함께 표시되지만, 주목할 것은 화살표 이런 분께 적합합니다 초보자 – 두 지표를 따로 해석하고 모순을 처리할 필요 없음 경험자 – 빠른 신호 필터링, 다시
Scan a fixed list of assets (Ibovespa) in the chosen timeframe (TimeFrame). For each pair and for various periods. Calculate a regression model between the two assets (and, if desired, using the bova11 index as a normalizer). Generate the spread of this relationship, its mean, standard deviation, speculative deviation, and betas (B1 and B2). Apply an ADF test without exclusion (cointegration/stationarity). Calculate the Z-score of the current exclusion (how many standard deviations are away from
FREE
MarketX Dashboard
Alexandre Vincent Traber
4 (1)
Overview MarketX Dashboard는 MetaTrader 5용 강력한 올인원 시장 분석 인디케이터입니다. 단 하나의 거래를 진입하기 전에 모든 종목의 구조, 레짐, 통계적 특성을 이해하고자 하는 트레이더를 위해 설계되었습니다. 차트 위 깔끔한 탭 인터페이스에서 모든 것을 확인할 수 있습니다. 복잡하지 않습니다. 노이즈도 없습니다. 오직 시장만 있을 뿐입니다. 대부분의 인디케이터는 진입 지점을 찾는 데 사용됩니다. MarketX Dashboard는 거래 전에 정말 중요한 질문에 답합니다: 이 시장은 지금 추세인가요, 레인지인가요, 아니면 돌파 중인가요? 이 종목에서 통계적으로 가장 가능성 높은 되돌림 수준은 어디인가요? 시장 구조는 강세인가요, 약세인가요? 어느 세션에서 이 종목의 움직임이 가장 큰가요? 4개 모듈, 4개 탭, 하나의 창. 모든 종목과 모든 시간대에서 작동합니다. How it works REGIME (레짐) 추세추종, 평균회귀, 돌파, 스캘핑 4가지 전략
FREE
SophieSMC One
Junel Abellana
SophieSMC One is a premium Smart Money Concepts indicator designed specifically for XAUUSD (Gold) traders who want a cleaner, more structured and institutional approach to the market. Built around real market structure concepts, SophieSMC One combines multiple Smart Money Concepts tools into one powerful and visually clean trading system for MetaTrader 5. FEATURES: • BOS & CHoCH market structure detection • Fair Value Gap (FVG) identification • Liquidity sweep visualization • Order Block recog
MACD Sniper Pro
Noppawat Tumjai
MACD Sniper Pro is an advanced automated trading system designed for traders seeking high-precision entries and robust risk management. By combining the classic momentum of MACD Crossover with a strict ADX Volatility Filter and Dynamic ATR Management , this EA completely eliminates emotional trading and filters out dangerous flat/sideways markets. Unlike standard MACD indicators that suffer during consolidation, MACD Sniper Pro verifies trend strength before entering and protects your capital us
SMC Institutional Suite
Catur Cipto Nugroho
SMC Institutional Suite v3.7 Professional Smart Money Concept Indicator for MetaTrader 5 What is New in Version 3.7 - Visual Stability Update This release focuses entirely on one goal: making every zone, label, and line on your chart rock-solid stable. There is no more flickering, no more zones disappearing on a new candle, and no more duplicate drawings. Order Block (OB) zones no longer flicker or disappear. Once drawn, they stay permanently on the chart. Equal Highs and Equal Lows (EQH / EQL)
MT5용 암호화폐 외환 지표 "WPR with 2 Moving Averages" (리페인트 없음) - WPR 자체는 스캘핑에 가장 적합한 오실레이터 중 하나입니다. - "WPR and 2 Moving Averages" 지표는 WPR 오실레이터의 빠른 이동평균과 느린 이동평균을 함께 보여줍니다. - 이 지표는 가격 조정을 매우 빠르게 감지할 수 있도록 도와줍니다. - 매개변수를 통해 간편하게 설정할 수 있으며, 모든 시간대에 사용 가능합니다. - 매수 및 매도 진입 조건은 그림에서 확인할 수 있습니다. - WPR MA 교차 시 PC 및 모바일 알림 기능 제공. 매수 신호 조건 예시: (1) 빠른 이동평균이 느린 이동평균을 상향 돌파하고 WPR 값이 -50 미만이면 매수 진입. (2) WPR 값이 -20 이상으로 과매수 영역에 진입하면 매수 포지션 청산. 매도 신호 조건 예시: (1) 빠른 이동평균이 느린 이동평균을 하향 돌파하고 WPR 값이 -50 이상이면 매도 진입. (2) -
Meta Trend PRO MT5
Roman Podpora
5 (1)
메타 트렌드 프로       — 는 추세 추종 도구로, 거래에서 추측을 배제하고 시장이 이미 결정을 내린 지점을 보여줍니다. 이 지표는 추세, 추세선 및 구조가 변화하는 주요 지점을 식별하고 주요 참여자들이 포지션을 취할 수 있도록 가격이 되돌아오는 영역을 강조합니다. 단순히 가격 움직임만 보는 것이 아니라, 그 이면에 숨겨진 논리까지 이해할 수 있습니다. 모든 신호는 캔들 마감 후 기록되며, 다시 그려지지 않고 차트에 저장되므로 상황을 확실하게 분석하고 결정을 내릴 수 있습니다. 거래 목표(이익 실현) 또한 표시됩니다. 이 지표의 효과에 대해 완벽한 확신을 가지실 수 있도록 자동 통계 자료를 제공해 드립니다. 방향 전환 후에는 손절매 수준과 해당 수준이 지능적으로 점진적으로 이동하는 모습(Move SL)을 표시해주는데, 이는 매우 중요합니다.       감소시킨다       위험       위치별로. 손절매/이익실현/RR 오른쪽에 내장된 패널은 현재 글로벌 추세 방향의 시장 진입
Cumulative Volume Delta MA-X MTF (Gradient Momentum 포함) 이 지표는 MetaTrader 5를 위한 다중 타임프레임(MTF) 누적 거래량 델타(CVD) 분석을 수행합니다. 틱 데이터 또는 리얼 볼륨 데이터를 분석하여 매수 압력과 매도 압력 사이의 순 차이를 계산함으로써, 오더 플로우의 심리 상태를 시각적으로 표현합니다. 지표 로직 및 주요 기능 본 지표는 다음과 같은 수학적 접근 방식을 통해 거래량을 분석합니다. 데이터 소스: 거래소 자산의 리얼 볼륨(Real Volume)과 외환(Forex)/CFD를 위한 OHLC 윅 프록시(OHLC Wick Proxy) 계산 방식을 모두 지원합니다. 그라데이션 시스템: 4색 이동평균선이 다음과 같이 추세 단계를 식별합니다. DeepSkyBlue(하늘색): 양수 값, 상승 중. Orange(오렌지색): 양수 값, 하락 중. Magenta(자주색): 음수 값, 하락 중. Purple(보라색): 음수 값, 상
Radar Trade Analytic
Jeverson Rodrigues Ferreira
Radar Trade Analytic 2.0 – MT5용 퀀트 패널 Radar Trade Analytic란? Radar Trade Analytic는 Radar Trade 생태계의 퀀트(정량 분석) 모듈입니다. 메인 차트 아래 별도의 창에서 열리며, 동일한 독자적인 Sigma 엔진으로 구축된 네 개의 동기화된 레이어를 표시합니다. 이를 통해 차트에서 보이는 것과 패널에서 읽는 것 사이의 직접적인 대응 관계를 보장합니다. 매수/매도 신호가 없습니다. 목표가도 없습니다. 알림도 없습니다. Radar Trade Analytic는 정말 중요한 데이터만 정리하여 명확하게 판단할 수 있도록 돕습니다. 2.0 버전에서 달라진 점 # 개선 사항 이전 버전 (1.00) 2.0 버전 1 Delta Flow (CVD) M1 캔들만 사용하여 계산(하위 타임프레임 추정치) TICK_FLAG_BUY/SELL 플래그가 포함된 틱 기반의 실제 공격성 델타 — 전문 플랫폼과 동일한 데이터 사용 2
GDS Renko Entry Helper - Free Renko Price Interaction Indicator for MetaTrader 5 GDS Renko Entry Helper is a free Renko price interaction indicator for MetaTrader 5. It helps traders highlight important areas where price reacts, slows down, returns to a zone or changes behavior around support and resistance. The tool is designed for manual Renko analysis. It does not generate buy or sell signals and does not tell the trader when to enter the market. Its purpose is to help focus attention on area
Dynasty SMC/ICT Terminal — v3.0 "Neon-Ops Edition" An all-in-one Smart Money Concepts / ICT dashboard for MetaTrader 5. It's an indicator, not an auto-trading EA — it never places, modifies, or closes real orders. It scans price action for Order Blocks, Fair Value Gaps, market structure, harmonic patterns, and multi-timeframe momentum, blends everything into one calibratable Master Signal, and — if enabled — builds a fully automated on-chart trade plan with entry, stop loss, three take-profit ta
GDS Renko Pip ST Chart - Pip-Based Renko Chart Indicator for MetaTrader 5 GDS Renko Pip ST Chart is a pip-based Renko chart indicator for MetaTrader 5. It helps traders build and study cleaner Renko price movement using a practical fixed pip or point-based brick structure. This tool is designed as a Renko chart foundation for manual analysis. It does not predict the market, does not generate buy or sell signals and does not decide whether a trade should be opened. Renko EDGE EA Golden Delta | A
Structure King AI Signal
Shingala Gautamkumar
Structure King AI Signal Structure King AI Signal is a professional MetaTrader 5 trading indicator designed to help traders analyze market structure, trend direction, multi-timeframe confirmation and trade management from one clean dashboard. Key Features • Market Structure & Trend Analysis • BUY / SELL Signals • Multi-Timeframe (HTF) Confirmation • Entry Price Levels • Dynamic Stop Loss (SL) • TP1 / TP2 / TP3 Levels • ATR Volatility Analysis • ADX Trend Strength Filter • Adaptive Market Filter
Premium level Pro
Dmitriy Kashevich
Premium level is a unique indicator with more than 80% accuracy of correct predictions! This indicator has been tested for more than two months by the best Trading Specialists! The author's indicator you will not find anywhere else! From the screenshots you can see for yourself the accuracy of this tool! 1 is great for trading binary options with an expiration time of 1 candle. 2 works on all currency pairs, stocks, commodities, cryptocurrencies Instructions: As soon as the red arrow app
FiveStarFX Gold Reversal Edge Professional automated trading solution designed for structured execution and controlled risk management in the Gold market. Built for traders who value discipline, precision, and consistency. Key Features Fully automated trading One trade at a time (controlled exposure) Fixed Stop Loss and Take Profit Smart Break-Even protection Profit lock with buffer Step-based trailing management Spread protection system Works on any broker Trade Management The E
FREE
Noize Absorption Index
Ekaterina Saltykova
Noize Absorption Index - is the manual trading system that measures the difference of pressure between bears forces and bulls forces. Green line - is a noize free index that showing curent situation. Zero value of index shows totally choppy/flat market.Values above zero level shows how powerfull bullish wave is and values below zero measures bearish forces.Up arrow appears on bearish market when it's ready to reverse, dn arrow appears on weak bullish market, as a result of reverse expectation.
HAWK 4.0 — GOLD SIGNAL INDICATOR The most precise signal indicator  for XAUUSD (Gold) trading. Built on ATR Bands + Pivot detection. Signals appear only at real reversal points. No repaint. No delay. No noise. WHAT YOU GET → Clear BUY / SELL arrows → Auto TP1 / TP2 / TP3 levels → Auto SL level → Built-in time filter (UTC) → Real-time success statistics → Full alert system DESIGNED FOR Symbol:    XAUUSD (Gold) Timeframe: M3 / M5 Ses
Tudas by Argus DOWN
Yevhen Hladchenko
Part 2 — Bottom Indicator: TudasDownCombined.mq5 2.1 Money Flow Price is rising, but money is actually leaving the asset — you can't see this in the candles, and the move dies right after you enter, because there's no real buyer behind it. Money Flow shows the intensity of capital entering and leaving the asset, before this shows up in price, not after. The line is smoothed through a cascade of EMAs to strip out small-player noise and show the direction the big players are setting. Flow rising
Has rsi signal
Evgenii Savinov
HAS RSI Signal — SL/TP 자동 계산 기능이 포함된 전문 트렌드 지표 HAS RSI Signal 은 검증된 클래식 지표와 현대적인 노이즈 필터링 알고리즘을 결합한 강력한 트레이딩 도구입니다. 이 지표는 Heiken Ashi Smoothed (HAS) 캔들과 RSI 오실레이터를 통해 시장을 분석하며, 추세 반전이나 과매수/과매도 구간 이탈 시 트레이더에게 명확한 진입 신호를 제공합니다. 주요 장점: 이중 필터링: Heiken Ashi Smoothed를 사용하여 시장의 '노이즈'를 제거하고, RSI를 통해 모멘텀의 강도를 확인합니다. 자동 레벨 계산: 단순히 신호만 주는 것이 아니라, 변동성( ATR )을 기반으로 최적의 손절매(Stop Loss) 및 이익 실현(Take Profit) 레벨을 자동으로 계산합니다. 시각적 편의성: 신호가 차트 위에 컬러 캔들 형태로 직접 표시되어 복잡하지 않고 직관적으로 추세를 파악할 수 있습니다. 알림 시스템: 터미널 알람, 사운드, 스마
CyberTradeTHxAI Gold Sniper MT5 Professional Gold Trading Signal Indicator for MetaTrader 5 CyberTradeTHxAI Gold Sniper MT5 is a professional-grade Gold (XAUUSD) trading indicator developed to identify high-probability Buy and Sell opportunities using trend analysis, pullback confirmation, and intelligent market structure detection. Designed for both beginner and advanced traders, the indicator automatically calculates optimal Entry Zones, Stop Loss, and multiple Take Profit levels while provid
이 지표를 구매하시면 ICT Concept MT5 또는 다른 원하시는 지표를 무료로 받으실 수 있습니다! 자세한 내용은 개인 메시지로 문의해 주세요! 인디케이터: Currency Strength Meter Pro 시장 전반 시각화 (Market Breadth Visualization) 장점: 복잡한 차트 대신 깔끔한 "대시보드" 형태로 표시하여, 어떤 통화쌍이 강세인지 약세인지 한눈에 파악할 수 있습니다. 이점: 차트를 하나씩 확인하는 시간을 줄이고 매매할 통화쌍을 빠르게 결정할 수 있습니다. 자동 순위 및 정렬 (Auto-Ranking & Sorting) 장점: "수평 순위" 모드를 통해 "가장 강한" 통화쌍부터 "가장 약한" 통화쌍까지 자동으로 정렬합니다. 이점: 일간/주간/월간의 승자(Winners)와 패자(Losers)를 즉시 식별할 수 있어 상대 강도 전략에 유리합니다. 스마트 통화 로직 (Smart Currency Logic) 장점: 기준 통화(Base Currency
IPDA and PD Ranges
Thank-god Avwerosuoghene Odukudu
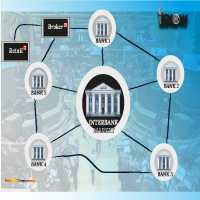
IPDA AND PD RANGES. Interbank Price Delivery Algorithm (IPDA) Range Liquidity and trades in the FX market take place in a decentralized manner as banks, brokers and electronic communication networks (ECNs) interact with one another to set prices. In FX, and ECN is a trading platform or electronic broker that hosts bids and offers and transmit them to users worldwide. ECN broadcasts a price around the world as various participants leave orders to buy and sell. Banks provide streaming prices base
Advanced Trading Chaos
Sergei Gurov
5 (1)
Advanced Trading Chaos  The main purpose of the indicator is to help the trader detect the signals described by Bill Williams in his books to make a quick and correct trading decision. 1)Bullish/Bearish Reversal Bar(BDB) 2) Divergent Bar(DB) 3) Second Sage Signal — the third consecutive Awesome Oscillator bar  4) Working fractals (Fractals that worked above/below the red forehead  5) Three bar coloring modes 5.1) Coloring of bars according to the AO indicator (Including the squatting bar) 5.2
이 제품의 구매자들이 또한 구매함
Meravith Scanner
Ivan Stefanov
5 (3)
MERAVITH SCANNER는 MetaTrader 5용 전문 금융 시장 지표로, 여러 분석 도구를 하나의 통합 시스템으로 결합합니다. 독점적인 거래량 가중 평균 가격(VWAP) 방법론을 사용하여 모든 계산을 자동으로 수행하며, 주관적인 해석을 완전히 배제합니다. 이 지표는 모든 자산 클래스(Forex, 주식, 지수, 상품, 암호화폐)와 M1부터 월간 차트까지 모든 시간 프레임에서 작동합니다. 기본 원리는 “가격은 거래량을 따른다”입니다. MERAVITH는 기관 거래량이 집중되는 위치를 식별하고, 그 집중에서 수학적으로 정확한 가격 수준을 도출합니다. 예측이나 투기를 하지 않으며, 계산만 수행합니다. MERAVITH SCANNER를 사용하면 28개의 주요 Forex 통화쌍을 모든 시간 프레임에서 단 2~3분 만에 스캔할 수 있습니다. 또한 원하는 시장을 스캔할 수도 있으며, 예를 들어 약 100개의 주식을 약 10분 안에 스캔할 수 있습니다. 지표는 소진 레벨, 균형선, 편차, 통계
Meravith MT5
Ivan Stefanov
5 (3)
MERAVITH는 MetaTrader 5용 멀티 타임프레임 거래량·유동성 지표로, 모든 타임프레임에서 추세, 지지와 저항 구간, 진입, 목표, 손절을 보여줍니다. 시장의 완전한 유동성 지도, 헤지펀드 스타일의 유동성 도구를 제공하며, 자체 거래량 가중 평균 가격 방식으로 모든 계산을 자동으로 수행하므로 주관적인 해석이 없습니다. 외환, 금(XAUUSD), 지수, 암호화폐에서 작동하며, 모든 타임프레임에서 사용할 수 있습니다. 구매 후 보너스: MERAVITH로 거래하는 방법에 대한 동영상 강의 모음. 구매 후 저에게 메시지를 보내주세요. MERAVITH의 기능 모든 타임프레임을 분석하고 각 타임프레임에서 현재 유효한 추세를 보여줍니다. 유동성 구간(Volume Equilibrium)을 표시합니다. 상승 거래량과 하락 거래량이 같아지는 지점입니다. 모든 타임프레임의 유동성 레벨을 차트에 직접 표시합니다. 참고용으로 시장의 텍스트 분석을 작성합니다. 현재 추세를 기준으로 진입, 목표,
This indicator automatically detects internal & swing market structure, Fibonacci Retracement and Fibo Levels. Features Full internal & swing market structure labeling in real-time Fibonacci Retracement Fibonacci Levels After purchasing the indicator, the full source code is provided, and via indicator buffers it can be easily integrated into your Expert Advisors (EAs) for automated trading strategies.
First time on MetaTrader, introducing IQ Star Lines, an original Vedic Astrology Based Intraday Trading Indicator. We don't offer free or bonus indicators in exchange of reviews from you. You won't need any free products with this indicator to make it work. ;) Enjoy! Welcome to the new and updated  IQ Star Lines , the ultimate fusion of ancient planetary cycles and modern quantitative trading, published for the first time on Metatrader. This is an indicator built by the developer, who has spent
ORB Seeker MT5
Marcela Goncalves De Oliveira
한정 수량 판매 및 제품 희소성 유지를 위한 특별 가격입니다! 단돈 599달러! 구매 후 저에게 연락 주시면 보너스 ORB Seeker EA와 개인 최적화 설정 파일을 보내드립니다. 깔끔한 세션 브레이크아웃을 자신감 있게 활용하세요! ORB Seeker MT5는 정확성, 단순성, 유연성 및 명확한 차트 구조를 원하는 트레이더를 위해 개발된 전문적인 시가 범위 돌파(ORB) 지표입니다. 이 프로그램은 모든 금융 상품에 대해 장전 거래 또는 사용자 지정 세션 범위를 자동으로 표시하고, 진입, 손절매, 목표 수익 및 선택적으로 50% 부분 목표 수익 수준을 포함한 명확한 돌파 신호를 제공합니다. 모든 계산은 실시간으로 차트에 직접 표시됩니다. 런던 개장, 뉴욕 세션, 아시아 세션 또는 사용자 지정 시장 시간대를 선택하여 거래하세요. ORB Seeker MT5는 사용자가 선택한 세션 시간에 맞춰 작동하므로 시장 범위, 돌파 레벨 및 거래 레벨을 정확하게 확인할 수 있습니다. 모든 구매
KenKem Master Volume Profiler - Brief Introduction A Display-only volume-profile cockpit for XAUUSD, BTCUSD and other liquid symbols. Draws profile structure, multi-timeframe flow, EMA trend and study-only setup markers. Places no orders. Not a signal service.  It maps where the market has actually traded and reads recent order flow, so you can see structure and lean at a glance.  What it shows: Master and local volume profiles (POC and value-area high/low) - the price shelves that matter. A liv
Navigator Equilibrium: 시장 국면, 모멘텀, 피크, 다이버전스를 하나의 창에서 모멘텀 오실레이터, 추세 필터, 변동성 지표, 다이버전스 스캐너를 오가며 확인할 필요가 없습니다. Navigator Equilibrium은 이 모두를 색상으로 구분되는 하나의 창에 담았습니다. 모멘텀이 강해지는지 약해지는지, 누가 주도권을 쥐고 있는지, 시장이 추세 중인지 횡보 중인지, 그리고 가격과 모멘텀이 어디서 엇갈리는지를 한눈에 확인할 수 있습니다. 시장을 명확하게 읽고 싶은 재량 트레이더와, 깔끔하고 문서화된 버퍼가 필요한 EA 개발자를 위해 만들었습니다. 차별점 상승 또는 하락만 보여 주는 것이 아닌, 다섯 가지 상태의 히스토그램. 방향뿐 아니라 모멘텀이 강해지는지, 약해지는지, 과도하게 늘어난 피크 상태인지를 색상으로 보여 줍니다. 시장 상태를 알려 주는 제로 라인. 색이 바뀌면서 시장이 추세 중인지 횡보 중인지 알려 줍니다. "누가 주도하는가"를 한눈에. 히스토그램 막대 위
Transaction Speed MT5
Ivan Stefanov
5 (4)
이 지표는 시장에서 관심이 나타나는 영역 을 강조 표시한 후, 주문이 누적되는 영역 을 보여줍니다. 이는 **대규모 오더북(호가창)**처럼 작동합니다. 이것은 거대한 자금 을 위한 인디케이터입니다. 성능은 탁월하며, 시장에서 어떤 관심이 있든 반드시 포착할 수 있습니다 . (이것은 완전히 새로 작성되고 자동화된 버전 입니다 – 이제 수동 분석은 필요하지 않습니다.) **거래 속도(Transaction Speed)**는 새로운 개념의 인디케이터로, 시장에 대규모 주문이 언제, 어디에 쌓이는지를 보여주며 , 그 이점을 분석합니다. 매우 초기 단계에서 트렌드 전환 을 감지할 수 있습니다. FX 시장에서 흔히 사용하는 "거래량(volume)"은 오해입니다. 실제로는 시간당 가격 변화량 이므로, 올바른 용어는 거래 속도 입니다. 우리가 어떻게 사고하고, 행동하며, 분석하느냐 가 가장 중요합니다. 분석 패러다임의 전환 은 필수적입니다. 이 인디케이터는 외환 시장에서의 볼륨 개념을 논리적으로
TrendMaestro5
Stefano Frisetti
note: this indicator is for METATRADER4, if you want the version for METATRADER5 this is the link:  https://www.mql5.com/it/market/product/108106 TRENDMAESTRO ver 2.5 TRENDMAESTRO recognizes a new TREND from the start, he never makes mistakes. The certainty of identifying a new TREND is priceless. DESCRIPTION TRENDMAESTRO identifies a new TREND in the bud, this indicator examines the volatility, volumes and momentum to identify the moment in which there is an explosion of one or more of these da
Historical Similarity Matcher Indicator (HI.SI.MA) Try it free today — demo version now available!   https://www.mql5.com/en/market/product/167114 Overview The Historical Similarity Matcher is a technical analysis indicator for MetaTrader 5. It scans historical price data to find segments that show statistical similarity to a user-selected reference period on the chart.
시장이 진짜로 무엇을 하고 있는지 보십시오.   세 가지 시장 국면(수축, 확장, 추세)을 눈앞에서 실시간으로 지켜보고, 추세 국면의 초기 단계에서 더 나은 진입을 잡으십시오.   추측을 멈추십시오. 기관과 스마트 머니가 하는 것처럼 시장을 읽기 시작하십시오.   MT5용 Apex Market Structure Pro는 노이즈를 걷어내고 모든 캔들 아래에 있는 진짜 구조를 보여 주는 정밀 스마트 머니 분석 도구입니다.   유동성, 구조 전환, 매집 구간, 추세 편향을 하나의 깔끔하고 전문적인 오버레이에 담았습니다. 후행 지표에 지쳐 명확함으로 매매할   준비가 된 진지한 트레이더를 위해 만들어졌습니다.      중요: 이 지표는 Heikin Ashi(하이킨 아시) 캔들에서 작동하도록 설계되었습니다. 사용 전 차트를 Heikin Ashi로 설정하여 그 잠재력을   온전히 끌어내십시오. 모든 분석은 Heikin Ashi 가격 흐름을 중심으로 설계되었습니다. Apex Market S
Title:FX-AIEA Supply and Demand Zone Indicator (MT5) — Technical Overview Version: 2.51 | Platform: MetaTrader 5 Introduction Supply and demand zones are considered a core manifestation of institutional order flow, providing a more direct reflection of buying and selling pressure than traditional support/resistance levels. This indicator attempts to automate the identification of high-probability supply and demand zones using an adaptive ZigZag algorithm, reducing the subjectivity and time asso
Footprint is an indicator for order flow and volume analysis. It helps identify market structure at the cluster level, find key zones with increased activity, and work with filters directly on the chart without constantly opening the settings window. Footprint Indicator Features cluster-based Bid x Ask and Delta charts; on-chart control panel; sliders for filter adjustments; Absorption; Initiative; Stacked Imbalances; Big Trades; dPOC / Dynamic Point of Control; Delta; side market profile; cumul
Zain Gold ScalpingV5
Ahmed Gamal Abdel Nasser Mohamed
Zain Gold Scalping V5 is a technical analysis indicator for MetaTrader 5 designed for Forex and Gold markets. It provides chart-based market information, trend analysis, signal conditions, and an on-screen dashboard to help traders analyze price movement across multiple timeframes. Main Features The indicator supports multiple timeframes, including M1, M5, M15, M30, H1 and higher timeframes. It can be used with Gold (XAUUSD), Forex currency pairs, indices and other supported instruments. The in
Boom & Crash & PainX & GainX Ultimate Spike Detector Trade Spikes With Confidence — Not Guesswork Catching spikes should be one of the most profitable strategies in synthetic markets. But for most traders, it becomes one of the most frustrating. You enter too early… price goes against you. You wait for a spike… it never comes. You finally catch one… but don’t know whether to hold or close. You make profit… then give it all back because there’s no exit plan. This is exactly the problem the Ultim
OrderFlow Absorption – MT5용 전문 델타 & 흡수 신호 인디케이터 OrderFlow Absorption으로 진정한 오더플로우 분석의 힘을 경험하세요. MetaTrader 5를 위한 궁극의 델타 히스토그램 및 흡수 신호 인디케이터입니다. 가격 움직임의 이면에서 실제로 무슨 일이 일어나는지 알고 싶은 트레이더를 위해 설계된 이 도구는, 시장을 움직이는 숨겨진 매수/매도 압력과 흡수 이벤트를 드러냅니다. 주요 기능 델타 히스토그램 시각화:   매수와 매도 압력을 색상별 히스토그램으로 즉시 확인할 수 있습니다. 흡수 신호 감지:   고급 로직으로 강세 및 약세 흡수 이벤트를 식별하여 반전 신호를 미리 알려줍니다. 차트 마커:   흡수 신호가 차트에 직접 표시되어 시각적으로 쉽게 확인할 수 있습니다. 팝업 알림:   새로운 흡수 신호가 발생하면 실시간으로 알림을 받을 수 있습니다. 사용자 지정 임계값:   약한 신호는 필터링하고, 확률이 높은 기회에 집중할 수 있습니다.
VTrende Pro
Andrii Diachenko
5 (1)
VTrende Pro - MTF indicator for trend trading with a display panel for MT5 *** Videos can be translated into any language using subtitles (video language - Russian) Although the signals of the VTrende Pro indicator can be used as signals of a full-fledged trading system, it is recommended to use them in conjunction with the Bill Williams TS. VTrende Pro is an extended version of the VTrende indicator. Difference between Pro version and VTrende: - Time zones - Signal V - signal 1-2 waves -    S
PrimeScalping
Temirlan Kdyrkhan
PrimeScalping is a powerful trading companion designed to generate high-probability entry signals with dynamic TP/SL/DP levels based on volatility. Built-in performance tracking shows win/loss stats, PP1/PP2 hits, and success rates — all updated live. Key Features: Buy/Sell signals with adaptive volatility bands Real-time TP/SL/DP levels based on ATR Built-in MA Filter with optional ATR/StdDev volatility Performance stats panel (Success, Profit/Loss, PP1/PP2) Alerts via popup, sound, push, or e
MasterTrend
Temirlan Kdyrkhan
MasterTrend Indicator for MT5 A powerful trend-following and signal-evaluation tool MasterTrend   is a custom MT5 indicator that combines Moving Averages and ATR-based risk/reward logic to generate clear buy/sell signals. It visualizes dynamic SL/TP levels, evaluates past trade outcomes, and displays win/loss statistics in a clean on-chart panel. Key features include: Buy/Sell signals based on MA crossovers ATR-based SL/TP1/TP2/TP3 levels with visual lines and labels Signal outcome tracking wit
Volality 75 Boom crash VIX
Cristofher Robles
4.5 (2)
Volatility 75 Boom Crash VIX Pro V2 Volatility 75 Boom Crash VIX Pro V2 is a high-performance trading indicator specifically engineered for Synthetic Indices (Deriv) and Forex . This tool focuses on identifying institutional liquidity zones and generating high-accuracy, non-repainting signals based on Price Action and Fibonacci levels. Key Advantages: No Repainting: Once a signal arrow appears and the candle closes, it will never move or disappear. Institutional Liquidity Zones: Automatically ca
SMC Sweep Fvg MT5
Daniil Sleptsov
5 (1)
SMC Sweep Fvg MT5 — 스마트 머니처럼 시장을 보세요, 차트 위에서 바로 이런 경험, 알고 계실 겁니다. 가격이 스톱을 훑고, 돌아서, 기대했던 방향으로 그대로 갑니다. 방향은 맞았습니다. 틀린 것은 진입뿐이었습니다. 이 지표는 그런 일이 덜 일어나도록 만들어졌습니다. 분석에서 가장 무거운 부분—차트 마킹—을 대신하고, 진짜 중요한 것인 결정은 당신에게 남깁니다. 차트에서 보이는 것 시장 구조 — 실제 구조적 고점·저점에 HH / HL / LH / LL 라벨과 레벨 라인. 추측 없이 추세가 바로 보입니다. 불균형 구간(FVG) — 가격이 너무 빠르게 지나갔고 나중에 자주 되돌아오는 영역. 열린 구간과 이미 메워진 구간은 다른 색으로 표시됩니다. 유동성 행동 — 반전 전에 시장이 레벨을 훑는 순간을 추적합니다. 완성된 트레이드 레이아웃 — 진입 화살표, 손절 레벨, 이익 목표. 모두 그려져 있어 머릿속 계산이 필요 없습니다. 추세 필터 — 상위 타임프레임 라인으로
==================================================================== SMC Pro v6.1 APEX AI — XAUUSD Gold Empire MetaTrader 5 지표 · Smart Money Concepts · 예측 인텔리전스 엔진 ==================================================================== SMC Pro v6.1 APEX AI는 MetaTrader 5의 XAUUSD(골드) 전용으로 제작된 전문 Smart Money Concepts 지표 시스템입니다. 완전한 SMC 프레임워크 — Order Blocks, Liquidity sweeps(유동성 스윕), Fair Value Gaps, Break of Structure, Change of Character — 에 AI 기반의 8개 신규 모듈을 결합하여, 정밀한 시각적 신호, 예측 궤적선, 색상으로 구분된 SL/T
" Blow It Up!" - The Trading Indicator That Questions Your Life Choices Tired of boring indicators? Meet your new market companion that delivers: "YOLO BUY!" arrows when you should probably panic Explosive rectangle confetti (because why not?) 200+ soul-crushing quotes like "Your stop loss is imaginary" and "This is n't trading, it's donating to whales" Random alerts that roast your strategy This Indicator is lik e Therapy - Because daytrading shouldn't fe el like watching paint dry! Highlights
TraderHUD
Justino Porto Neto
5 (1)
TraderHUD v2 — 전문 트레이더를 위한 완벽한 대시보드 TraderHUD v2 는 MetaTrader 5용 가장 완벽한 시각적 지표의 진화 버전입니다. 트레이더가 더 현명한 결정을 내리기 위해 차트에서 봐야 할 모든 것을 하나의 도구에 통합합니다: 시간적 맥락, 달러 강도, 통계적 범위, 피벗 레벨, 움직임 속도, 매크로 트렌드 — 모두 통합되고 설정 가능하며 차트를 어지럽히지 않습니다. 이 버전은 실제 라이브 트레이딩 사용 경험을 바탕으로 제작되었으며, 명확한 철학을 따릅니다: 더 많은 맥락, 더 적은 노이즈 . v2의 새로운 기능 8개 모듈을 단일 지표로 완전 통합 DayRange와 DollarFlow가 자동 연결된 설정 가능한 사이드 패널 정시 표시와 함께 시장 세션 마킹 레벨 간 평균선 옵션이 있는 클래식 피벗 포인트 베타로 표시된 두 개의 실험적 모듈: 변동성 및 매크로 트렌드 평균 완전히 설정 가능한 레이아웃 — 코너, 너비, 색상 및 글꼴 모듈 타이머 및 스
XCalper TFO
Aecio de Feo Flora Neto
This oscillator was developed exclusively by xCalper in 2015 based on moving averages calculations to indicate and try predicting oversold and overbought levels. The fast line (white, by default) oscillates basically between values -0.5 (oversold) and +0.5 (overbought). Whenever this line crosses upward value -0.5, it means an oversold price level. When it crosses downward value +0.5, it means an overbought price level. When fast line crosses value 0.0 and returns, it is a strong pull-back indic
Pan PrizMA CD Phase
Aleksey Panfilov
The Expert Advisor and the video are attached in the Discussion tab . The robot applies only one order and strictly follows the signals to evaluate the indicator efficiency. Pan PrizMA CD Phase is an option based on the Pan PrizMA indicator. Details (in Russian). Averaging by a quadric-quartic polynomial increases the smoothness of lines, adds momentum and rhythm. Extrapolation by the sinusoid function near a constant allows adjusting the delay or lead of signals. The value of the phase - wave s
Классификатор силы тренда. Показания на истории не меняет. Изменяется классификация только незакрытого бара. По идее подобен полной системе ASCTrend, сигнальный модуль которой, точнее его аппроксимация в несколько "урезанном" виде, есть в свободном доступе, а также в терминале как сигнальный индикатор SilverTrend . Точной копией системы ASCTrend не является. Работает на всех инструментах и всех временных диапазонах. Индикатор использует несколько некоррелируемых между собой алгоритмов для класси
FFx Universal Strength Meter PRO is more than a basic strength meter. Instead of limiting the calculation to price, it can be based on any of the 19 integrated strength modes + 9 timeframes. With the FFx USM, you are able to define any period for any combination of timeframes. For example, you can set the dashboard for the last 10 candles for M15-H1-H4… Full flexibility! Very easy to interpret... It gives a great idea about which currency is weak and which is strong, so you can find the best pai
The FFx Universal MTF alerter shows on a single chart all the timeframes (M1 to Monthly) with their own status for the chosen indicator. 9 indicators mode (MACD-RSI-Stochastic-MA-ADX-Ichimoku-Candles-CCI-PSAR). Each can be applied multiple times on the same chart with different settings. Very easy to interpret. Confirm your BUY entries when most of the timeframes are showing green color. And confirm your SELL entries when most of the timeframes are showing red color. 2 Alert Options : input to s
제작자의 제품 더 보기
MagicTrigger MT4
Mostafa Ghanbari
MagicTrigger — 멀티 타임프레임 HD/RD 다이버전스 확인 인디케이터 MagicTrigger는 상위 타임프레임(HD)에서 구조적 다이버전스를 찾고, 동일한 가격대 내 하위 타임프레임(RD)에서 일치하는 다이버전스로 확인되기를 기다리는 멀티 타임프레임 다이버전스 엔진입니다. 상위 타임프레임의 스윙 구조와 하위 타임프레임의 확인이 일치할 때만 인디케이터는 신호를 표시하며, 이와 함께 권장 진입 트리거, 손절 라인, 두 개의 목표 라인을 제공합니다. 작동 방식 인디케이터는 현재 차트 기간을 기준으로 상위 및 하위 타임프레임의 체인을 스캔합니다. 상위 타임프레임에서는 가격 스윙과 평활화된 오실레이터 라인 사이의 다이버전스 패턴("HD" 다이버전스)을 찾습니다. 이후 HD 구조로 정의된 시간 및 가격대 내에서 하위 타임프레임에서도 동일한 방향의 다이버전스("RD" 다이버전스)가 나타나는지 확인합니다. 신호는 필요한 최소 개수의 하위 타임프레임이 상위 타임프레임 구조를 확인했을 때만
Unlock the power of "Psychological Numbers" with RoundLevel . Large financial institutions, banks, and hedge funds don't place orders at random prices; they prefer round numbers (e.g., 1.1000, 105.00, 2000). These levels act as invisible magnets for price action, serving as high-probability support and resistance zones. Key Features: Universal Compatibility: Works perfectly on Forex, Gold (XAUUSD), Indices, and Stocks. Clean Visualization: Automatically draws horizontal levels without cluttering
Persian Ichimoku Pro: The Fibonacci Evolution for MT4 Why settle for 1930s formulas when you can trade with 21st-century precision? Most traders fail with Ichimoku because they use static, outdated settings.   Persian Ichimoku Pro   breaks these limits by integrating   Advanced Fibonacci Mathematics   and the exclusive   Future Quality Line —a combination never seen before in standard indicators. ### THE "UNFAIR ADVANTAGE": WHAT’S INSIDE? 1. The Quality Line (Your Trend Sentinel) This is the "S
Cross Alert MT4
Mostafa Ghanbari
MGH-CrossAlert — Multi-Line, Multi-Timeframe Crossover Alert Indicator MGH-CrossAlert is a crossover detection indicator for MetaTrader 5 that monitors two user-selected lines and generates alerts when they cross or reach equality. Unlike standard moving average crossover tools, this indicator supports a wide range of line types and allows each line to be drawn from an independent timeframe. Supported Line Types Each of the two monitored lines can be configured independently as one of the follo
Overview MGH-CrossAlert Histogram is a sub-window histogram indicator for MetaTrader 5. It displays the relationship between any two configurable lines as a color-coded histogram bar by bar, showing which line is dominant, how large the gap between them is, and when a crossover occurs. The histogram runs in a separate sub-window, keeping the price chart uncluttered. How It Works Each bar on the histogram reflects the live relationship between the two selected lines: Green — Line 1 is above Line
Multi Macd RD MT4
Mostafa Ghanbari
Overview MGH-MultiMACD-RD is a multi-timeframe MACD divergence indicator for MetaTrader 4. It monitors up to 6 timeframes simultaneously on a single chart, detects both regular and hidden divergences, and delivers alerts when a divergence is confirmed. The indicator was developed to address three common limitations found in standard MACD divergence tools: single-timeframe analysis, signal repainting, and inconsistent divergence line drawing. Key Features Multi-Timeframe Analysis The indicator di
Multi Macd HD MT4
Mostafa Ghanbari
Multi-Timeframe MACD Hidden Divergence Detector The trend continuation signal most traders never see — now detected automatically across 6 timeframes. Overview Regular divergence tells you when a trend may be reversing. Hidden divergence tells you when it is about to continue — and it is the signal that professional trend-following traders rely on most. The problem is that hidden divergence is significantly harder to spot than regular divergence, and virtually no indicator on MQL5 Market detect
Multi Stoch MT4
Mostafa Ghanbari
MGH-MultiStoch — Multi-Timeframe Trend Detection and Wave Analysis MGH-MultiStoch is a multi-timeframe trend indicator that displays up to 6 timeframes simultaneously in one window. It helps traders confirm trend direction across timeframes, count market waves visually, and build forward-looking wave scenarios based on higher-timeframe crosses. The indicator uses a custom multi-timeframe calculation method developed specifically for this product. It is available for both MetaTrader 4 and MetaTra
MagicLines MT4
Mostafa Ghanbari
MGH-MagicLine — Trend & Multi-Timeframe Divergence in One Tool MagicLine combines trend detection and divergence analysis into a single indicator — a refined alternative to running MultiStoch and MultiMACD separately, with cleaner output and less lag. It is a confirmation and analysis tool . It does not give entry points, Take Profit or Stop Loss. Instead, it adds a strong, flexible confirmation layer that fits almost any trend-based strategy and helps you read the market with more clarity. Thre
Elevate your trading with the precision of "Big Figures." Financial markets are not driven by random numbers; they are driven by institutional liquidity. Central banks, hedge funds, and major commercial traders consolidate their orders at whole integer levels (e.g., 1.1000, 2000.00, 150.00). These are the "Psychological Magnets" where the real price action happens. RoundLevel Pro for MetaTrader 5 is a high-performance tool designed to visualize this invisible grid of institutional interest with
Persian Ichimoku Pro: The Fibonacci Evolution for MT5 Why settle for 1930s formulas when you can trade with 21st-century precision? Most traders fail with Ichimoku because they use static, outdated settings. Persian Ichimoku Pro breaks these limits by integrating Advanced Fibonacci Mathematics and the exclusive Future Quality Line —a combination never seen before in standard indicators. ### THE "UNFAIR ADVANTAGE": WHAT’S INSIDE? 1. The Quality Line (Your Trend Sentinel) This is the "Secret Sauce
Cross Alert MT5
Mostafa Ghanbari
MGH-CrossAlert — Multi-Line, Multi-Timeframe Crossover Alert Indicator MGH-CrossAlert is a crossover detection indicator for MetaTrader 5 that monitors two user-selected lines and generates alerts when they cross or reach equality. Unlike standard moving average crossover tools, this indicator supports a wide range of line types and allows each line to be drawn from an independent timeframe. Supported Line Types Each of the two monitored lines can be configured independently as one of the follo
Overview MGH-CrossAlert Histogram is a sub-window histogram indicator for MetaTrader 5. It displays the relationship between any two configurable lines as a color-coded histogram bar by bar, showing which line is dominant, how large the gap between them is, and when a crossover occurs. The histogram runs in a separate sub-window, keeping the price chart uncluttered. How It Works Each bar on the histogram reflects the live relationship between the two selected lines: Green — Line 1 is above Line
Multi Macd RD MT5
Mostafa Ghanbari
Overview MGH-MultiMACD-RD is a multi-timeframe MACD divergence indicator for MetaTrader 5. It monitors up to 6 timeframes simultaneously on a single chart, detects both regular and hidden divergences, and delivers alerts when a divergence is confirmed. The indicator was developed to address three common limitations found in standard MACD divergence tools: single-timeframe analysis, signal repainting, and inconsistent divergence line drawing. Key Features Multi-Timeframe Analysis The indicator di
Multi Macd HD MT5
Mostafa Ghanbari
Multi-Timeframe MACD Hidden Divergence Detector The trend continuation signal most traders never see — now detected automatically across 6 timeframes. Overview Regular divergence tells you when a trend may be reversing.   Hidden divergence tells you when it is about to continue   — and it is the signal that professional trend-following traders rely on most. The problem is that hidden divergence is significantly harder to spot than regular divergence, and virtually no indicator on MQL5 Market det
Multi Stoch MT5
Mostafa Ghanbari
MGH-MultiStoch — Multi-Timeframe Trend Detection and Wave Analysis (MT5) MGH-MultiStoch is a multi-timeframe trend indicator that displays up to 6 timeframes simultaneously in one window. It helps traders confirm trend direction across timeframes, count market waves visually, and build forward-looking wave scenarios based on higher-timeframe crosses. This is the MetaTrader 5 version. Because MT5 supports a wider range of timeframes, this version adds full per-line timeframe selection, so you ca
MagicTrigger MT5
Mostafa Ghanbari
MagicTrigger — 멀티 타임프레임 HD/RD 다이버전스 확인 인디케이터(MT5 에디션) MagicTrigger는 상위 타임프레임(HD)에서 구조적 다이버전스를 찾고, 동일한 가격대 내 하위 타임프레임(RD)에서 일치하는 다이버전스로 확인되기를 기다리는 멀티 타임프레임 다이버전스 엔진입니다. 상위 타임프레임의 스윙 구조와 하위 타임프레임의 확인이 일치할 때만 인디케이터는 신호를 표시하며, 이와 함께 권장 진입 트리거, 손절 라인, 두 개의 목표 라인을 제공합니다. 이 MetaTrader 5 에디션은 표준 기간 외에도 M2, M3, M4, M6, M12, M20, H2, H3, H6, H8, H12를 포함한 MT5에서 사용 가능한 전체 기간 범위를 사용하여 타임프레임 체인을 구성합니다. 인디케이터가 적용된 타임프레임에 따라 스캔 체인은 최대 15개의 타임프레임을 포함할 수 있으며, 이는 표준 MT4 기간 세트만으로 구성된 체인보다 훨씬 더 세밀한 멀티 타임프레임 구조 뷰를 제공
필터:
zahra g.h
161
zahra g.h 2026.07.29 09:14 

사용자가 평가에 대한 코멘트를 남기지 않았습니다

Ashkan
167
Ashkan 2026.07.26 18:12 

사용자가 평가에 대한 코멘트를 남기지 않았습니다

Ali Ghandi
129
Ali Ghandi 2026.07.25 02:07 

사용자가 평가에 대한 코멘트를 남기지 않았습니다

aretrader
15
aretrader 2026.07.24 01:03 

사용자가 평가에 대한 코멘트를 남기지 않았습니다

Mostafa Ghanbari
3572
개발자의 답변 Mostafa Ghanbari 2026.07.24 03:23
Great to hear! Glad the multi-timeframe approach is proving both useful and profitable for you 🙏
mohsen yari
108
mohsen yari 2026.07.23 06:34 

사용자가 평가에 대한 코멘트를 남기지 않았습니다

Mostafa Ghanbari
3572
개발자의 답변 Mostafa Ghanbari 2026.07.24 03:22
Really glad to hear that! Appreciate you finding it profitable in your trading 🙏
Mahmoudrezakheiri
168
Mahmoudrezakheiri 2026.07.23 06:16 

사용자가 평가에 대한 코멘트를 남기지 않았습니다

Mostafa Ghanbari
3572
개발자의 답변 Mostafa Ghanbari 2026.07.24 03:22
Thank you so much! Glad the crossover signals from the magic lines are working well for your trades 🙏
Mehdi Saberi
88
Mehdi Saberi 2026.07.22 13:49 

사용자가 평가에 대한 코멘트를 남기지 않았습니다

Mostafa Ghanbari
3572
개발자의 답변 Mostafa Ghanbari 2026.07.24 03:21
Great to hear! Glad the trend and divergence analysis is coming through clear without crowding the chart, and that the Fast/Long/Slow modes plus alerts are working well as confirmation for your trend strategies 🙏
Hossein Nabi
168
Hossein Nabi 2026.07.22 11:26 

사용자가 평가에 대한 코멘트를 남기지 않았습니다

Mostafa Ghanbari
3572
개발자의 답변 Mostafa Ghanbari 2026.07.24 03:21
Really appreciate that! Glad the effort is coming through as useful for you 🙏
mehdi emrahpour
99
mehdi emrahpour 2026.07.21 16:33 

사용자가 평가에 대한 코멘트를 남기지 않았습니다

Mostafa Ghanbari
3572
개발자의 답변 Mostafa Ghanbari 2026.07.24 03:20
Glad to hear that! 🙏
Parsaei
164
Parsaei 2026.07.21 13:53 

사용자가 평가에 대한 코멘트를 남기지 않았습니다

Mostafa Ghanbari
3572
개발자의 답변 Mostafa Ghanbari 2026.07.24 03:19
Really glad to hear that! Appreciate you finding it valuable across the board 🙏
Mohammad panahi
169
Mohammad panahi 2026.07.20 18:23 

사용자가 평가에 대한 코멘트를 남기지 않았습니다

Mostafa Ghanbari
3572
개발자의 답변 Mostafa Ghanbari 2026.07.21 02:59
Really appreciate that! Glad it's running smoothly and delivering exactly the functionality you needed 🙏
Ben_Ns
164
Ben_Ns 2026.07.19 21:09 

사용자가 평가에 대한 코멘트를 남기지 않았습니다

Mostafa Ghanbari
3572
개발자의 답변 Mostafa Ghanbari 2026.07.20 02:42
Thank you so much! Really glad it's delivering exactly what you needed. Appreciate the recommendation 🙏
aminaran
168
aminaran 2026.07.19 18:45 

사용자가 평가에 대한 코멘트를 남기지 않았습니다

Mostafa Ghanbari
3572
개발자의 답변 Mostafa Ghanbari 2026.07.20 02:41
Thank you so much for the kind words! Glad the creativity behind it stood out to you 🙏
mahagh59
15
mahagh59 2026.07.19 18:33 

사용자가 평가에 대한 코멘트를 남기지 않았습니다

Mostafa Ghanbari
3572
개발자의 답변 Mostafa Ghanbari 2026.07.20 02:40
Thank you so much for these heartfelt words! Really appreciate your kindness and support. Wishing you all the best in your trading journey 🙏
alisaadat
167
alisaadat 2026.07.19 17:49 

사용자가 평가에 대한 코멘트를 남기지 않았습니다

Mostafa Ghanbari
3572
개발자의 답변 Mostafa Ghanbari 2026.07.20 02:40
Thank you! 🙏
ems ri
170
ems ri 2026.07.19 16:38 

사용자가 평가에 대한 코멘트를 남기지 않았습니다

Mostafa Ghanbari
3572
개발자의 답변 Mostafa Ghanbari 2026.07.20 02:39
Thank you for the thoughtful and balanced feedback! Glad it's simplifying your market analysis and helping you stay focused on decisions. Completely agree — it's meant to complement a solid strategy, not replace it. Appreciate you seeing it as a useful addition to your toolkit 🙏
Vahid Sadeghi
160
Vahid Sadeghi 2026.07.19 14:59 

사용자가 평가에 대한 코멘트를 남기지 않았습니다

Mostafa Ghanbari
3572
개발자의 답변 Mostafa Ghanbari 2026.07.20 02:39
Thank you so much for this fantastic review! It's incredibly rewarding to hear that the setup was quick and the charts stayed clean while the signals proved reliable right from the start. Catching a clean win on BTCUSD M15 so early on is a great sign, and it's exactly the kind of consistency we aim for with MagicLine. Boosting trading confidence is really the core goal behind this tool, so knowing it's already making a difference for you means a lot. Wishing you continued success and many more solid trades ahead 🙏
alifakhroddin
105
alifakhroddin 2026.07.19 14:41 

사용자가 평가에 대한 코멘트를 남기지 않았습니다

Mostafa Ghanbari
3572
개발자의 답변 Mostafa Ghanbari 2026.07.20 02:36
Thank you so much! 🙏
HAMED HAJI AHMADI
149
HAMED HAJI AHMADI 2026.07.19 09:07 

사용자가 평가에 대한 코멘트를 남기지 않았습니다

Mostafa Ghanbari
3572
개발자의 답변 Mostafa Ghanbari 2026.07.20 02:35
Thank you so much, glad it was helpful 🙏
Shayan Navidi
88
Shayan Navidi 2026.07.19 07:41 

사용자가 평가에 대한 코멘트를 남기지 않았습니다

Mostafa Ghanbari
3572
개발자의 답변 Mostafa Ghanbari 2026.07.20 02:34
Thank you so much for the thoughtful review! Really glad the multi-timeframe trend and divergence analysis is coming through clean and clutter-free on your charts 🙏
12
리뷰 답변