Cross Alert MT4
- インディケータ
- バージョン: 1.0
- アクティベーション: 5

MGH-CrossAlert — Multi-Line, Multi-Timeframe Crossover Alert Indicator
MGH-CrossAlert is a crossover detection indicator for MetaTrader 5 that monitors two user-selected lines and generates alerts when they cross or reach equality. Unlike standard moving average crossover tools, this indicator supports a wide range of line types and allows each line to be drawn from an independent timeframe.
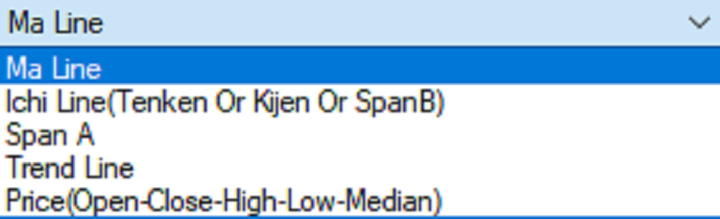
Supported Line Types
Each of the two monitored lines can be configured independently as one of the following:
- Moving Average (Simple, Exponential, Smoothed, or Linear Weighted)
- Ichimoku component: Tenkan-sen, Kijun-sen, Span A, Span B, or Chikou Span
- Composite Ichimoku lines: Tenkan+17 (shifted forward 17 candles), Quality Line, or Direction Line
- A customizable trend line drawn directly on the price chart
- Raw price (Open, High, Low, Close, or Median)
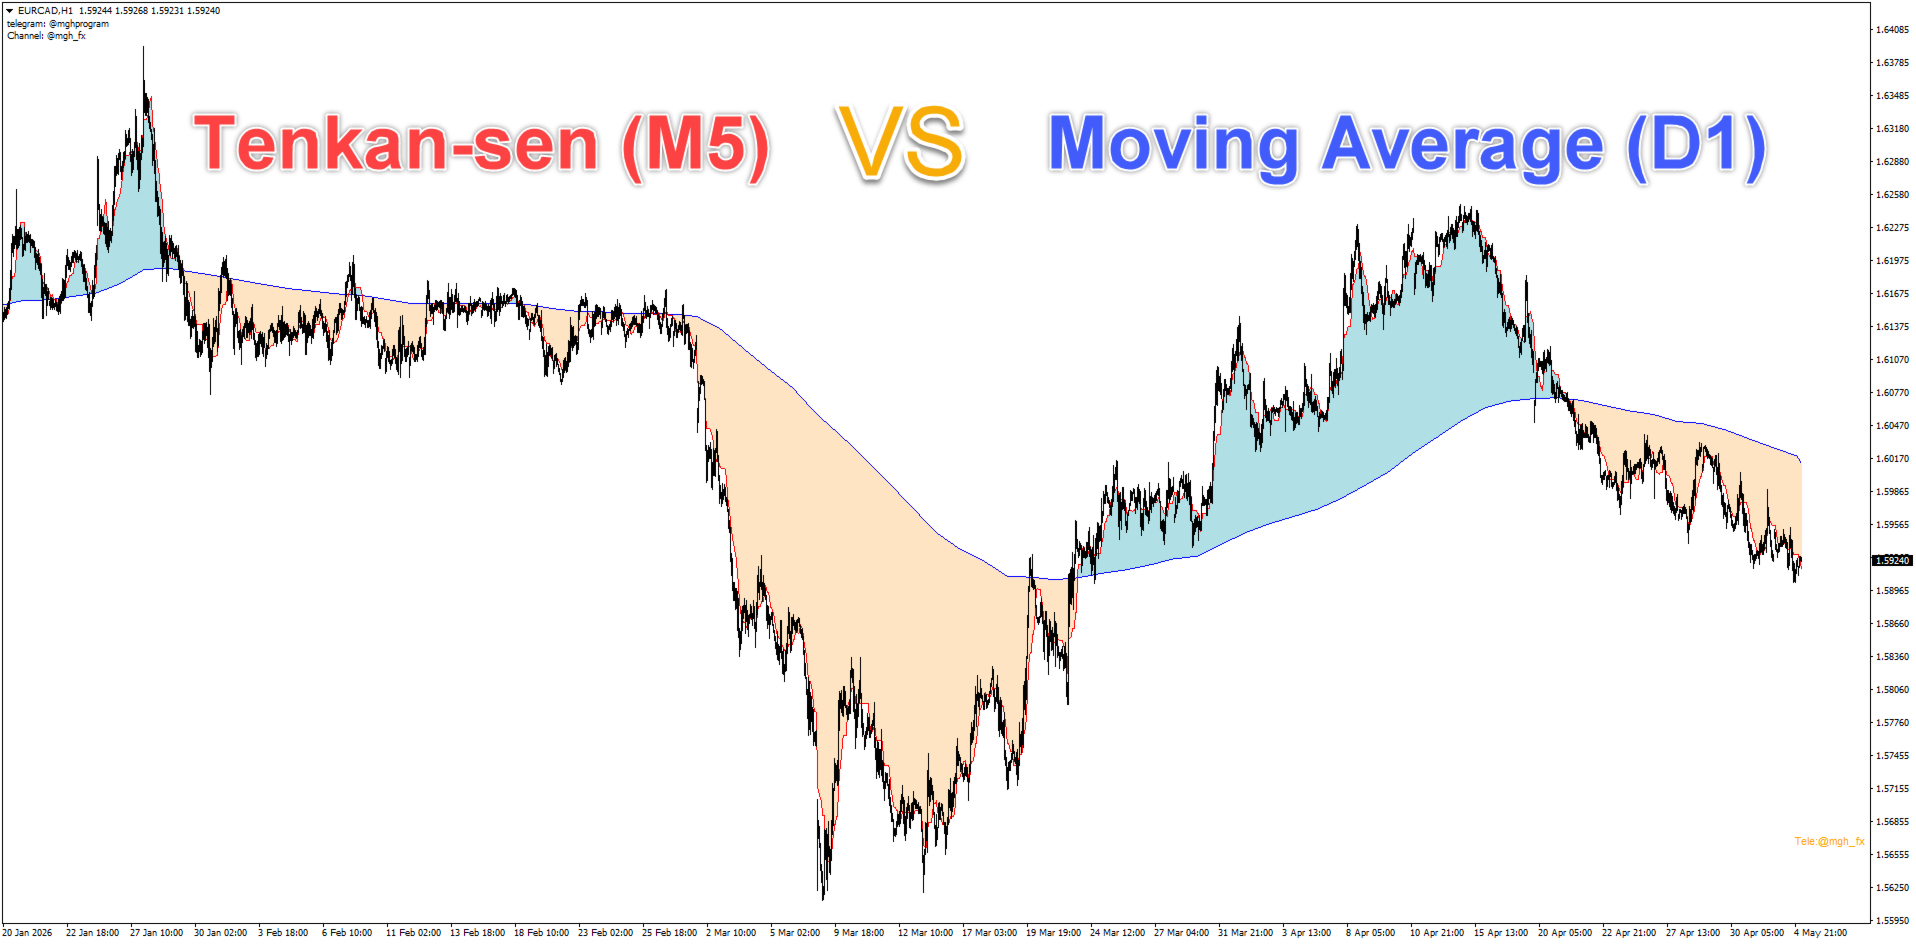
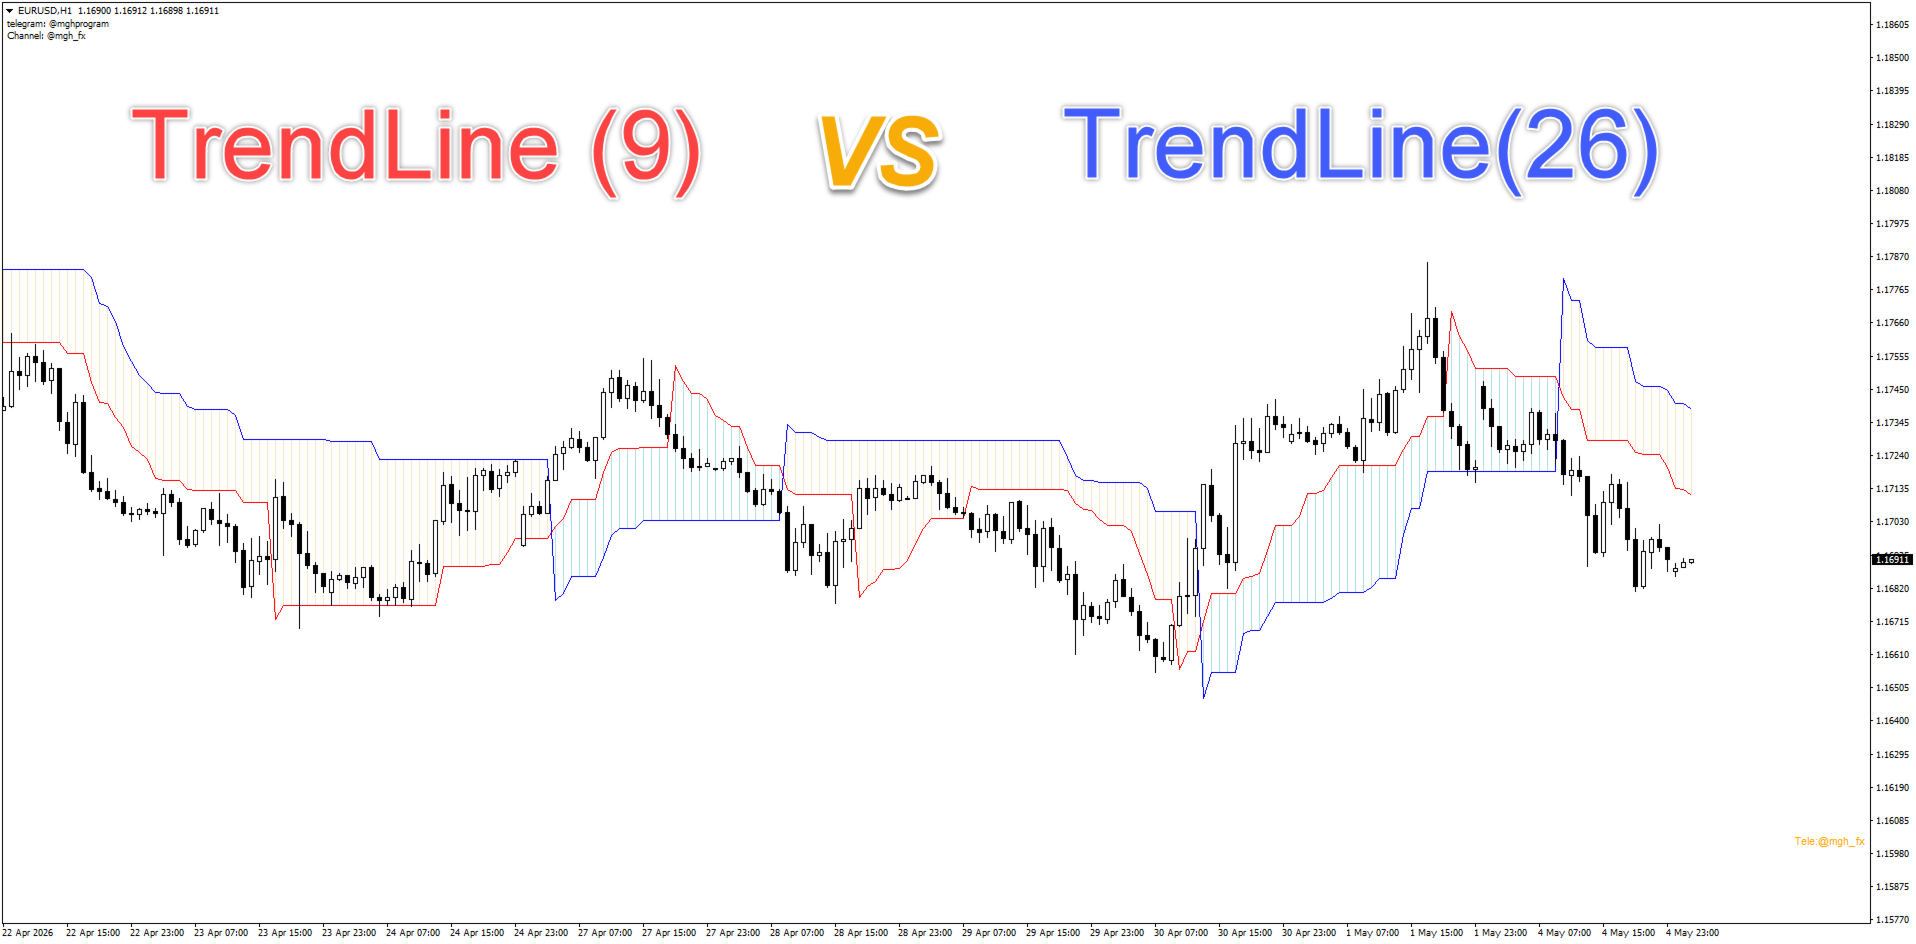
Cloudy Edition: Visual Cloud Layer
The Cloudy Edition renders a shaded cloud between the two selected lines, similar in concept to the Ichimoku Kumo. The cloud color changes based on which line is dominant, providing a visual reference for the current trend direction. A widening cloud indicates growing separation between the lines; a narrowing cloud may precede a crossover.
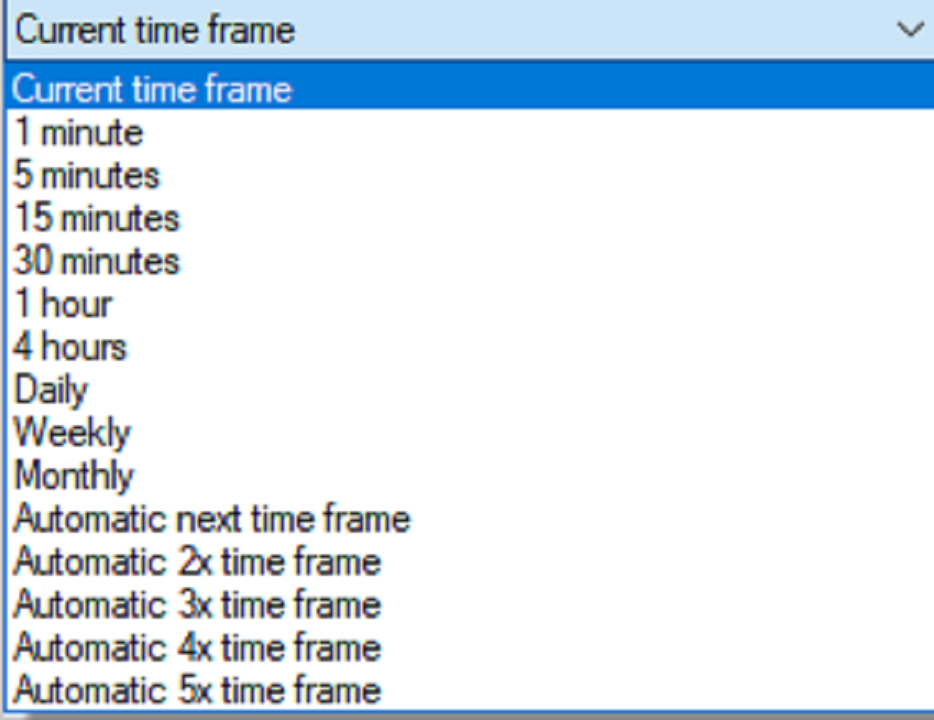
Multi-Timeframe Configuration
Each line has its own independent timeframe setting. This allows the indicator to monitor line relationships across different timeframes on a single chart. Available timeframes include all standard MT5 periods plus automatic multipliers (Auto 2x through Auto 5x), which map relative to the current chart timeframe.
Example configurations:
| Line 1 | Line 2 | Use Case |
|---|---|---|
| Tenkan-sen (Current TF) | Kijun-sen (H4) | Multi-timeframe Ichimoku signal |
| EMA 9 (Current TF) | EMA 26 (Daily) | Higher-timeframe trend reference |
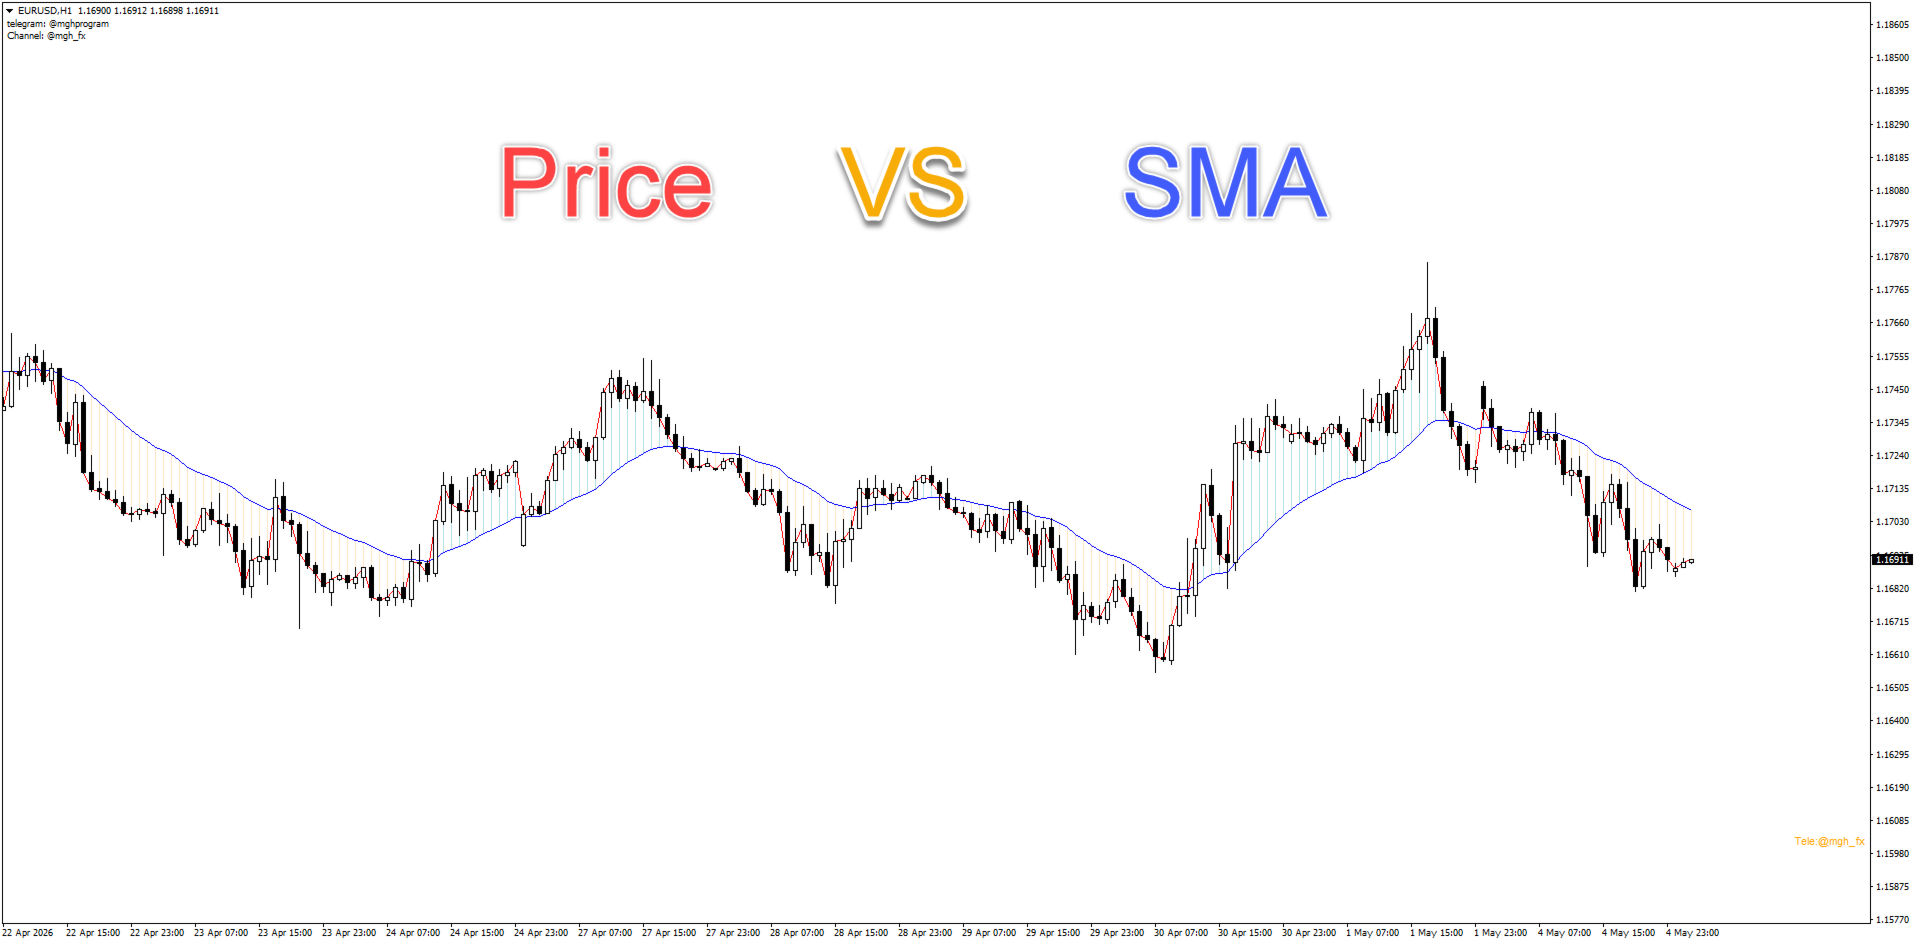
| Price (Close) | EMA 50 (Weekly) | Price vs. weekly moving average |
Alert Conditions
- Cross Alert: triggers when the two lines intersect
- Equality Alert: triggers when the two lines reach the same value
- Price Cross Alert: triggers when price crosses a selected line
- Shift support: candle-level shifts can be applied to either line before detection
Alert delivery options: on-screen popup, sound, email, and push notification to mobile.
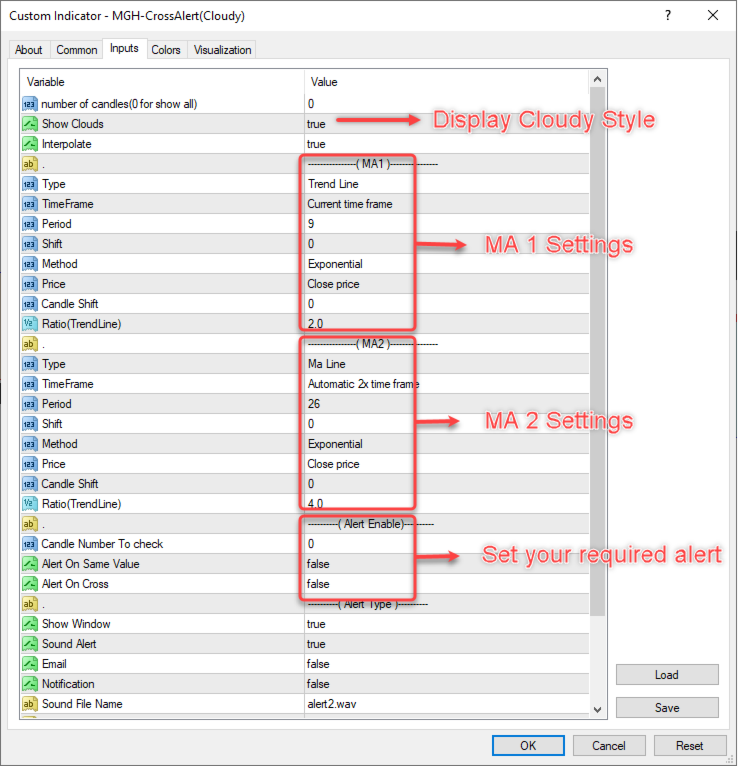
Setup
- Select Line 1 type (Moving Average, Ichimoku line, Trend Line, or Price)
- Set period, method, price source, shift, and timeframe for Line 1
- Repeat for Line 2
- Choose alert conditions and delivery methods
The indicator works on any symbol and any chart timeframe.
Intended Users
- Traders who use Ichimoku analysis and want automated detection of crossovers and equilibrium conditions
- Traders who monitor higher-timeframe structures on lower-timeframe charts
- Traders who follow rule-based strategies requiring specific line intersection alerts
MT5 version: https://www.mql5.com/en/market/product/176973
ユーザーは評価に対して何もコメントを残しませんでした