MagicLines MT4

  • インディケータ
  • Mostafa Ghanbari
    Mostafa Ghanbari
    ✅ MGH Products 創設者
    ✅ ソフトウェアエンジニア|カスタムインジケーター・エキスパートアドバイザー(EA)開発者
    ✅ MQL5.com 掲載著者
    こんにちは!Mostafa と申します。複雑な取引戦略を高性能で信頼性の高いツールへと変えることに情熱を注ぐ、ソフトウェアエンジニアです。ソフトウェア工学の確かな学術的背景と、長年にわたるプロフェッショナルなプログラミング経験を活かし、厳密なソフトウェアアーキテクチャとダイナミックなアルゴリズム取引の世界の橋渡しをしています。
    🛠 技術的な専門分野:
  • バージョン: 1.10
  • アップデート済み: 13 7月 2026
  • アクティベーション: 5

MGH-MagicLine — Trend & Multi-Timeframe Divergence in One Tool

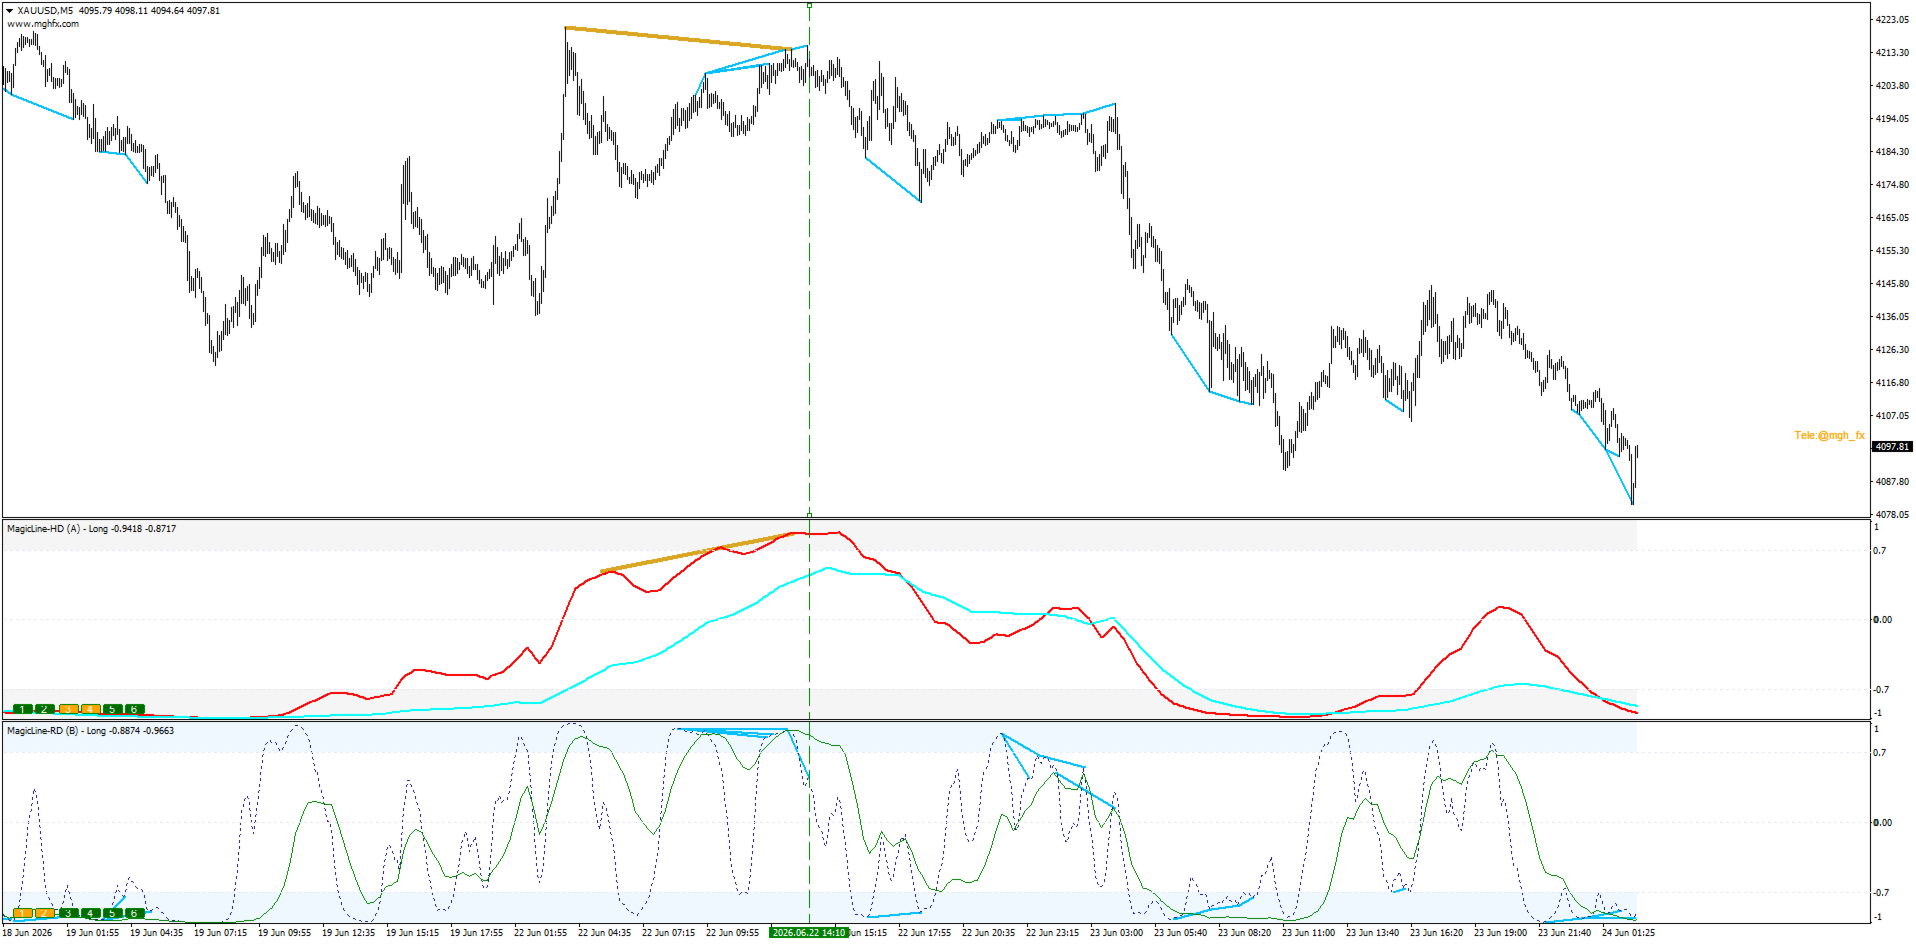
MagicLine combines trend detection and divergence analysis into a single indicator — a refined alternative to running MultiStoch and MultiMACD separately, with cleaner output and less lag.

It is a confirmation and analysis tool. It does not give entry points, Take Profit or Stop Loss. Instead, it adds a strong, flexible confirmation layer that fits almost any trend-based strategy and helps you read the market with more clarity.

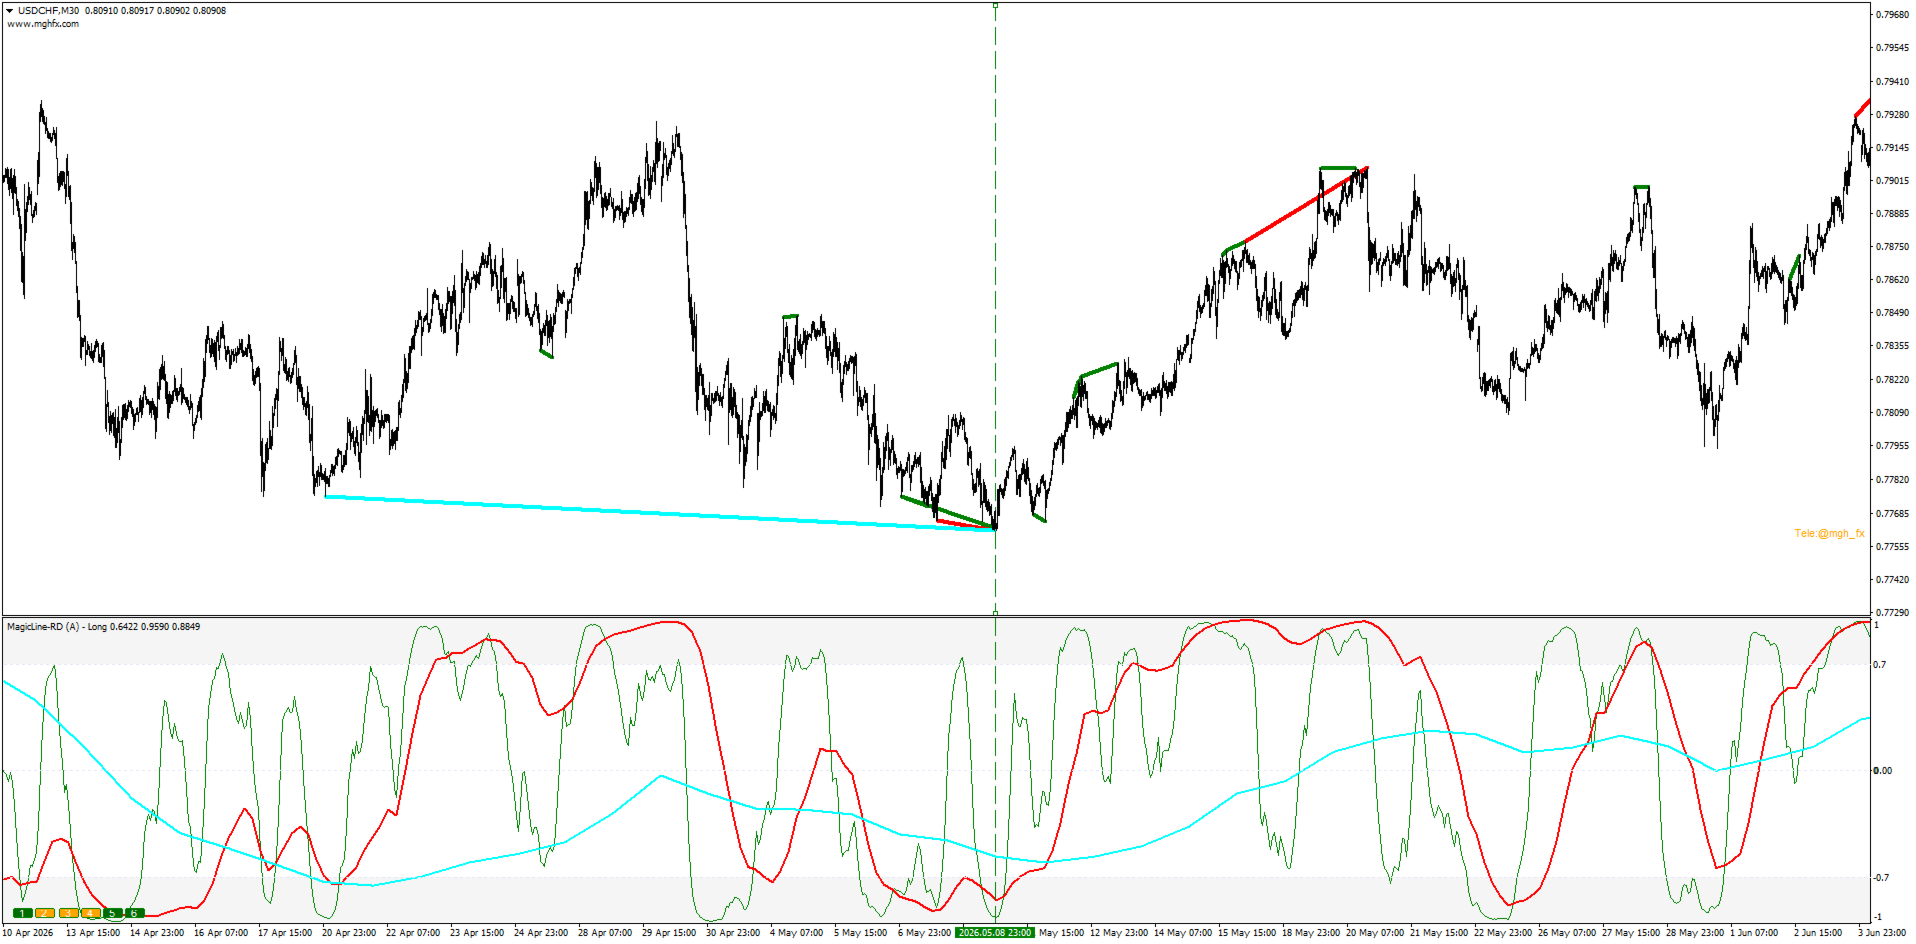
Three Line Modes — One Indicator

Choose the Line Type in settings; the active mode is shown directly in the indicator window name, so you always know what you are looking at:

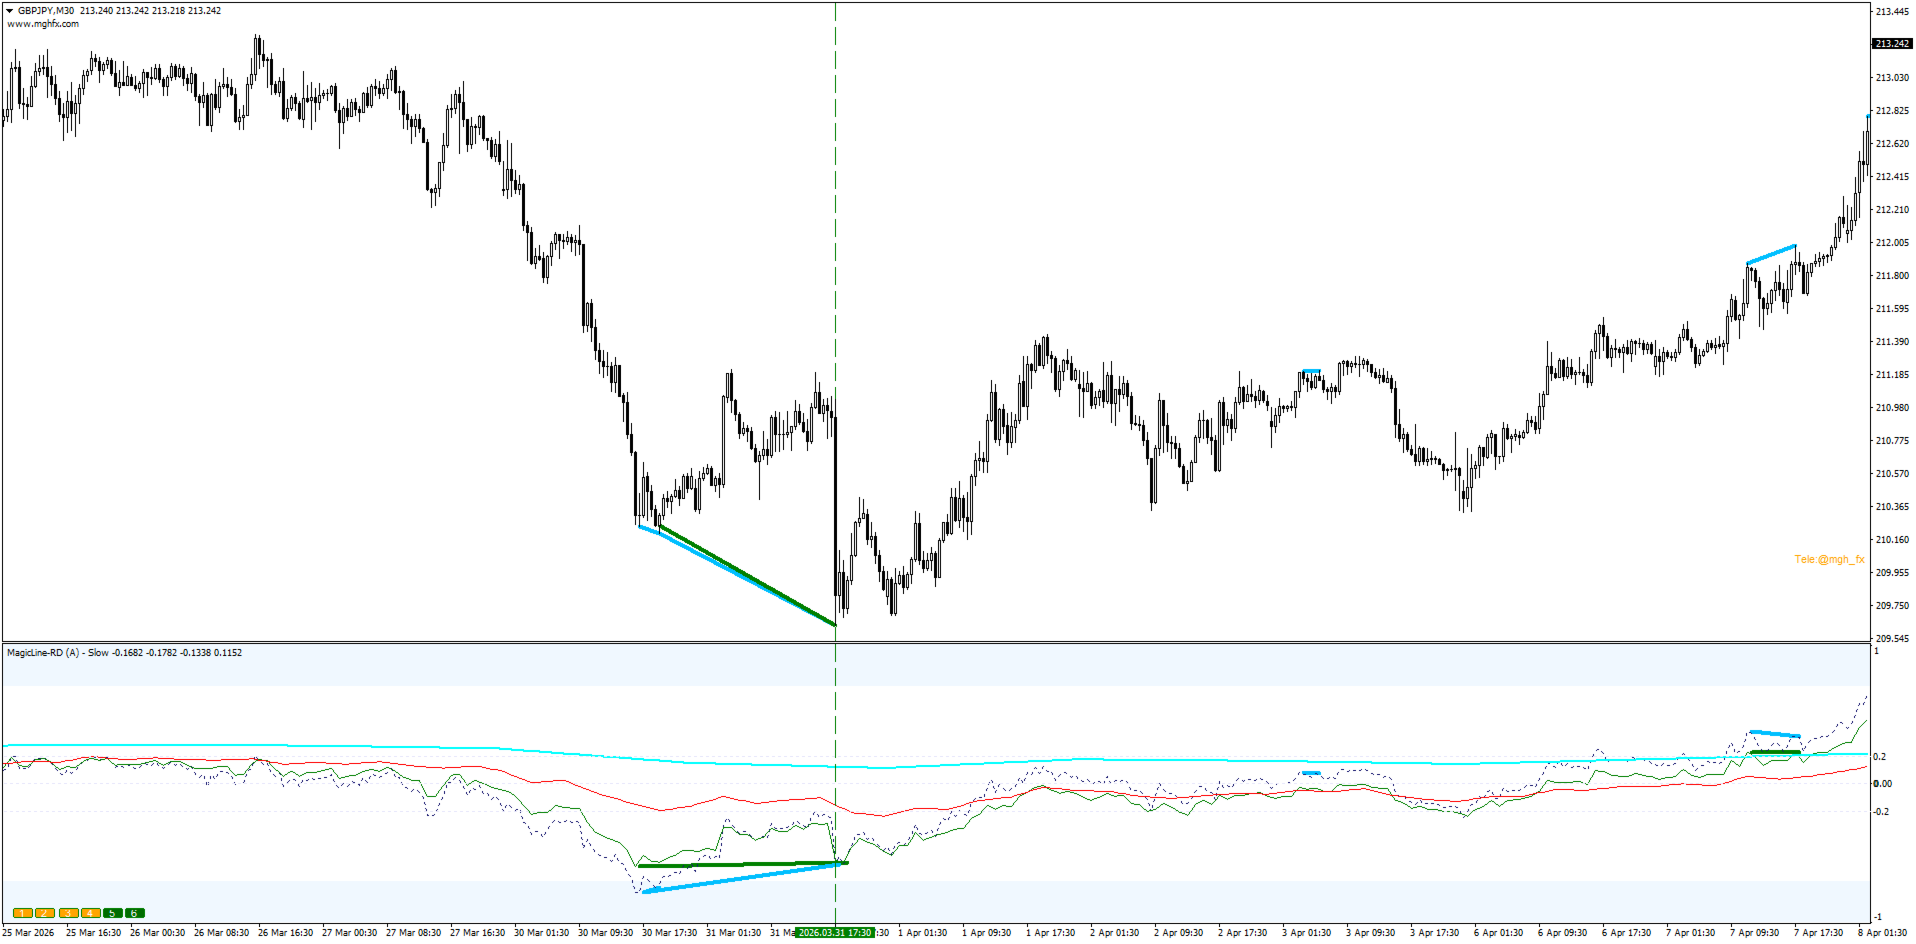
  • Slow — lowest noise, built to read the long-term trend direction. Lines reaching the ±0.2 zone confirm the dominant trend.
  • Long — clean trend detection with more responsiveness. A balanced, everyday choice.
  • Fast — quickest reaction, suited to scalping and intraday momentum.

One indicator, three distinct behaviors — adapt it to your timeframe and your style.

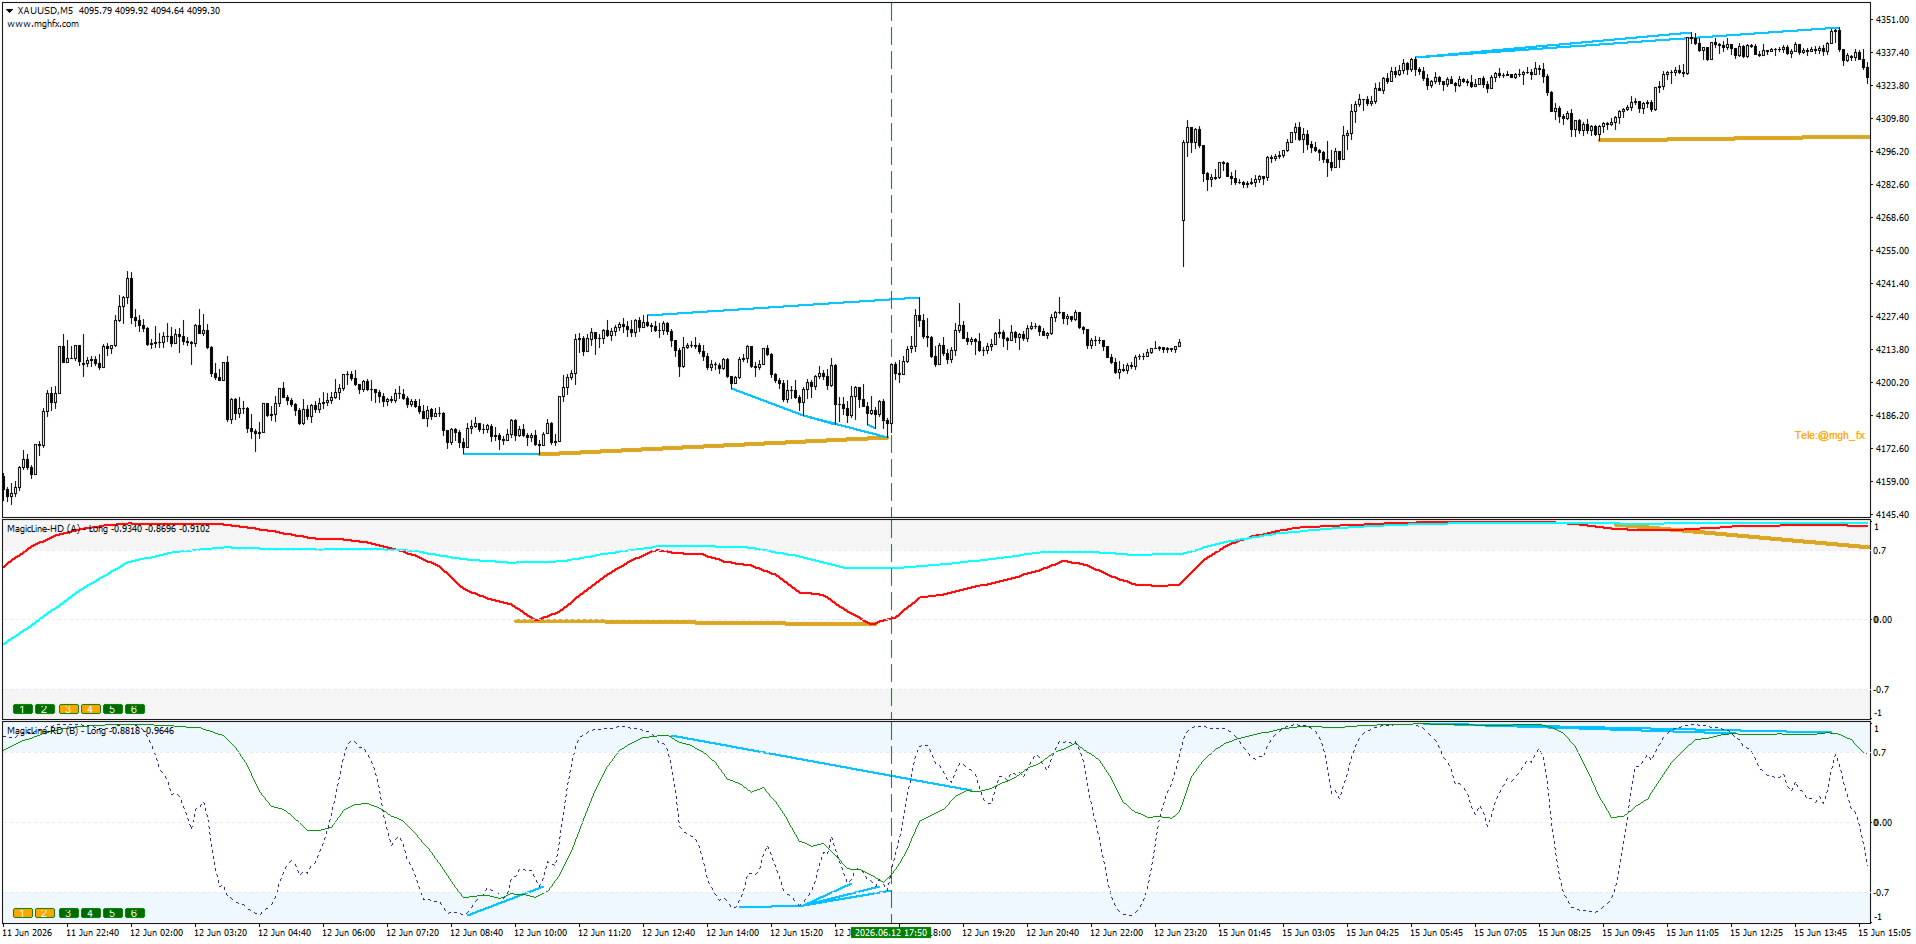
Multi-Timeframe Lines

  • Plots up to 6 independent lines, each tied to a higher timeframe.
  • Hover any line to see its timeframe instantly.
  • Toggle each line ON/OFF with the on-chart buttons (1–6).

See the higher-timeframe picture and your entry timeframe together, in one window.

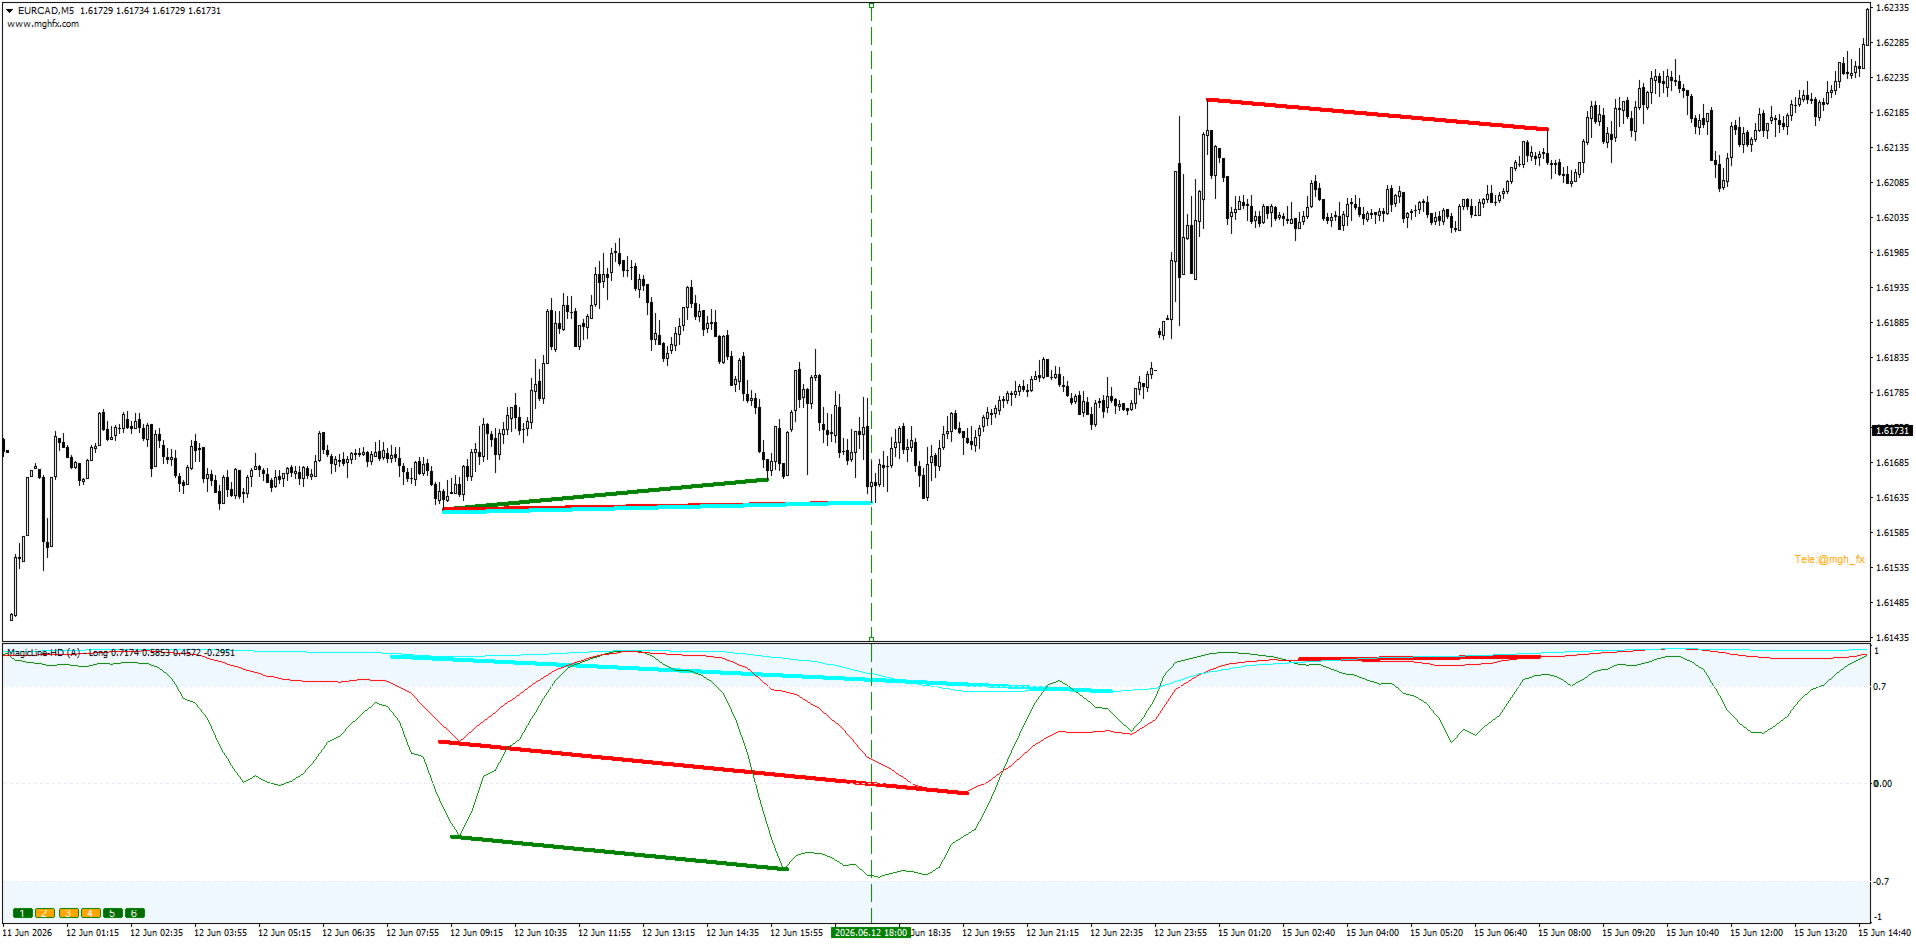
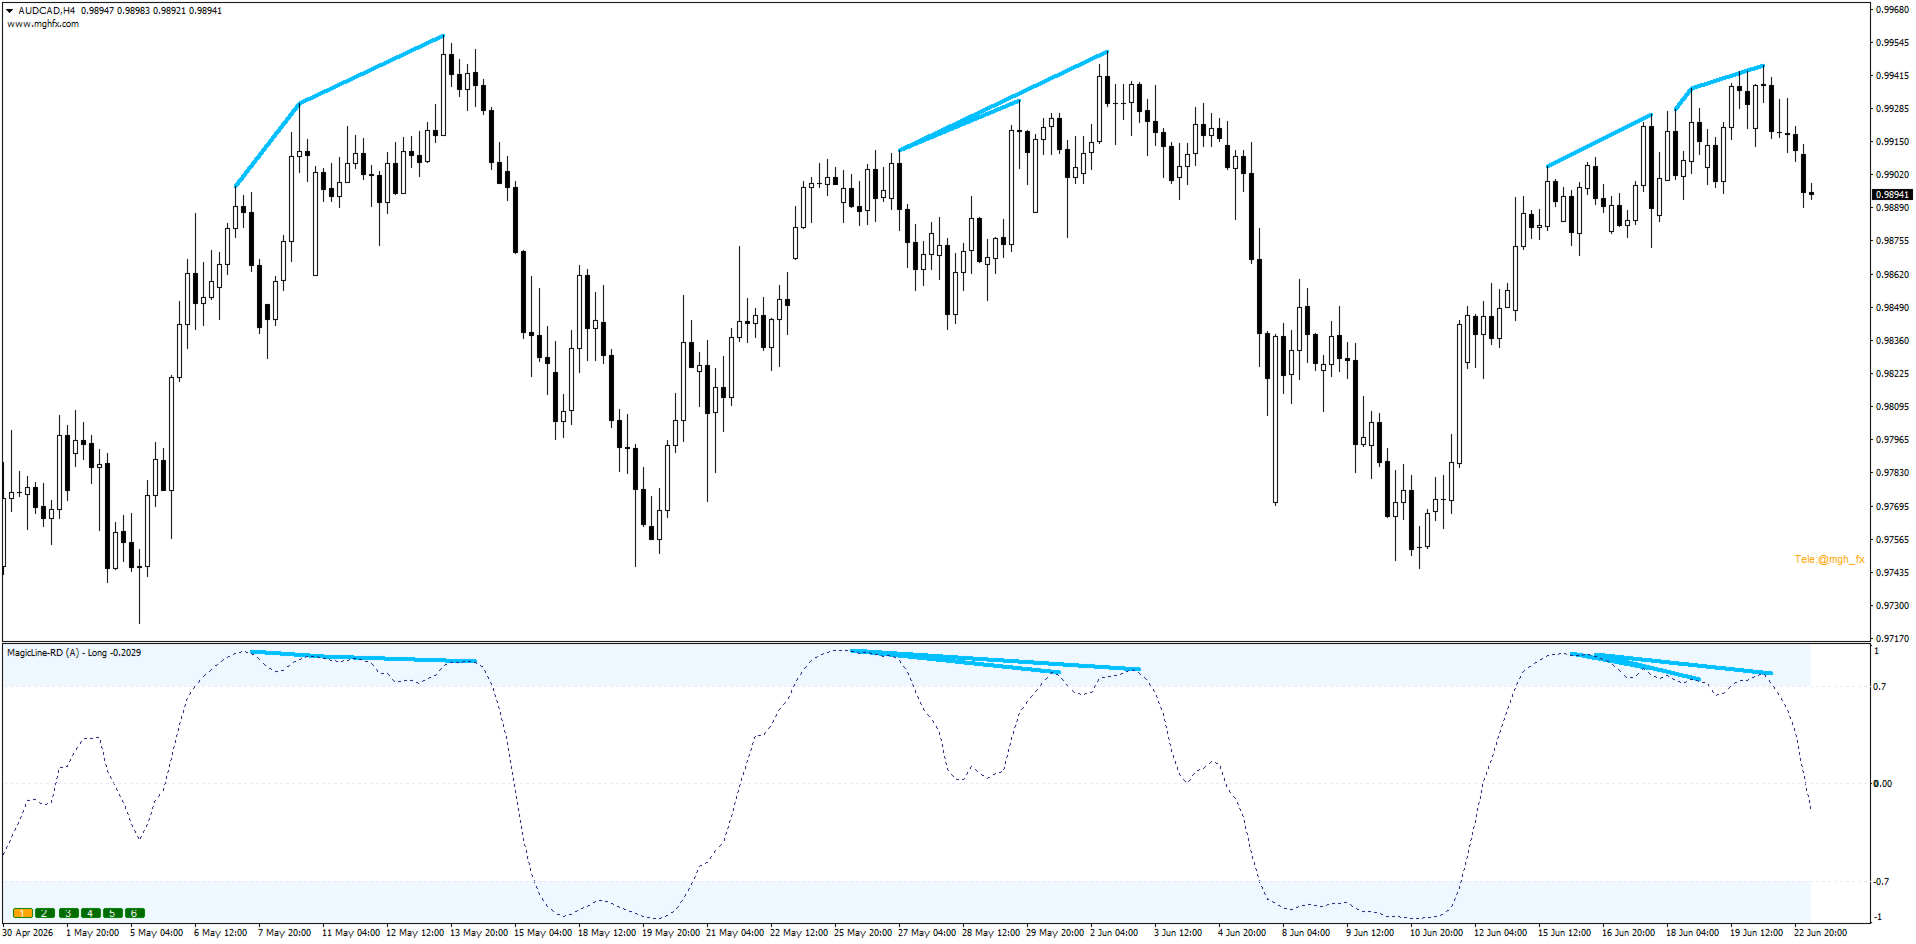
Regular & Hidden Divergence

Set Divergence Type to Regular or Hidden; the mode (RD / HD) is added to the indicator name so multiple instances stay easy to identify on the same chart.

  • Regular (RD) — highlights potential reversals.
  • Hidden (HD) — highlights trend continuation.

Each divergence is drawn both in the indicator window and directly on the price chart, color-coded per timeframe — no need to match peaks and troughs by eye. The Increase Divergence Range input extends detection to farther peaks and valleys for setups that are easy to miss otherwise.

Two Practical Approaches

1. Divergence stacking — multiple RD (or multiple HD) signals from different timeframes converging on the same candle, for a higher-conviction setup. The more lines that align, the stronger the picture.

2. RD + HD confluence — Hidden divergence from a higher timeframe (Daily/Weekly) for direction, combined with Regular divergence from a lower timeframe (H1/H4) for timing.

Built-In Alerts

Three independent alerts — Overbought/Oversold break, Center line break, and Divergence — delivered via popup, sound, email, or push notification, so you never have to watch the screen all day.

Input Parameters

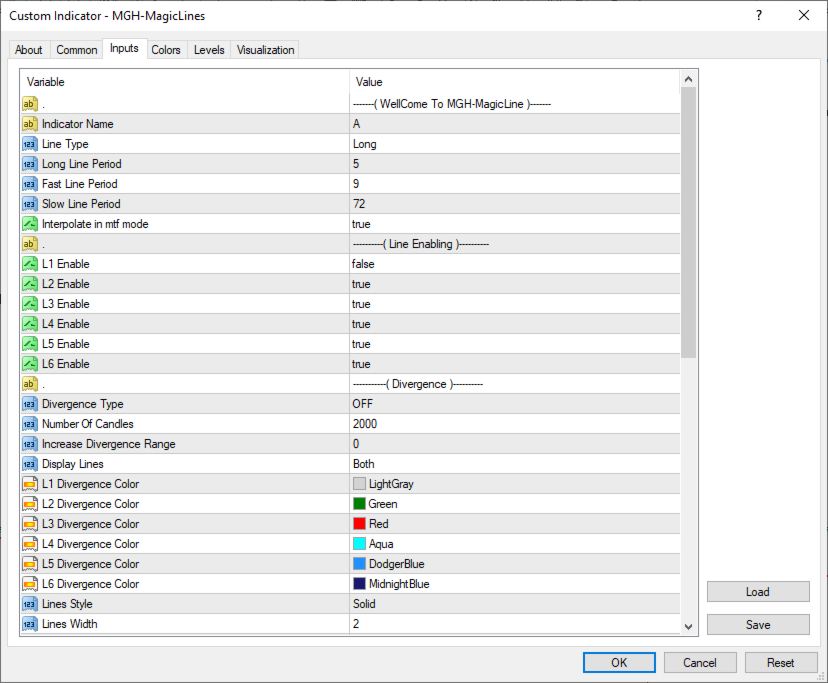
Lines

  • Indicator Name — custom label for the indicator window.
  • Line Type — Long / Fast / Slow engine selection.
  • Long / Fast / Slow Line Period — independent period for each engine.
  • Interpolate in MTF mode — smooths lines in multi-timeframe mode.
  • L1–L6 Enable — turn each of the 6 timeframe lines on or off.

Divergence

  • Divergence Type — Regular / Hidden / OFF.
  • Number Of Candles — history depth scanned for divergence.
  • Increase Divergence Range — widens detection to farther peaks/troughs.
  • Display Lines — show divergence in the window, on the chart, or both.
  • L1–L6 Divergence Color — color per timeframe.
  • Lines Style / Lines Width — divergence line appearance.

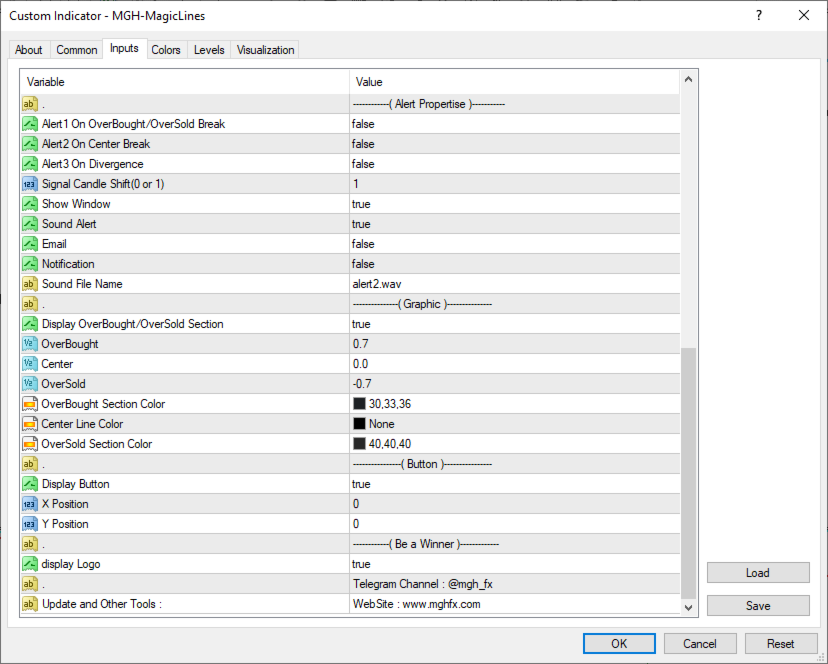
Alerts

  • Alert on Overbought/Oversold Break, Center Break, Divergence — enable each independently.
  • Signal Candle Shift (0 or 1) — signal on the closed or current candle.
  • Sound / Email / Notification — choose delivery method.
  • Sound File Name — custom alert sound.

Graphic

  • Overbought / Center / Oversold — adjustable zone levels.
  • Section & Center Line Colors — visual customization.
  • Show Window, Display Button, X/Y Position — layout controls.

Important

MagicLine is a confirmation tool, not an automated strategy. It works best when combined with your own analysis and risk management. Past behavior of any indicator does not guarantee future results.

Download the demo and test MagicLine on your own charts and strategy — see how it fits before you decide.

MT5 Version : https://www.mql5.com/en/market/product/185086


If you're looking for a more automated, multi-timeframe approach built on this same divergence-detection logic, check out MGH-MagicTrigger. It scans a chain of timeframes automatically, confirms higher-timeframe divergence with matching divergence on the lower timeframes, and draws an entry trigger, stop loss, and two targets for every confirmed signal.

MagicTrigger link:

MT5: https://www.mql5.com/en/market/product/186243

MT4: https://www.mql5.com/en/market/product/186226


おすすめのプロダクト
Quantum Falcon Signal Free is a smart visual trading indicator for MetaTrader 4 designed for Forex and Gold traders. The indicator combines: • Trend analysis • RSI momentum confirmation • MACD momentum filtering • ATR volatility filtering • Higher timeframe confirmation • Smart exit signal detection Main Features: • Smart Buy and Sell signals • Exit Buy / Exit Sell alerts • Real-time dashboard on chart • Professional candle arrows • Multi-timeframe trend confirmation • ATR market volatility filt
FREE
Forex strength meter is a useful indicator with which novice traders and professionals can analyze the market and see when and where to open a deal. Forex strength meter is an analytical complex for Metatrader4 which, in the form of lines on the chart, shows the trader the direction of the trend and its reversals. The interpretation of the indicator is very simple. When the indicator draws a red line above the blue line on the chart, it means that the trend is now going down. At this point, it
FREE
Berg Supertrend
Mark Thimoty Evangelista
BERG Supertrend Indicator  Developed by Berg Traders   New Telegram Channel for updates:  https://t.me/berg_traders Overview The Berg Supertrend indicator is a custom technical analysis tool that helps traders identify potential trend reversals and market trends based on the Average True Range (ATR) and price movements. Designed for versatility and user-friendliness, the indicator offers a range of customization options, including notification settings for desktop, email, and mobile alerts. Key
FREE
「Auto FIBO Pro」Crypto_Forex インジケーターは、取引の補助ツールとして最適です。 - インジケーターは、フィボナッチ レベルとローカル トレンド ライン (赤色) を自動的に計算してチャート上に配置します。 - フィボナッチ レベルは、価格が反転する可能性のある重要な領域を示します。 - 最も重要なレベルは、23.6%、38.2%、50%、61.8% です。 - リバーサル スキャルピングやゾーン グリッド取引に使用できます。 - Auto FIBO Pro インジケーターを使用して、現在のシステムを改善する機会も多数あります。 - Info Spread Swap Display があり、接続されている外国為替ペアの現在のスプレッドとスワップを表示します。 - ディスプレイには、アカウントの残高、エクイティ、マージンも表示されます。 - Info Spread Swap Display は、チャートのどのコーナーにも配置できます。 高品質のトレーディングロボットとインジケーターをご覧になるにはここをクリックしてください! これは、この MQL5 ウェブサイ
FFx CCI
Eric Venturi-Bloxs
4.5 (2)
The purpose of this new version of the MT4 standard indicator provided in your platform is to display in a sub-window multiple timeframes of the same indicator. See the example shown in the picture below. But the display isn’t like a simple MTF indicator. This is the real display of the indicator on its timeframe. Here's the options available in the FFx indicator: Select the timeframes to be displayed (M1 to Monthly) Define the width (number of bars) for each timeframe box Alert pop up/sound/ema
FREE
The indicator shows the potential trend direction by cyclical-wave dependence. Thus, all the rays of the intersection will be optimal rays, in the direction of which the price is expected to move, taking into account the indicator period. Rays can be used as a direction for potential market movement. But we must not forget that the approach must be comprehensive, the indicator signals require additional information to enter the market.
The indicator detects and displays Shark harmonic pattern (see the screenshot). The pattern is plotted by the extreme values of the ZigZag indicator (included in the resources, no need to install). After detecting the pattern, the indicator notifies of that by a pop-up window, a mobile notification and an email. The indicator highlights the process of the pattern formation and not just the complete pattern. In the former case, it is displayed in the contour triangles. After the pattern is comple
FFx Ichimoku
Eric Venturi-Bloxs
4.5 (4)
The purpose of this new version of the MT4 standard indicator provided in your platform is to display in a sub-window multiple timeframes of the same indicator. See the example shown in the picture below. But the display isn’t like a simple MTF indicator. This is the real display of the indicator on its timeframe. Here's the options available in the FFx indicator: Select the timeframes to be displayed (M1 to Monthly) Define the width (number of bars) for each timeframe box Alert pop up/sound/ema
FREE
The indicator allows you to trade binary options. The recommended time frame is М1 and the expiration time is 1,2,3 minutes. The indicator suitable for auto and manual trading. A possible signal is specified as a arrows above/under a candle. You should wait until the candle closes! Arrows are not re-painted Trade sessions: TOKYO section (Half-end) Currency pairs: USD/JPY Working time frame: M1 Expiration time: 1,2,3 minutes. The indicator also shows good results when using the martingale strateg
FREE
This indicator idea comes from Tushar Chande called Qstick. Technical indicators quantify trend direction and strength in different ways. One way is to use the difference between close and open for each bar and to sum it up over a period of time. The formual is: Qstick (period ) = Average ((close-open ), period ) In this indicator, we can choose how to calculate body by two famous chart types. The first and default indicator settings are based on Heiken Ashi chart, and the second is based
FREE
Free informative Indicator-helper. It'll be usefull for traders who trade many symbols or using grid systems (Averaging or Martingale). Indicator counts drawdown as percent and currency separate. It has a number of settings: Count deposite drawdown according equity value and send e-mail or notifications to user if DD more than set; Sending e-mail when max open orders reached; Shows price and remaining pips amount before MarginCall on current chart and Account generally; Display summary trade lot
FREE
R シルバー トレンド インジケーターは、Metatrader 4 アクティビティ チャートに現在のトレンドを直接表示するトレンド フォロー型取引インジケーターです。 2 種類のろうそくを描画します。 青は強気の値動きです。 弱気の価格変動の場合は赤。 R シルバー トレンド インジケーターを使用した取引は、まったくの初心者でも非常に簡単で、スキャルピング (M1、M5)、デイ トレード (M5、M15、M30)、スイング トレード (H1、H4、D1) の通貨に使用できます。 基本的な取引シグナル R シルバー トレンド インジケーターのシグナルは解釈しやすく、次のようになります。 買いシグナル: インジケーターがチャート上に青いろうそくを描いたときに買いポジションを開きます. 売りシグナル: インジケーターがチャート上に赤いろうそくを描いたときに売りポジションを開きます. 取引の終了: 反対のシグナルが表示されたら、開いている取引を終了するか、独自の取引終了方法を使用します。 ヒント R シルバー トレンド インジケーターを使用して下落して売る戦略をトレードするには
FREE
Koala Supply Demand
Ashkan Hazegh Nikrou
4.33 (6)
Koala Supply Demand のご紹介 ( 他のトレーダーがあなたの経験から学べるよう、良いレビューでも悪いレビューでも、ぜひフィードバックを共有してください。)  Koala Supply Demand インジケーターへようこそ。このインジケーターは、異なる時間足における 未ブレイクの供給・需要ゾーン を識別するために設計されています。このインジケーターは、トレーダーが市場をゾーンエリアとして視覚的に把握するのに役立ちます。価格が強力なゾーンをどのように尊重しているかを見ることができ、またゾーン内部で形成された場合にはプライスアクションシグナルも表示します。 Supply Demand コンセプト についてさらに学ぶ : 記事 さらに多くの無料製品を入手 するために私の MQL5 チャンネルへ参加してください : 参加 Koala Supply Demand の MT5 バージョン も利用可能です : ダウンロード 主な特徴: チャート上バックテスト機能: 独自の On Chart Back Test 機能により、分析の未来を体験してください。チャート上の任意の場所をクリ
FREE
Smart FVG インジケーター MT4 – MetaTrader 4 向け高度なフェアバリューギャップ検出 Smart FVG インジケーター MT4 は、MetaTrader 4 上で Fair Value Gap(FVG)をプロフェッショナルレベルで検出・監視し、アラートまで行うツールです。ATR ベースのフィルタリングと相場構造を考慮したロジックを組み合わせることで、ノイズを取り除き、流動性に応じて適応し、本当に重要な不均衡だけを残して精度の高い判断をサポートします。 主な特長 正確な FVG 検出:単なるローソク足のギャップではなく、市場の本質的な非効率を捉えます。 ATR ベースの精度:市場や時間軸が変わっても、低品質なシグナルを自動的にフィルタリング。 有効性のリアルタイム追跡:価格がゾーンを埋める/ブレイクすると、ゾーンが自動で延長・調整・削除されます。 カスタマイズ可能な表示:色・ラインスタイル・塗りつぶしを自由に設定し、どんなテンプレートにも合わせられます。 実用的なアラート:新規 FVG や、埋められた/無効化されたゾーンをリアルタイム通知。 パフォーマンス
FREE
QualifiedEngulfing - は ProEngulfing インジケーターの無料版です。 ProEngulfing - は Advance Engulf インジケーターの有料版で、 こちらからダウンロードできます。 ProEngulfing の無料版と有料版の違いは何ですか?無料版は1日に1つのシグナルの制限があります。 QualifiedEngulfingをご紹介します - あなたのMT4用のプロフェッショナルエンゴルフパターンインジケーター Precisionの力を解放して、QualifiedEngulfingを使用して外国為替市場での資格のあるエンゴルフパターンを特定および強調する先進的なインジケーターです。MetaTrader 4用に開発されたQualifiedEngulfingは、外国為替市場のエンゴルフパターンを確認およびハイライトするために設計された切り立ったアプローチを提供し、取引の決定に対して最も信頼性の高いシグナルのみを受け取ることを確認します。 QualifiedEngulfingの動作方法: QualifiedEngulfingは、エンゴルフパター
FREE
Scalper RS - ​​ は、価格チャート上で最も可能性の高い反転ポイントを識別するように設計された取引および分析インジケーターです。 価格構造化を実行するインジケーター アルゴリズムにより、さまざまな取引商品と時間枠での価格反転の組み合わせを決定できます。 可変パラメータ「 Structuring 」を使用すると、希望する取引チャートと時間枠に最適な設定を選択できます。 当初、このインジケーターは M1 - M5 - M15 の時間枠でシグナルを受信するために作成されましたが、必要なパラメータを選択することで、H1 - H4 - D1 の時間枠で長期トレンドを識別するように構成できます。 スキャルピングや短期取引に適しています。 信号矢印は、再描画なしでも、再描画ありでも動作できます (切り替え可能なパラメータ)。 すべてのシグナルはローソク足の終値に表示されます。 通知にはいくつかの種類があります。 インジケーターシグナルはトレンドの方向にも、それに逆らう方向にも使用できます。 このインジケーターは、独立したシステムとして使用することも、既存のトレンド取引システムへの追加
Price Magnet — Price Density and Attraction Levels Indicator Price Magnet is a professional analytical tool designed to identify key support and resistance levels based on statistical Price Density. The indicator analyzes a specified historical period and detects price levels where the market spent the most time. These zones act as “magnets,” attracting price action or forming a structural base for potential reversals. Unlike traditional Volume Profile tools, Price Magnet focuses on price-time d
Gold Venamax   - これは最高の株式テクニカル指標です。 指標アルゴリズムは資産の価格変動を分析し、ボラティリティと潜在的なエントリーゾーンを反映します。 インジケーターの機能: これは、快適で収益性の高い取引のためのマジックとトレンド矢印の 2 つのブロックを備えたスーパー インジケーターです。 チャート上にブロックを切り替えるための赤いボタンが表示されます。 マジックはインジケーター設定で設定されているため、異なるブロックを表示する 2 つのチャートにインジケーターをインストールできます。 Gold Venamax は、異なる矢印バッファー (GV と SD) を備えた 2 つのチャートに配置できます。 これを行うには、設定で異なる Magic を選択する必要があります。たとえば、あるマジック = 999、別のマジック = 666 を選択します。次に、チャート上の赤いボタンで矢印バッファを選択できます。 インジケーター設定の各矢印バッファー (GV および SD) には、快適で収益性の高い取引のための個別の矢印フィルターがあります (UseFiltrGV = tru
LineBreakMT4
Nattadecha Tangpakinwat
Key Features: Type of Indicator: Line Break Chart Indicator Usage: Identifying trend reversals and potential market turning points. Input Parameters: The primary input parameter is 'Lines_Break,' which represents the number of lines the price needs to move to create a new line in the opposite direction. How it works: The indicator draws green and red histogram bars to represent the line break chart. Green bars indicate an upward trend, and red bars indicate a downward trend. The indicator calcul
FREE
Forex Gump
Andrey Kozak
2.4 (5)
Forex Gump is a fully finished semi-automatic trading system. In the form of arrows, signals are displayed on the screen for opening and closing deals. All you need is to follow the instructions of the indicator. When the indicator shows a blue arrow, you need to open a buy order. When the indicator shows a red arrow, you need to open a sell order. Close orders when the indicator draws a yellow cross. In order to get the most effective result, we recommend using the timeframes H1, H4, D1. There
RSI Color and Notification Setting Usages :: 1. Set value Oversold and Overbought 2. Set period RSI 3. Set Color 4. Notify to Alert, Email and Mobile. For Trading :: Forex and Binary option 1. When the color alarm occurs in the OVB area, do the preparation. To enter a Sell order 2. When the color alarm occurs in the OVS area, do the preparation. To enter a Buy order 3. When RSI is between OVB and OVS, consider another indicator to trade.
FREE
Free automatic Fibonacci is an indicator that automatically plots a Fibonacci retracement based on the number of bars you select on the BarsToScan setting in the indicator. The Fibonacci is automatically updated in real time as new highest and lowest values appears amongst the selected bars. You can select which level values to be displayed in the indicator settings. You can also select the color of the levels thus enabling the trader to be able to attach the indicator several times with differe
FREE
The indicator displays signals according to the strategy of Bill Williams on the chart. Demo version of the indicator has the same features as the paid, except that it can work only on a demo account . Signal "First Wise Man" is formed when there is a divergent bar with angulation.  Bullish divergent bar - with lower minimum and closing price in the upper half. Bearish divergent bar - higher maximum and the closing price at the bottom half. Angulation is formed when all three lines of Alligator
FREE
Candle Pattern Finder Candle Pattern Finder is a powerful MT4 indicator designed to help traders easily detect key candlestick patterns in real-time. Whether you're trading trends, reversals, or consolidations, this tool highlights important price action signals directly on the chart — helping you make faster and more confident trading decisions. Detects popular candlestick patterns: Bullish/Bearish Engulfing Hammer & Inverted Hammer Shooting Star & Hanging Man Three White Soldiers Three Black
FREE
BE auto
Muhammad Ridzuan Mohd Radzali
5 (2)
Indicator automatically draw bullish and bearish engulfing without any rules. Bearish and Bullish engulf is well known area for supply and demand area marking. This indicator can be used in any strategy that required supply demand zone. Show Last Engulf : Enable this option to show unfresh engulfing  Candle to calculate : set 0 will load all history bar and can use up more memory Bearish Engulfing Colour : Pick any colour that suit Bearish Engulfing Colour  : Pick any colour that suit -Use this
FREE
Mr Beast Indicator
Luis Mariano Vazquez Marcos
Indicador Gratuito desarrollado por Mr Beast Inversiones Mr Beast : Gestión de riesgo profesional. Brindo a la comunidad la entrada a productos de M Beast. Echar un vistazo a mis señales y expert advisors. Descuentos de hasta 70% Diclaimer: La negociación en Forex, CFD y Opciones conlleva un riesgo de pérdida sustancial y no es adecuada para todos los inversores. El alto grado de apalancamiento puede actuar en su contra y también en su favor, Antes de decidirse a operar en productos tan apalanca
FREE
このプロジェクトが好きなら、5つ星レビューを残してください。 このインジケータは、指定されたためのオープン、ハイ、ロー、クローズ価格を描画します 特定のタイムゾーンの期間と調整が可能です。 これらは、多くの機関や専門家によって見られた重要なレベルです トレーダーは、彼らがより多くのかもしれない場所を知るために有用であり、 アクティブ。 利用可能な期間は次のとおりです。 前の日。 前週。 前の月。 前の四半期。 前年。 または: 現在の日。 現在の週。 現在の月。 現在の四半期。 現年。
FREE
平均方向性指数(ADX)マルチカレンシースキャナー MT4 は、複数の通貨ペアを同時に分析するために設計された高度なトレーディングインジケーターです。これは、平均方向性指数に基づいたリアルタイムのシグナルを提供することで、意思決定プロセスを強化しようとするトレーダーにとって有益です。効率的な市場トレンド分析を可能にします。 このツールは、トレンドの強さと方向の動きを簡単に特定できるようにすることで、トレーダーにとって不可欠な資産となります。ADXに基づく戦略を採用しているトレーダーにとって特に重要です。リアルタイムのアラートと使いやすいダッシュボードにより、トレーダーは市場の状況を迅速に評価し、情報に基づいた取引選択を行うことができます。 MQL製品のインストールガイド | MT4/MT5で購入したMQL製品の更新 | 一般的なトラブルシューティングガイド | インジケーター設定 / ガイド 主な機能 バッファ統合: インジケーターの値をアクセス可能なバッファとして公開し、Expert Advisorが自動取引のためにシグナルデータを利用できるようにします。 視覚的矢印シグナル: シグ
FFx OsMA
Eric Venturi-Bloxs
4.5 (2)
The purpose of this new version of the MT4 standard indicator provided in your platform is to display in a sub-window multiple timeframes of the same indicator. See the example shown in the picture below. But the display isn’t like a simple MTF indicator. This is the real display of the indicator on its timeframe. Here's the options available in the FFx indicator: Select the timeframes to be displayed (M1 to Monthly) Define the width (number of bars) for each timeframe box Alert pop up/sound/ema
FREE
FFx MACD
Eric Venturi-Bloxs
4.2 (5)
The purpose of this new version of the MT4 standard indicator provided in your platform is to display in a sub-window multiple timeframes of the same indicator. See the example shown in the picture below. But the display isn’t like a simple MTF indicator. This is the real display of the indicator on its timeframe. Here's the options available in the FFx indicator: Select the timeframes to be displayed (M1 to Monthly) Define the width (number of bars) for each timeframe box Alert pop up/sound/ema
FREE
このプロダクトを購入した人は以下も購入しています
Neuro Poseidon is a new indicator by Daria Rezueva. It combines precise trading signals with adaptive TP/SL levels - creating best possible trades as a result! Message me and get  Neuro Poseidon Assistant  as a gift to automize your trading process! What makes it stand out? 1. Proven profitability on all assets and timeframes 2. Only confirmed BUY and SELL signals present on the chart 3. Adaptive TP & SL levels generated by the software for each trade 4. Easy to understand - suitable for all
Super Signal – Skyblade Edition プロ仕様のノンリペイント / ノーラグ・トレンドシグナルシステム。卓越した勝率を実現 | MT4 / MT5 対応 1分足、5分足、15分足などの低い時間足で最も効果を発揮します。 主な特徴: Super Signal – Skyblade Edition は、トレンド取引に特化したスマートなシグナルシステムです。マルチレイヤーのフィルターロジックを用いて、明確な方向性と実際のモメンタムに支えられた強力なトレンドのみを検出します。 このシステムは 天井や底を予測するものではありません 。次の3つの条件がすべて満たされた場合にのみシグナルを発生させます: 明確なトレンド方向 モメンタムの増加 健全なボラティリティ構造 市場セッションに基づく流動性分析と組み合わせることで、シグナルの精度とタイミングがさらに向上します。 シグナルの特性: すべての矢印シグナルは 100% 非リペイント / 遅延なし 一度出現したシグナルは固定され、点滅・消失しません チャート上の矢印、情報パネル、ポップアップ通知、音声アラート、プッシュ通知
Miraculous Indicator – ガン・スクエア・オブ・ナインに基づく100%非リペイントのFXおよびバイナリーツール この動画では、FXおよびバイナリーオプションのトレーダー向けに特別に開発された、非常に正確で強力な取引ツールである Miraculous Indicator を紹介しています。このインジケーターがユニークなのは、伝説的な ガン・スクエア・オブ・ナイン と ガンの振動の法則 に基づいている点で、現代の取引で利用できる最も正確な予測ツールの一つとなっています。 Miraculous Indicatorは 完全に非リペイント であり、ローソク足が確定した後にシグナルが変化したり消えたりすることはありません。つまり、見たものがそのまま利用できます。これにより、トレーダーは自信を持ってエントリーおよびエグジットを行うための信頼性と一貫性のある根拠を得ることができます。 主な特徴: ガン・スクエア・オブ・ナインとガン理論に基づいて構築 100%非リペイントのシグナルシステム すべての時間枠(M1、M5、H1、H4、日足、週足)で機能 FXおよびバイナリーオプション取引
ECM Elite Channel is a volatility-based indicator, developed with a specific time algorithm, which consists of finding possible corrections in the market. This indicator shows two outer lines, an inner line (retracement line) and an arrow sign, where the channel theory is to help identify overbought and oversold conditions in the market. The market price will generally fall between the boundaries of the channel. If prices touch or move outside the channel, it's a trading opportunity. The ind
NAM Order Blocks
NAM TECH GROUP, CORP.
3.67 (3)
MT4マルチタイムフレームオーダーブロック検出インジケーター。 特徴 -チャートコントロールパネルで完全にカスタマイズ可能で、完全な相互作用を提供します。 -必要な場所でコントロールパネルを表示および非表示にします。 -複数の時間枠でOBを検出します。 -表示するOBの数量を選択します。 -さまざまなOBユーザーインターフェイス。 -OBのさまざまなフィルター。 -OB近接アラート。 -ADRの高線と低線。 -通知サービス(画面アラート|プッシュ通知)。 概要 注文ブロックは、金融機関や銀行からの注文収集を示す市場行動です。著名な金融機関と中央銀行が外国為替市場を牽引しています。したがって、トレーダーは市場で何をしているのかを知る必要があります。市場が注文ブロックを構築するとき、それは投資決定のほとんどが行われる範囲のように動きます。 注文の構築が完了すると、市場は上向きと下向きの両方に向かって急激に動きます。注文ブロック取引戦略の重要な用語は、機関投資家が行っていることを含むことです。それらは主要な価格ドライバーであるため、機関投資家の取引を含むあらゆる戦
Enigmera
Ivan Stefanov
5 (9)
ENIGMERA: 市場の中心 重要:MQL5.comのデモはStrategy Testerで実行されており、Enigmeraの機能を完全には反映していない場合があります。詳細については、説明、スクリーンショット、ビデオをご確認ください。質問があれば、遠慮なくメッセージを送ってください! インジケーターのコードは完全に書き直されました。バージョン3.0は新機能を追加し、インジケーターの開始以来蓄積されたバグを修正しました。 紹介 このインジケーターとトレーディングシステムは、金融市場への注目すべきアプローチです。ENIGMERAはフラクタルサイクルを使用して、サポートとレジスタンスのレベルを正確に計算します。真の蓄積フェーズを示し、方向と目標を提供します。トレンドでも修正でも機能するシステムです。 動作方法 インジケーターのほとんどの機能は、チャートの左側にあるボタンで制御され、市場の状況に迅速に対応できるようになっています。 ボタン ON/OFF – インジケーター全体を表示または非表示にします。 Channel – サポートチャネルを有効にし、許容範囲の偏差を示します。 Dev
Meravith
Ivan Stefanov
5 (3)
マーケットメーカーのためのツール。 Meravith は次の機能を提供します: すべての時間足を分析し、現在有効なトレンドを表示します。 強気と弱気の出来高が等しくなる流動性ゾーン(出来高均衡)を強調表示します。 異なる時間足のすべての流動性レベルをチャート上に直接表示します。 テキスト形式の市場分析を生成し、参考情報として表示します。 現在のトレンドに基づいて目標値、サポートレベル、ストップロスを計算します。 取引のリスクリワード比を算出します。 口座残高に基づいてポジションサイズを計算し、潜在的な利益を推定します。 また、市場に大きな変化があった場合には警告を表示します。 インジケーターの主要ライン: 強気/弱気の出来高エグゾーストライン ― 目標値として機能します。 市場のトレンドを示すライン。市場が強気か弱気かによって色が変わり、トレンドのサポートとして機能します。主にその色が市場センチメントを示します。 出来高均衡ライン(Eq)。Eq(Volume Equilibrium)ラインはシステムの中核です。これは買い手と売り手の出来高のバランスポイントを表します。市場の流動性を示し
Gold Channel is a volatility-based indicator, developed with a specific timing algorithm for the XAUUSD pair, which consists of finding possible corrections in the market. This indicator shows two outer lines, an inner line (retracement line) and an arrow sign, where the theory of the channel is to help identify overbought and oversold conditions in the market. The market price will generally fall between the boundaries of the channel. If prices touch or move outside the channel it is a tradi
Linear Trend Predictor ー - エントリ ポイントと方向サポート ラインを組み合わせたトレンド インジケーター。高値/安値チャネルを突破するという原理に基づいて機能します。 インジケーターのアルゴリズムは市場のノイズをフィルタリングし、ボラティリティと市場の動向を考慮します。 インジケーターの機能  平滑化手法を使用して、市場のトレンドと、買い注文または売り注文を開くためのエントリー ポイントを表示します。  任意の時間枠のチャートを分析して、短期および長期の市場の動きを判断するのに適しています。  あらゆる市場や時間枠に適応可能な入力パラメータにより、トレーダーはインジケーターを独自にカスタマイズできます。  設定されたインジケーター信号は消えず、再描画もされません。ローソク足の終値で決定されます。  いくつかの種類の通知が矢印と組み合わされています。  このインジケーターは、独立した取引システムとして使用することも、他の取引システムへの追加として使用することもできます。  あらゆるレベルの経験を持つトレーダーが使用できます。 主なパラメータ Vol
RelicusRoad Pro: 定量的市場オペレーティングシステム 【期間限定】無制限アクセス 70% OFF - 2,000人超のトレーダーと共に なぜ多くのトレーダーは「完璧な」インジケーターを使っても失敗するのでしょうか? それは、文脈を無視して 単一の概念 だけでトレードしているからです。文脈のないシグナルは単なるギャンブルです。勝ち続けるには、 根拠の重なり(コンフルエンス) が必要です。 RelicusRoad Proは単なる矢印インジケーターではありません。完全な 定量的市場エコシステム です。独自のボラティリティモデリングを用いて、価格が推移する「適正価値の道(Fair Value Road)」をマッピングし、ノイズと真の構造的ブレイクを判別します。 推測はやめましょう。機関投資家レベルの「ロード・ロジック」でトレードを。 コアエンジン:「Road」アルゴリズム システムの中心となる Road Algo は、市場環境にリアルタイムで適応するダイナミックなボラティリティチャネルです。 安全ライン(平衡点) と、価格が数学的に反転しやすい 拡張レベル を投影します。 Si
The Propfolio Master Suite is the ultimate all-in-one analytical workstation for professional traders. Combining the power of the Beat The Market Maker (BTMM) methodology, Smart Money Concepts (SND/Liquidity), and Advanced Volume Profile, this suite replaces multiple different indicators with one optimized engine. Monitor up to 14 pairs simultaneously from a single chart, instantly identify market cycles, and seamlessly map institutional footprints with the click of a button. The Command Center
The indicator is built on a non-standard Zig Zag, it draws accumulations after which if the price leaves this zone and a test of this zone occurs, then a sound signal is given and an arrow appears - after the test candle closes.The indicator does not redraw its signals, it is very easy to use, there are only three settings 1- this is the zig zag parameter 2- this is the minimum price exit from the zone 3- this is the maximum price exit from the zone. The lower the parameter for Zig Zag, the more
ゴールドラッシュ・トレンド・アロー・シグナル ゴールドラッシュ・トレンド・アロー・シグナル 指標は、XAU/USDにおける高速・短期スキャルパー向けに最適化された、正確でリアルタイムのトレンド分析を提供します。 1分足専用に設計されたこのツールは、明確なエントリーポイントを示す方向矢印を表示し、スキャルパーが変動の激しい市場状況でも自信を持って取引できるよう支援します。 この指標は、PRIMARY(主要)とSECONDARY(補助)のアラート矢印で構成されています。PRIMARYシグナルは、トレンドの方向転換を示す白と黒の方向矢印であり、SECONDARYシグナルは、PRIMARY矢印が示す方向を確認し、潜在的なエントリーポイントを示す青と赤の矢印です。 注意:トレンド方向の変化後にPRIMARYアラート矢印が1つだけ表示される場合、複数のSECONDARY青/赤矢印が表示される点に注意が必要です。SECONDARYシグナルは、シグナル基準を満たす任意のローソク足後に表示されます。したがって、長期的なトレンド移動の場合、画面に多くのSECONDARY矢印が表示されます(添付の
多くの矢印インジケーターは、シグナルだけを表示して、その後の判断はすべてトレーダー任せです。KT Alpha Hunter Arrows は、最初から完成されたトレードプランを提供します。 各シグナル矢印が表示されると、エントリーライン、ストップロス、4つのテイクプロフィット水準、そして現在の銘柄と時間足を今トレードする価値があるかを示すリアルタイムのエッジ判定が、チャート上にまとめて描画されます。付属の Trade Manager EA は、手動でエントリーした後の管理をサポートし、相場が荒れて感情が揺れやすい場面でも、トレードの規律を保ちやすくします。リペイントなし。確定足のみでシグナルを表示。Forex、ゴールド、指数、その他あなたが取引するあらゆる銘柄向けに設計されています。 主な機能 リペイントしない買い・売り矢印。シグナルは足が確定した後にのみ表示されます。 各シグナルにエントリーライン、構造的なストップロス、4つのテイクプロフィット水準を表示。 Edge Dashboard が、現在のチャート上で買いと売りのセットアップを個別に評価。 判定システム:No Edge、Ma
OrderFlow Absorption – MT4用プロフェッショナル・デルタ&アブソープションシグナルインジケーター OrderFlow Absorptionで本物のオーダーフロー分析の力を解き放ちましょう。MetaTrader 4向けの究極のデルタヒストグラム&アブソープションシグナルインジケーターです。あらゆる価格変動の裏側で何が起きているのかを知りたいトレーダーのために設計されており、市場を動かす隠れた買い/売り圧力や吸収イベントを明らかにします。 特徴 デルタヒストグラムの可視化:   買い圧力・売り圧力を色分けされたヒストグラムで即座に表示。 アブソープションシグナル検出:   高度なロジックで強気・弱気の吸収イベントを特定し、反転の兆しを早期に通知。 チャートマーカー:   吸収シグナルをチャート上に直接マークし、視覚的に分かりやすく表示。 ポップアップアラート:   新しい吸収シグナルが出現した際にリアルタイムで通知。 カスタマイズ可能な閾値:   弱いシグナルを除外し、高確率のセットアップに集中。 リソース管理:   大きなチャートでも高速に動作する効率的な計算。
TrendMaestro
Stefano Frisetti
4 (4)
Attention: beware of SCAMS, TRENDMAESTRO is only ditributed throught MQL5.com market place. note: this indicator is for METATRADER4, if you want the version for METATRADER5 this is the link:  https://www.mql5.com/it/market/product/108106 TRENDMAESTRO ver 2.5 TRENDMAESTRO recognizes a new TREND from the start, he never makes mistakes. The certainty of identifying a new TREND is priceless. DESCRIPTION TRENDMAESTRO identifies a new TREND in the bud, this indicator examines the volatility, volumes a
There is always a need to measure if the market is "quiet" or it is volatile. One of the possible way is to use standard deviations, but the issue is simple : We do not have some levels that could help us find out if the market is in a state of lower or higher volatility. This indicator is attempting to do that : •           values above level 0 are indicating state of higher volatility (=GREEN buffer) •           values below level 0 are indicating state of lower volatility (=RED buffer)
Algo Trading Indicaor  With this indicator , you’ll have zones and trends that hight probability the price will reverse from it. so will gives you all the help that you need  MT5 Version                    https://www.mql5.com/en/market/product/170028 MT4 Version                    https://www.mql5.com/en/market/product/88034 Why should you join us !?  1-This indicator is logical since it’s working in previous days movement , to predict the future movements. 2-Algo trading indicator will hel
First time on MetaTrader, introducing IQ Star Lines - an original Vedic Astrology based indicator. "Millionaires don't use astrology, billionaires do" . - J.P. Morgan, Legendary American financier and banker. Welcome to  the new and updated  IQ Star Lines , the ultimate fusion of ancient planetary harmonic cycles and modern quantitative trading. published for the   first time on Metatrader. This is an indicator built by the developer, who has spent almost 2 decades trading while studying Vedic
Congestioni
Stefano Frisetti
5 (1)
This indicator is very usefull to TRADE Trading Ranges and helps identify the following TREND. Every Trader knows that any market stay 80% of the time in trading ranges and only 20% of the time in TREND; this indicator has been built to help traders trade trading ranges. Now instead of waiting for the next TREND, You can SWING TRADE on trading ranges with this simple yet very effective indicator. TRADING with CONGESTIONI INDICATOR: The CONGESTIONI Indicator identify a new trading range and ale
Trend Breakout Arrows Indicator The Trend Breakout Arrows Indicator is a momentum-based signal tool designed to identify potential bullish and bearish breakout opportunities. It displays clear arrow signals directly on the price chart, helping traders quickly recognize possible trend changes and continuation setups. Up Arrow (Buy Signal) A magenta up arrow appears below a candle when bullish momentum begins to strengthen. This signal indicates that buying pressure may be overtaking selling press
Smart4x Institutional Order Blocks v6.0 Advanced Smart Money Concepts (SMC) Indicator with Quality Scoring, Fibonacci Confluence & Multi-Timeframe Analysis The Ultimate Smart Money Trading Tool for Forex, Crypto, Indices, and Commodities Brand:   Smart4x Version:   6.0 Type:   MT4 Indicator Overview Smart4x Institutional Order Blocks v6.0   is a next-generation Smart Money Concepts indicator designed to scout, score, and filter institutional-grade order blocks with unparalleled precision. Bui
「 Dynamic Scalper System 」インジケーターは、トレンド波の中でスキャルピング取引を行う手法のために設計されています。 主要通貨ペアと金でテスト済みで、他の取引商品との互換性があります。 トレンドに沿った短期的なポジションオープンのシグナルを提供し、追加の価格変動サポートも提供します。 インジケーターの原理 大きな矢印はトレンドの方向を決定します。 トレンド波の中では、小さな矢印の形でスキャルピングシグナルを生成するアルゴリズムが機能します。 赤い矢印は強気方向、青い矢印は弱気方向です。 トレンドの方向には敏感な価格変動ラインが描かれ、小さな矢印のシグナルと連動します。 シグナルは次のように機能します。適切なタイミングでラインが現れるとエントリーシグナルが形成され、ラインが開いている間はポジションが保持され、完了すると取引が終了します。 推奨される動作時間枠はM1~H4です。 矢印は現在のローソク足に形成され、次のローソク足が開いている場合は、前のローソク足の矢印は再描画されません。 入力パラメータ Trend Wave Period - トレンド方向
Route Lines Prices -は、価格の方向性を予測するために設計されたインジケーターです。シンプルなインターフェースには、価格変動と将来の方向性を計算するための複数のアルゴリズムが搭載されています。これらのアルゴリズムには、使用する時間枠に基づいたボラティリティ計算と価格平滑化が含まれています。 このインジケーターには、「 Calculating price values 」値を変更するためのパラメーターが1つだけあります。デフォルト値の1は、バランスの取れた自動計算を提供し、インジケーターを手動で設定することなく使用できます。 値を2から500まで手動で変更することで、インジケーターを独自のトレーディングシステムに合わせてカスタマイズできます。 このインジケーターは、M1からH4の時間枠での使用を推奨します。あらゆる取引銘柄で使用できます。 シグナル矢印はローソク足の終値で生成され、過去の履歴には再描画されません。 メインチャートには、重複した矢印が表示されます。 複数のアラートタイプが利用可能です。内蔵のライン軌跡カウンターは、終値に基づいて動作します。これ
TRADING STRATEGY GUIDE DELIVERY The full Trading Strategy Guide will be sent directly to you after purchase. Just message me on MQL5 and ask for it — you'll receive it instantly, along with priority support and setup help. Powered Market Scanner for Smart Trading Decisions keypad support resistance logic 1  is a next-generation MT4 trading system built for serious traders who demand precision, reliability, and clarity. It combines advanced smart filters with real-time price structure logic to
一款信号统计指标(MT4)——实现基于当前图表周期下的单线MA转向和双线MA金叉/死叉统计 . 转向定义:前一K向下或走平,当前K向上,视为转向向上;反之,转向向下。 金死叉定义:前一K快线在慢线下方,当前K快线在慢线上方,为金叉;反之,死叉。 参数及使用说明: 1、可指定统计K线数。 2、可指定4个不同的日内时间段,格式如"03:00-07:59",4个时间段可交叉任意输入。 3、可配置ABC三个浮盈区间段点值。如:分界区间统计小点值设为500,即当某转向信 号出现后到下一反向信号止浮盈<=此点值,计入A区间; 若大于此点值<大分界点值时,计入B区间;若大于“大分界点值”计入C区间。 4、最大/最小浮盈统计。显示所有统计区间内的最大浮盈点值和最小浮盈点值(亏损点值)。 5、输出完整信号,按信号出现顺序排列,如“ACCBCA”之类。 6、综合预测。使用概率、周期、趋势、马尔可夫链等综合概算输出预测该信号出现的归类概率值。 7、加载指定MA线。在当前图表自动载入相应设置的MA线。 8、自适应列宽。以完整显示统计信号数。 9、用法:点击相应统计按钮即输出相应的统计表格.
Trend Signal Advanced System - ド向けのトレンドフォロー型エントリーシグナルを提供するトレーディングシステムです。シグナル矢印は現在のローソク足上に描画され、チャートの上下にシグナルを生成します。トレンドは「標準偏差」指標に基づいており、あらゆる取引銘柄のボラティリティに合わせて柔軟かつカスタマイズ可能なパラメータを設定できます。 このトレーディングシステムには、適切な利益確定レベルと損切りレベルを設定できるプランナーが搭載されており、バックテストを行うことができます。 潜在的な取引シグナル軌跡ライン シグナル矢印から損切りポイント(SLおよびTPレベル)までのシグナルカウンターは、ローソク足の始値に基づいて計算されます。 M1からH4までの様々な時間枠に対応し、スキャルピングやデイトレードに適しています。 シグナル矢印の「買い」と「売り」のアラート機能が利用可能です。 ほとんどのシグナルは再描画なしで動作しますが、場合によっては現在のローソク足上で矢印が点滅することがあります。 統計モニターを使用すると、選択した取引銘柄と時間枠で、トレーディングシ
MagicTrigger — マルチタイムフレーム HD/RD ダイバージェンス確認インジケーター MagicTrigger は、上位足(HD)における構造的ダイバージェンスを検出し、同一の価格ゾーン内で下位足(RD)に現れる一致したダイバージェンスによる確認を待つ、マルチタイムフレームのダイバージェンス検出エンジンです。上位足のスイング構造と下位足の確認が一致した場合にのみ、インジケーターはシグナルをマークし、推奨エントリートリガー、ストップロス、2つのターゲットレベルを同時に表示します。 動作の仕組み インジケーターは、チャートの現在の期間の上下にある一連のタイムフレームをスキャンします。上位足では、価格のスイングとスムージングされたオシレーターラインとの間のダイバージェンスパターン(「HD」ダイバージェンス)を探します。次に、HD構造によって定義された時間・価格ゾーン内で、下位足にも同じ方向のダイバージェンス(「RD」ダイバージェンス)が現れているかを確認します。シグナルは、必要な最小数の下位足が上位足の構造を確認した場合にのみ生成され、単一タイムフレームの孤立したダイバージェン
VTrende Pro MT4 - MTF indicator for trend trading with a display panel for MT5 *** Videos can be translated into any language using subtitles (video language - Russian) Although the signals of the VTrende Pro indicator can be used as signals of a full-fledged trading system, it is recommended to use them in conjunction with the Bill Williams TS. VTrende Pro  MT4 is an extended version of the VTrende indicator. Difference between Pro version and VTrende: - Time zones - Signal V - signal 1-2 wave
GoldScalperX V2 PRO Institutional-Style Gold Scalping for Serious Traders Gold doesn’t forgive hesitation. GoldScalperX V2 PRO was built for traders who operate with speed, discipline and structure. This is not a “random arrow indicator.” This is a precision scalping framework engineered for XAUUSD volatility. Why Most Gold Traders Fail They: Enter too early Chase breakouts Trade noise Ignore volatility expansion Blow prop challenges GoldScalperX V2 PRO filters the chaos. It highlights onl
作者のその他のプロダクト
MagicTrigger — マルチタイムフレーム HD/RD ダイバージェンス確認インジケーター MagicTrigger は、上位足(HD)における構造的ダイバージェンスを検出し、同一の価格ゾーン内で下位足(RD)に現れる一致したダイバージェンスによる確認を待つ、マルチタイムフレームのダイバージェンス検出エンジンです。上位足のスイング構造と下位足の確認が一致した場合にのみ、インジケーターはシグナルをマークし、推奨エントリートリガー、ストップロス、2つのターゲットレベルを同時に表示します。 動作の仕組み インジケーターは、チャートの現在の期間の上下にある一連のタイムフレームをスキャンします。上位足では、価格のスイングとスムージングされたオシレーターラインとの間のダイバージェンスパターン(「HD」ダイバージェンス)を探します。次に、HD構造によって定義された時間・価格ゾーン内で、下位足にも同じ方向のダイバージェンス(「RD」ダイバージェンス)が現れているかを確認します。シグナルは、必要な最小数の下位足が上位足の構造を確認した場合にのみ生成され、単一タイムフレームの孤立したダイバージェン
Unlock the power of "Psychological Numbers" with RoundLevel . Large financial institutions, banks, and hedge funds don't place orders at random prices; they prefer round numbers (e.g., 1.1000, 105.00, 2000). These levels act as invisible magnets for price action, serving as high-probability support and resistance zones. Key Features: Universal Compatibility: Works perfectly on Forex, Gold (XAUUSD), Indices, and Stocks. Clean Visualization: Automatically draws horizontal levels without cluttering
Persian Ichimoku Pro: The Fibonacci Evolution for MT4 Why settle for 1930s formulas when you can trade with 21st-century precision? Most traders fail with Ichimoku because they use static, outdated settings.   Persian Ichimoku Pro   breaks these limits by integrating   Advanced Fibonacci Mathematics   and the exclusive   Future Quality Line —a combination never seen before in standard indicators. ### THE "UNFAIR ADVANTAGE": WHAT’S INSIDE? 1. The Quality Line (Your Trend Sentinel) This is the "S
MGH-CrossAlert — Multi-Line, Multi-Timeframe Crossover Alert Indicator MGH-CrossAlert is a crossover detection indicator for MetaTrader 5 that monitors two user-selected lines and generates alerts when they cross or reach equality. Unlike standard moving average crossover tools, this indicator supports a wide range of line types and allows each line to be drawn from an independent timeframe. Supported Line Types Each of the two monitored lines can be configured independently as one of the follo
Overview MGH-CrossAlert Histogram is a sub-window histogram indicator for MetaTrader 5. It displays the relationship between any two configurable lines as a color-coded histogram bar by bar, showing which line is dominant, how large the gap between them is, and when a crossover occurs. The histogram runs in a separate sub-window, keeping the price chart uncluttered. How It Works Each bar on the histogram reflects the live relationship between the two selected lines: Green — Line 1 is above Line
Overview MGH-MultiMACD-RD is a multi-timeframe MACD divergence indicator for MetaTrader 4. It monitors up to 6 timeframes simultaneously on a single chart, detects both regular and hidden divergences, and delivers alerts when a divergence is confirmed. The indicator was developed to address three common limitations found in standard MACD divergence tools: single-timeframe analysis, signal repainting, and inconsistent divergence line drawing. Key Features Multi-Timeframe Analysis The indicator di
Multi-Timeframe MACD Hidden Divergence Detector The trend continuation signal most traders never see — now detected automatically across 6 timeframes. Overview Regular divergence tells you when a trend may be reversing. Hidden divergence tells you when it is about to continue — and it is the signal that professional trend-following traders rely on most. The problem is that hidden divergence is significantly harder to spot than regular divergence, and virtually no indicator on MQL5 Market detect
MGH-MultiStoch — Multi-Timeframe Trend Detection and Wave Analysis MGH-MultiStoch is a multi-timeframe trend indicator that displays up to 6 timeframes simultaneously in one window. It helps traders confirm trend direction across timeframes, count market waves visually, and build forward-looking wave scenarios based on higher-timeframe crosses. The indicator uses a custom multi-timeframe calculation method developed specifically for this product. It is available for both MetaTrader 4 and MetaTra
Elevate your trading with the precision of "Big Figures." Financial markets are not driven by random numbers; they are driven by institutional liquidity. Central banks, hedge funds, and major commercial traders consolidate their orders at whole integer levels (e.g., 1.1000, 2000.00, 150.00). These are the "Psychological Magnets" where the real price action happens. RoundLevel Pro for MetaTrader 5 is a high-performance tool designed to visualize this invisible grid of institutional interest with
Persian Ichimoku Pro: The Fibonacci Evolution for MT5 Why settle for 1930s formulas when you can trade with 21st-century precision? Most traders fail with Ichimoku because they use static, outdated settings. Persian Ichimoku Pro breaks these limits by integrating Advanced Fibonacci Mathematics and the exclusive Future Quality Line —a combination never seen before in standard indicators. ### THE "UNFAIR ADVANTAGE": WHAT’S INSIDE? 1. The Quality Line (Your Trend Sentinel) This is the "Secret Sauce
MGH-CrossAlert — Multi-Line, Multi-Timeframe Crossover Alert Indicator MGH-CrossAlert is a crossover detection indicator for MetaTrader 5 that monitors two user-selected lines and generates alerts when they cross or reach equality. Unlike standard moving average crossover tools, this indicator supports a wide range of line types and allows each line to be drawn from an independent timeframe. Supported Line Types Each of the two monitored lines can be configured independently as one of the follo
Overview MGH-CrossAlert Histogram is a sub-window histogram indicator for MetaTrader 5. It displays the relationship between any two configurable lines as a color-coded histogram bar by bar, showing which line is dominant, how large the gap between them is, and when a crossover occurs. The histogram runs in a separate sub-window, keeping the price chart uncluttered. How It Works Each bar on the histogram reflects the live relationship between the two selected lines: Green — Line 1 is above Line
Overview MGH-MultiMACD-RD is a multi-timeframe MACD divergence indicator for MetaTrader 5. It monitors up to 6 timeframes simultaneously on a single chart, detects both regular and hidden divergences, and delivers alerts when a divergence is confirmed. The indicator was developed to address three common limitations found in standard MACD divergence tools: single-timeframe analysis, signal repainting, and inconsistent divergence line drawing. Key Features Multi-Timeframe Analysis The indicator di
Multi-Timeframe MACD Hidden Divergence Detector The trend continuation signal most traders never see — now detected automatically across 6 timeframes. Overview Regular divergence tells you when a trend may be reversing.   Hidden divergence tells you when it is about to continue   — and it is the signal that professional trend-following traders rely on most. The problem is that hidden divergence is significantly harder to spot than regular divergence, and virtually no indicator on MQL5 Market det
MGH-MultiStoch — Multi-Timeframe Trend Detection and Wave Analysis (MT5) MGH-MultiStoch is a multi-timeframe trend indicator that displays up to 6 timeframes simultaneously in one window. It helps traders confirm trend direction across timeframes, count market waves visually, and build forward-looking wave scenarios based on higher-timeframe crosses. This is the MetaTrader 5 version. Because MT5 supports a wider range of timeframes, this version adds full per-line timeframe selection, so you ca
MGH-MagicLine — Trend & Multi-Timeframe Divergence in One Tool MagicLine combines trend detection and divergence analysis into a single indicator — a refined alternative to running MultiStoch and MultiMACD separately, with cleaner output and less lag. It is a confirmation and analysis tool . It does not give entry points, Take Profit or Stop Loss. Instead, it adds a strong, flexible confirmation layer that fits almost any trend-based strategy and helps you read the market with more clarity. Thr
MagicTrigger — マルチタイムフレーム HD/RD ダイバージェンス確認インジケーター(MT5版) MagicTrigger は、上位足(HD)における構造的ダイバージェンスを検出し、同一の価格ゾーン内で下位足(RD)に現れる一致したダイバージェンスによる確認を待つ、マルチタイムフレームのダイバージェンス検出エンジンです。上位足のスイング構造と下位足の確認が一致した場合にのみ、インジケーターはシグナルをマークし、推奨エントリートリガー、ストップロス、2つのターゲットレベルを同時に表示します。 このMetaTrader 5版は、標準期間に加えて、M2、M3、M4、M6、M12、M20、H2、H3、H6、H8、H12を含む、MT5で利用可能な期間の全範囲を使用してタイムフレームチェーンを構築します。インジケーターが設定されるタイムフレームによって、スキャンチェーンは最大15のタイムフレームを含むことができ、標準的なMT4の期間セットのみで構築されたチェーンよりも、明らかにきめ細かいマルチタイムフレーム構造のビューを提供します。 動作の仕組み インジケーターは、チャートの現在の期
フィルタ:
zahra g.h
161
zahra g.h 2026.08.02 15:14 
 

ユーザーは評価に対して何もコメントを残しませんでした

Ashkan
167
Ashkan 2026.07.26 18:16 


 

ユーザーは評価に対して何もコメントを残しませんでした

Ali Ghandi
129
Ali Ghandi 2026.07.25 02:07 
 

ユーザーは評価に対して何もコメントを残しませんでした

mohsen yari
108
mohsen yari 2026.07.23 06:54 
 

ユーザーは評価に対して何もコメントを残しませんでした

Mostafa Ghanbari
3569
開発者からの返信 Mostafa Ghanbari 2026.07.24 03:30
Glad to hear that! 🙏
Hossein Nabi
168
Hossein Nabi 2026.07.23 00:15 
 

ユーザーは評価に対して何もコメントを残しませんでした

Mostafa Ghanbari
3569
開発者からの返信 Mostafa Ghanbari 2026.07.24 03:30
Really appreciate these kind words! Glad the quality is coming through and meeting your expectations 🙏
Farzaneh140540
155
Farzaneh140540 2026.07.22 21:00 
 

ユーザーは評価に対して何もコメントを残しませんでした

Mostafa Ghanbari
3569
開発者からの返信 Mostafa Ghanbari 2026.07.24 03:29
Glad to hear that! 🙏
1006053015
85
1006053015 2026.07.22 19:52 
 

ユーザーは評価に対して何もコメントを残しませんでした

Mostafa Ghanbari
3569
開発者からの返信 Mostafa Ghanbari 2026.07.24 03:29
Great to hear! Glad the trend modes, MTF lines, and regular/hidden divergence combo are simplifying your analysis without needing to stack multiple indicators 🙏
Mohammad Azadjami
159
Mohammad Azadjami 2026.07.21 15:38 
 

ユーザーは評価に対して何もコメントを残しませんでした

Mostafa Ghanbari
3569
開発者からの返信 Mostafa Ghanbari 2026.07.24 03:28
Appreciate the balanced feedback! Glad the entries are coming through clear, and great point about tightening money management and stops on lower timeframes 🙏
Mahmoudrezakheiri
168
Mahmoudrezakheiri 2026.07.21 04:25 
 

ユーザーは評価に対して何もコメントを残しませんでした

Mostafa Ghanbari
3569
開発者からの返信 Mostafa Ghanbari 2026.07.24 03:28
Thank you so much! Glad the magic lines are proving helpful in your trading decisions 🙏
Parsaei
164
Parsaei 2026.07.20 21:14 
 

ユーザーは評価に対して何もコメントを残しませんでした

Mostafa Ghanbari
3569
開発者からの返信 Mostafa Ghanbari 2026.07.21 00:52
Really appreciate that! Glad it's proving valuable in your trading toolkit 🙏
محمدجواد حیدرزاده
29
محمدجواد حیدرزاده 2026.07.20 18:19 
 

ユーザーは評価に対して何もコメントを残しませんでした

Mostafa Ghanbari
3569
開発者からの返信 Mostafa Ghanbari 2026.07.21 00:56
Appreciate that! Glad you're finding it useful 🙏
aminaran
168
aminaran 2026.07.19 20:49 
 

ユーザーは評価に対して何もコメントを残しませんでした

Mostafa Ghanbari
3569
開発者からの返信 Mostafa Ghanbari 2026.07.19 23:58
Thank you very much! 🙏
mehdi emrahpour
99
mehdi emrahpour 2026.07.19 20:34 
 

ユーザーは評価に対して何もコメントを残しませんでした

Mostafa Ghanbari
3569
開発者からの返信 Mostafa Ghanbari 2026.07.19 23:58
Thank you for the kind words! Glad it's helping your trading 🙏
alisaadat
167
alisaadat 2026.07.19 17:52 
 

ユーザーは評価に対して何もコメントを残しませんでした

Mostafa Ghanbari
3569
開発者からの返信 Mostafa Ghanbari 2026.07.21 00:54
Really glad you're enjoying it! 🙏
Mohammad panahi
169
Mohammad panahi 2026.07.19 16:38 
 

ユーザーは評価に対して何もコメントを残しませんでした

Mostafa Ghanbari
3569
開発者からの返信 Mostafa Ghanbari 2026.07.19 23:56
Thank you so much for this wonderful review! It truly means a lot to hear that both the indicator and the support experience have met your expectations. Providing responsive and professional support is something we take seriously, and feedback like yours motivates us to keep improving the product further. We're glad the indicator is performing exactly as described and adding real value to your trading. Thanks again for taking the time to share such detailed and encouraging feedback — it's genuinely appreciated 🙏
HAMED HAJI AHMADI
149
HAMED HAJI AHMADI 2026.07.19 16:08 
 

ユーザーは評価に対して何もコメントを残しませんでした

Mostafa Ghanbari
3569
開発者からの返信 Mostafa Ghanbari 2026.07.19 23:54
Thank you so much! 🙏
alifakhroddin
95
alifakhroddin 2026.07.19 14:43 
 

ユーザーは評価に対して何もコメントを残しませんでした

Mostafa Ghanbari
3569
開発者からの返信 Mostafa Ghanbari 2026.07.19 23:53
Thank you! Glad it's working well for spotting divergences 🙏
Ben_Ns
164
Ben_Ns 2026.07.19 13:03 
 

ユーザーは評価に対して何もコメントを残しませんでした

Mostafa Ghanbari
3569
開発者からの返信 Mostafa Ghanbari 2026.07.19 23:53
Thank you very much! Really glad it's performing as expected and adding value to your trading. Appreciate the recommendation 🙏
ems ri
170
ems ri 2026.07.19 11:41 
 

ユーザーは評価に対して何もコメントを残しませんでした

Mostafa Ghanbari
3569
開発者からの返信 Mostafa Ghanbari 2026.07.19 23:52
Thank you for the great feedback! That's exactly the goal — bringing more structure to the trading process so decisions become faster and more consistent. Glad it's improving your trade management 🙏
mohammadparsa1365
55
mohammadparsa1365 2026.07.19 10:52 
 

ユーザーは評価に対して何もコメントを残しませんでした

Mostafa Ghanbari
3569
開発者からの返信 Mostafa Ghanbari 2026.07.19 23:51
Thank you very much for the thoughtful review! Really glad the indicator is helping you spot key price levels while keeping your chart clean and organized. Appreciate the recommendation 🙏
12
レビューに返信