Multi Macd RD MT5
- インディケータ
- バージョン: 1.0

Overview
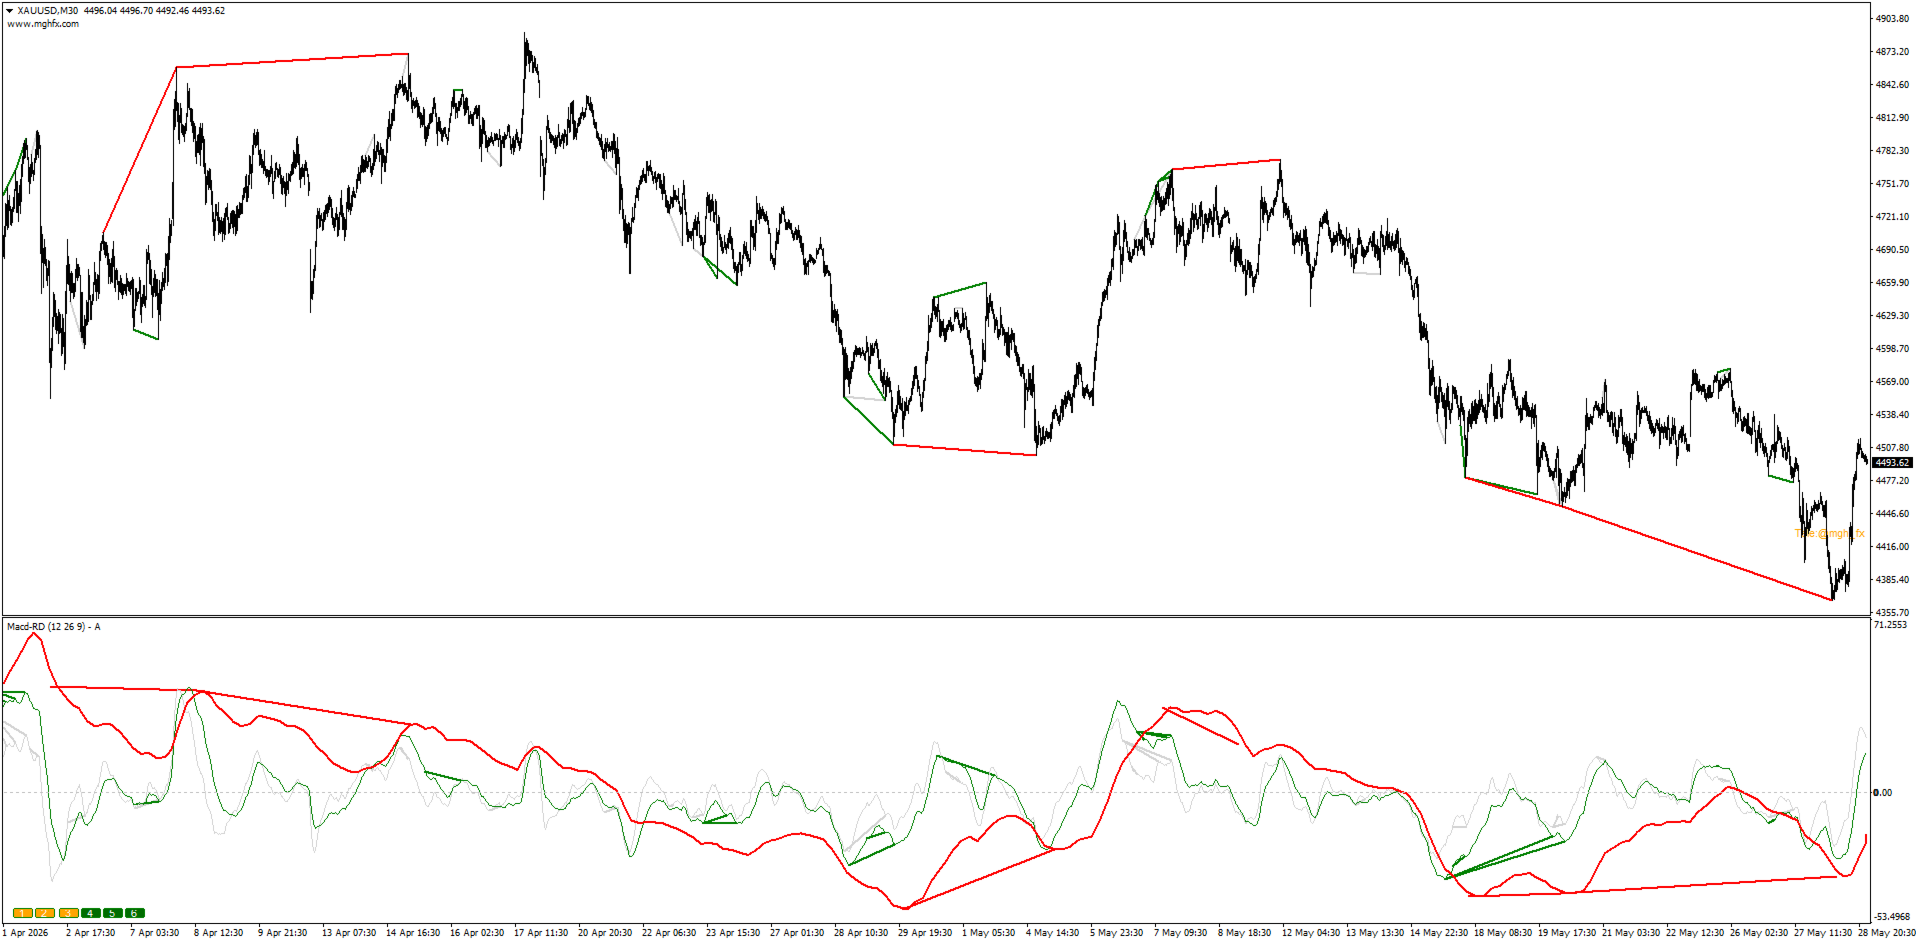
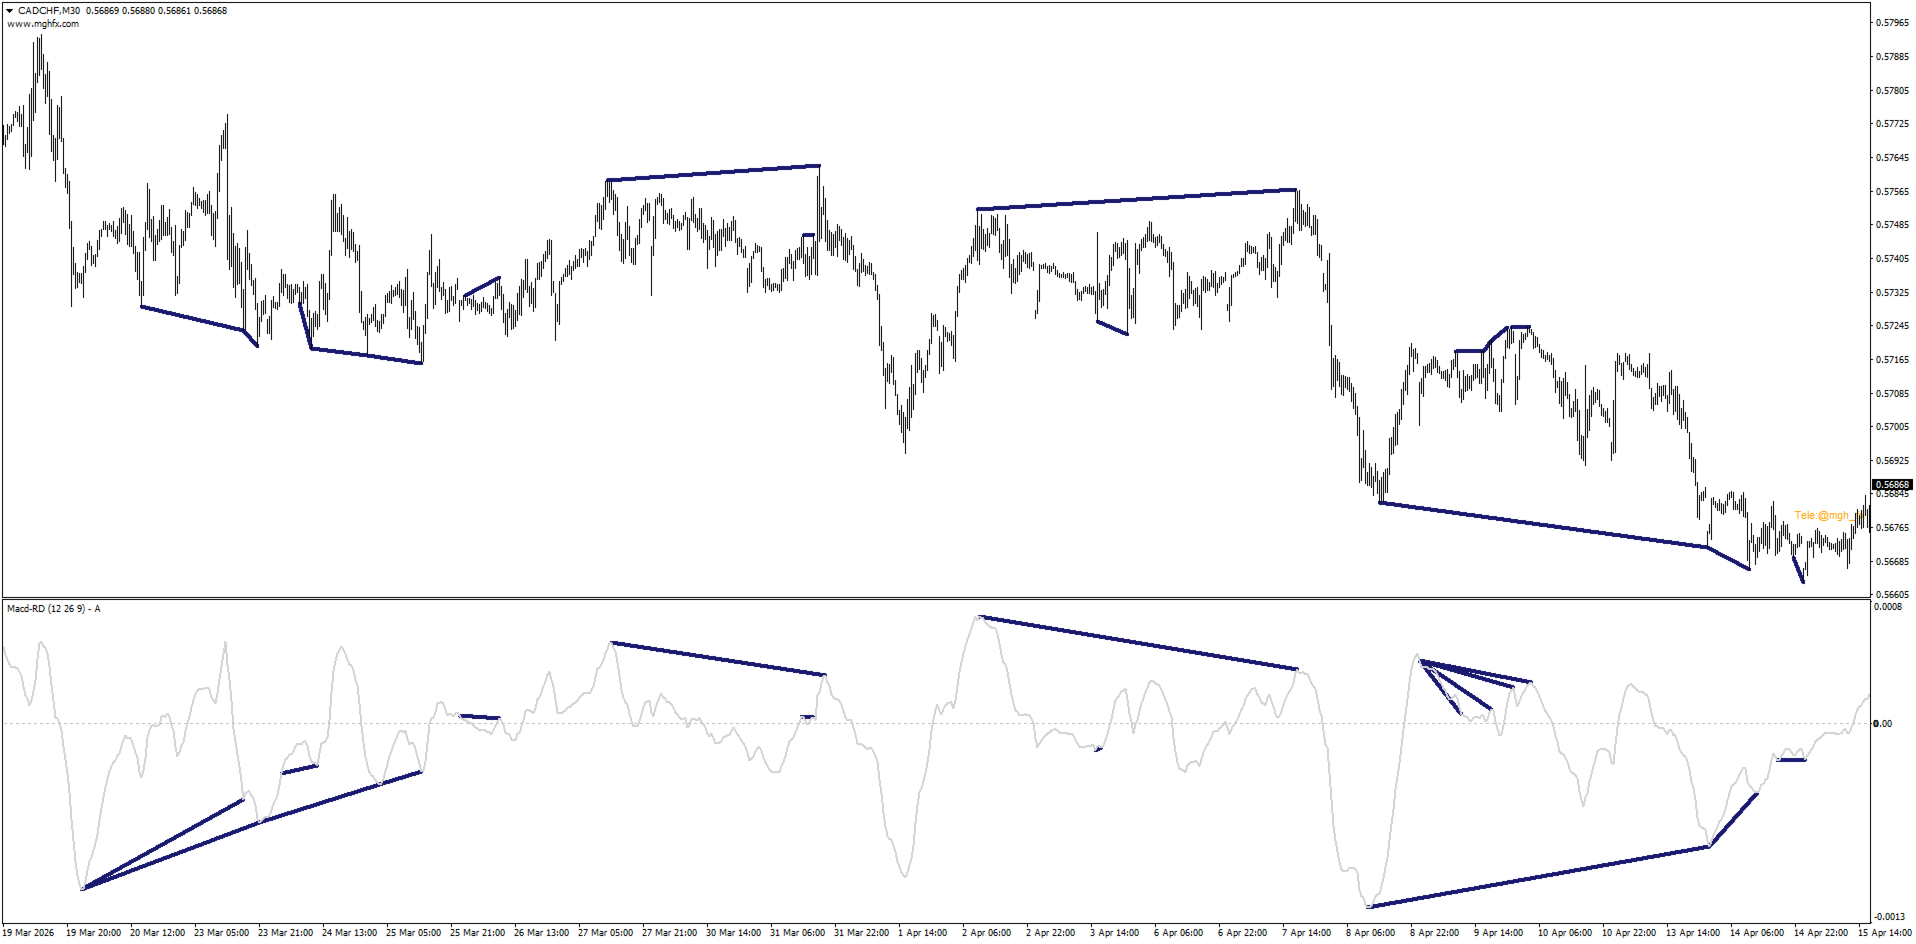
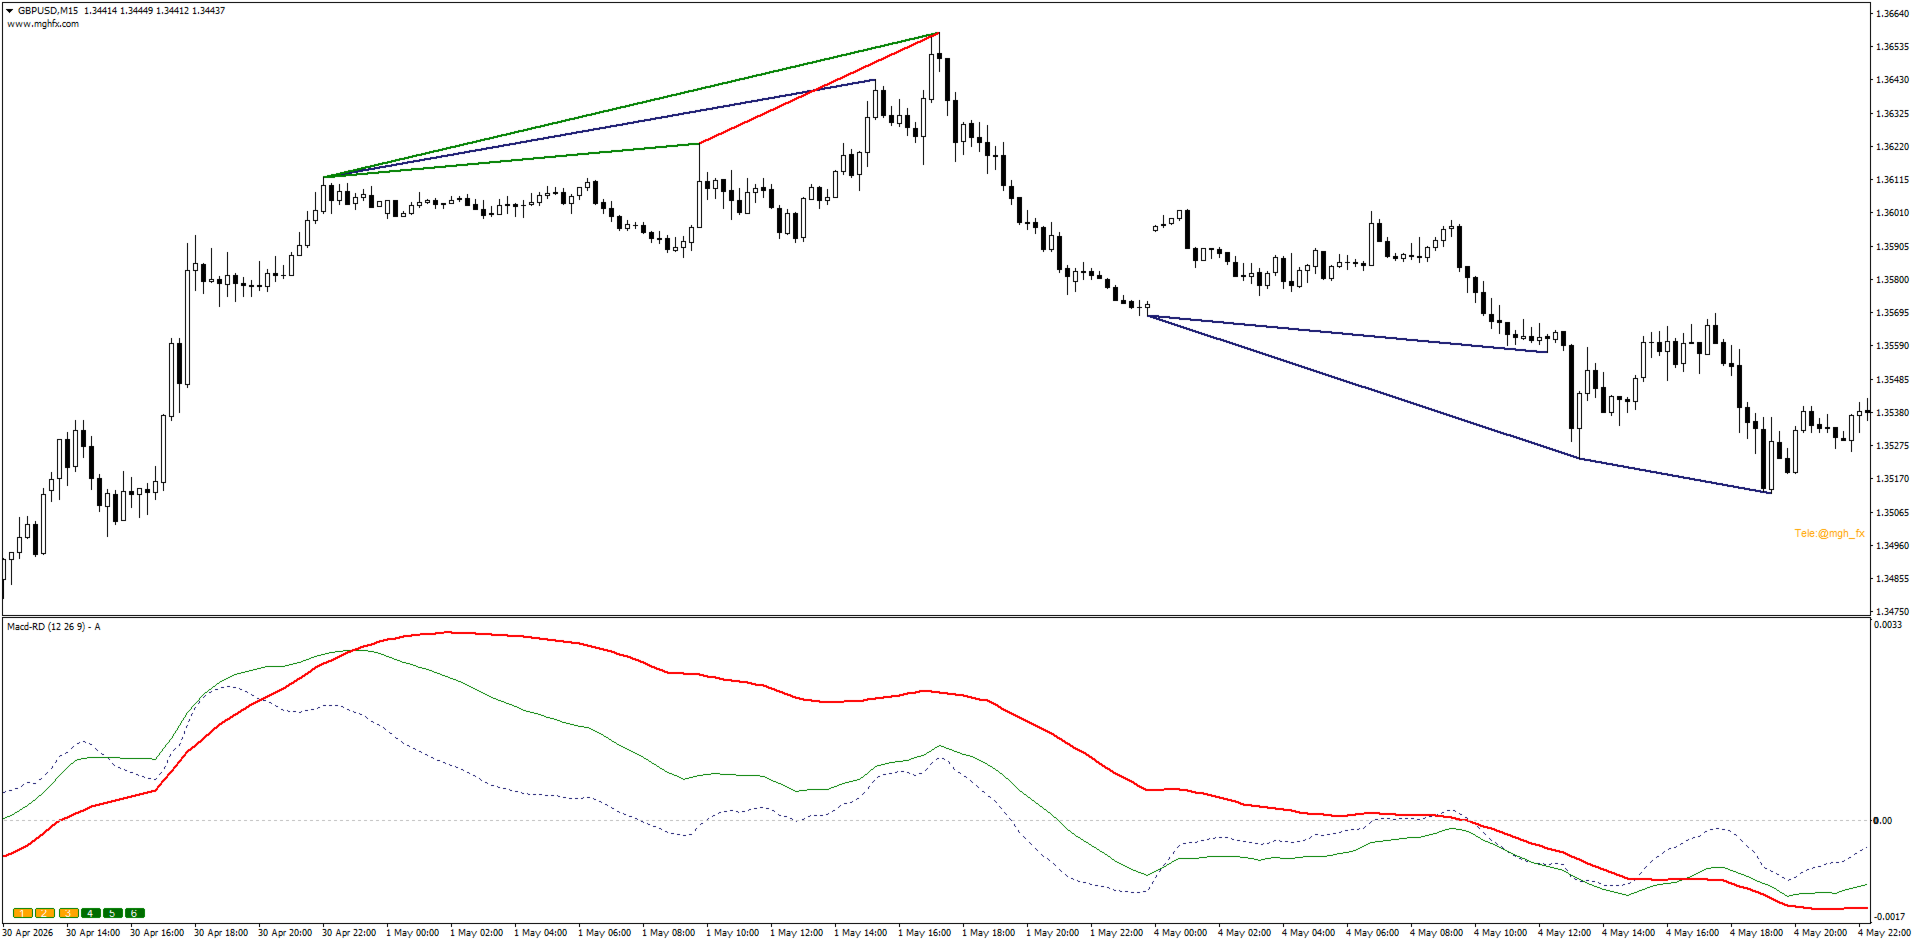
MGH-MultiMACD-RD is a multi-timeframe MACD divergence indicator for MetaTrader 5. It monitors up to 6 timeframes simultaneously on a single chart, detects both regular and hidden divergences, and delivers alerts when a divergence is confirmed.
The indicator was developed to address three common limitations found in standard MACD divergence tools: single-timeframe analysis, signal repainting, and inconsistent divergence line drawing.
Key Features
Multi-Timeframe Analysis
The indicator displays MACD data from the current timeframe plus up to 5 higher timeframes on a single chart window. Each timeframe is assigned a distinct color for easy identification. Timeframes can be enabled or disabled from the settings panel or using the on-chart buttons (1–6).
Repaint Control
Signals can be configured to trigger on candle 0 (real-time) or candle 1 (confirmed, closed candle). When set to candle 1, signals will not be redrawn after the fact.
Divergence Detection
The indicator detects regular and hidden divergences across all active timeframes. The "Increase Divergence Range" parameter extends the lookback period to catch divergences between more distant swing points.
Multi-Timeframe Confluence
When divergences from two or more timeframes occur within the same price zone, the indicator highlights this overlap. Traders can use these confluence zones as part of their analysis workflow.
Alert System
Alerts can be configured for the following events:
- MACD phase change (zero-line cross)
- Histogram or signal line cross
- Divergence confirmation
Alerts support sound (including custom .wav files), email, and push notifications.
Interpolation Mode
When enabled, higher-timeframe MACD lines are displayed with smooth curves rather than stepped lines.
Visual Customization
- Per-timeframe divergence line colors (matched to the MACD line color)
- Divergence lines can be displayed on the price chart, the indicator sub-window, or both
- Adjustable line style and width for each timeframe layer
- Logo display is toggleable from settings
How to Use
- Attach the indicator to any chart.
- Enable the desired timeframes using buttons 1–6 or from the Inputs tab.
- Set alert preferences as needed.
- Choose candle 0 or candle 1 depending on whether real-time or confirmed signals are preferred.
A useful approach is to use single-timeframe divergences as confirmation for an existing strategy, and pay closer attention when multiple timeframes show divergence in the same price zone.
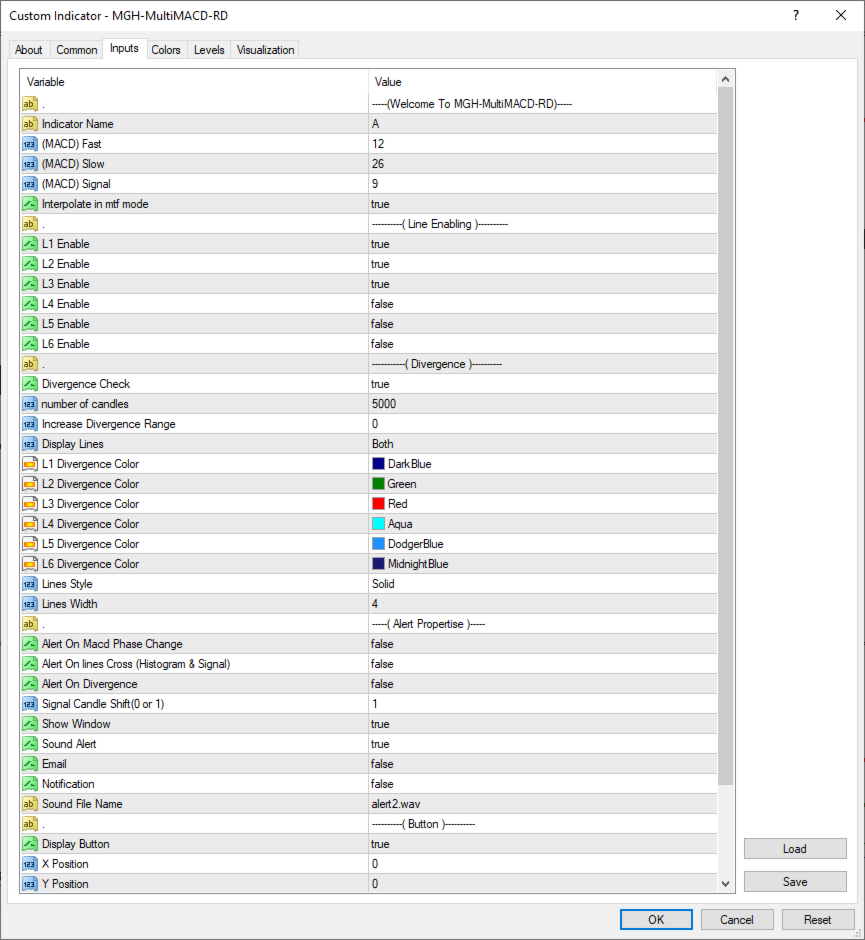
Settings Reference
| Parameter | Description |
|---|---|
| Indicator Name | Label shown in the chart window |
| Number of Candles | Lookback period (0 = full history) |
| MACD Fast / Slow / Signal | Standard MACD parameters (default 12/26/9) |
| Interpolate in MTF Mode | Smooth higher-TF MACD lines |
| L1–L6 Enable | Enable/disable each timeframe layer |
| Divergence Check | Enable divergence detection |
| Increase Divergence Range | Extend lookback for distant divergences |
| Display Lines | Show on chart, indicator window, or both |
| L1–L6 Divergence Color | Per-timeframe divergence line color |
| Lines Style / Width | Visual styling of divergence lines |
| Alert On Phase Change | Alert when MACD crosses zero |
| Alert On Lines Cross | Alert on histogram/signal cross |
| Alert On Divergence | Alert on divergence detection |
| Signal Candle Shift (0 or 1) | 0 = real-time, 1 = confirmed (no repaint) |
| Show Window | Display indicator sub-window |
| Sound / Email / Notification | Alert delivery method |
| Sound File Name | Custom .wav sound file |
| Display Button | Show/hide on-chart buttons |
| X / Y Position | Button position on chart |
Technical Specifications
- Platform: MetaTrader 5
- Indicator type: MACD-based divergence, multi-timeframe
- Repaint: No (when Signal Candle Shift = 1)
- Alerts: Sound, Email, Push Notification
- Default MACD settings: 12 / 26 / 9
- Timeframes supported: Current TF + up to 5 higher TFs simultaneously
A demo version is available for testing before purchase.
MT4 Version : https://www.mql5.com/en/market/product/179049


Thank you very good