REX complete 3in1

This is the complete REX package. It consists of the lite, pro and ULTRA version. 


Perfect for beginners and intermediates.

REX complete is 100% non repaint.

The strategy is based on a mix of different strategies, statistics, including pivot points, oscillators and patterns. 

As the trading idea consists of a variety of some classic indicators like Momentum, Williams Percent Range, CCI, Force Index, WPR, DeMarker, CCI, RSI and Stochastic, it is clear that the fundamental indicators have being used with different parameters.

An integrated trend reversal function allows it to combine the arrow with the trend indicator. It is advisable to combine it with ZigZag, Parabolic SAR, 100 SMA or Elliot waves indicator.

You will get a lot of high quality signals a day ( 5-15 ) per asset! ( M1)

The main goal was to keep it as simple as possible!


---   FEEL FREE TO DOWNLOAD THE FREE DEMO VERSION   ---


REXlite https://www.mql5.com/en/market/product/31101

REXpro https://www.mql5.com/en/market/product/30706

REXultra https://www.mql5.com/en/market/product/30898


Important

  • period - the number of bars you can backtest the strategy is only limited to your data history
  • TF - the higher the timeframe, less actions you will get but the pips will be much higher. It is recommend to use it on M1 and M5 first to get used to this strategy.
  • You can use REX on the following TFs:
    • M1
    • M5
    • M15
    • M30
    • H1
    • H4
    • D1
  • Assets - We recommend to use the indicator on the majors. Be careful trading low volume assets.
  • Trading hours - Avoid news and market closure / opening.

The trend ( and REX ) is your friend.


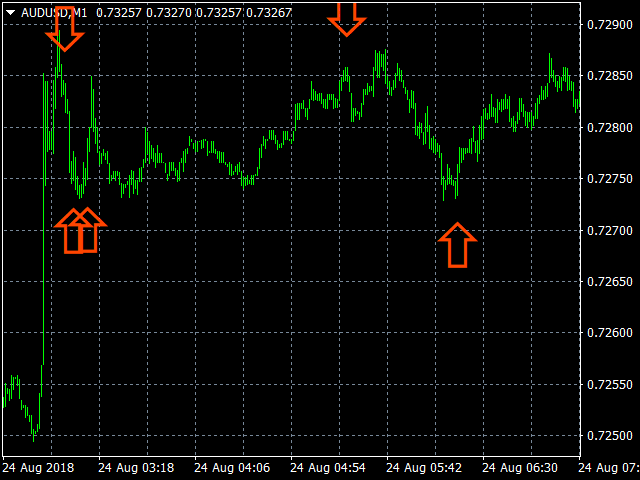
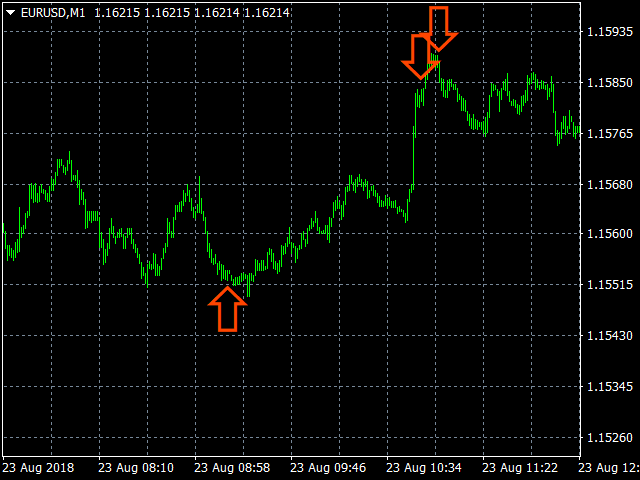
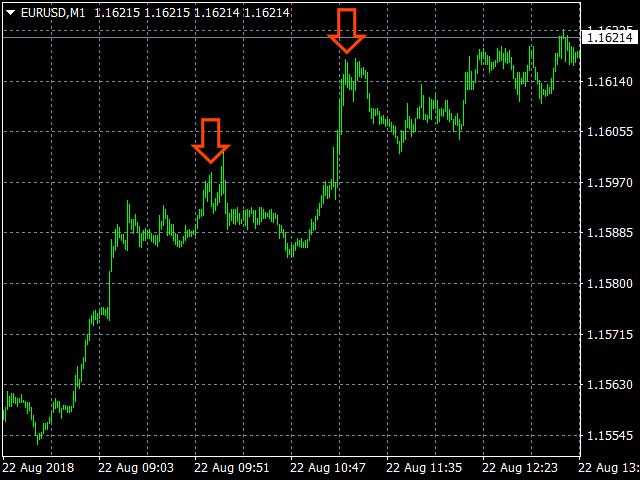
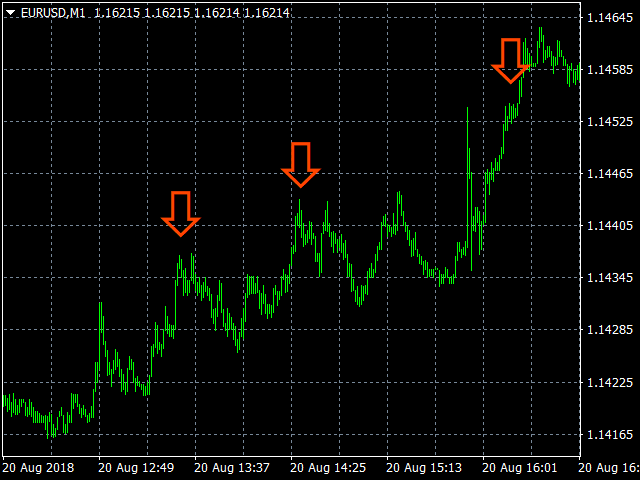
These are the rules to enter a trade

CALL:

  • Check the trend. Only trade with the trend
  • Take care of SUPP/RES zones and trendlines
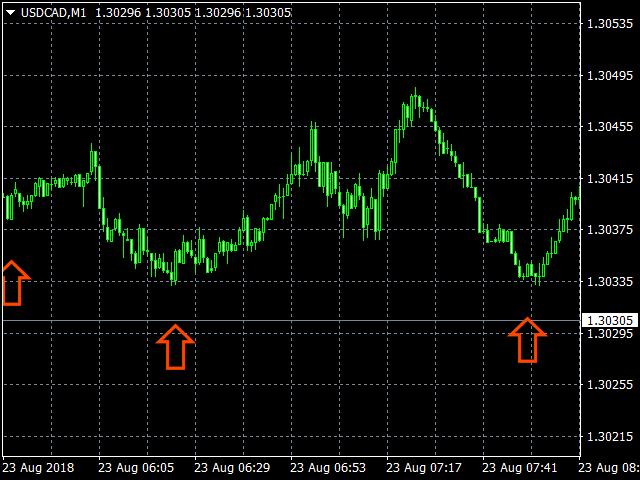
  • Take a trade on the next candle once the arrow appears ( BO M1: 5-15 min CALL option )

PUT:

  • Check the trend. Only trade with the trend
  • Take care of SUPP/RES zones and trendlines
  • Take a trade on the next candle once the arrow appears ( BO M1: 5-15 min PUT option )

Take a look at the trading examples and follow the simple rules. That's it!


おすすめのプロダクト
VR Cub
Vladimir Pastushak
VR Cub は、質の高いエントリーポイントを獲得するためのインジケーターです。このインジケーターは、数学的計算を容易にし、ポジションへのエントリーポイントの検索を簡素化するために開発されました。このインジケーターが作成されたトレーディング戦略は、長年にわたってその有効性が証明されてきました。取引戦略のシンプルさはその大きな利点であり、初心者のトレーダーでもうまく取引することができます。 VR Cub はポジション開始ポイントとテイクプロフィットとストップロスのターゲットレベルを計算し、効率と使いやすさを大幅に向上させます。取引の簡単なルールを理解するには、以下の戦略を使用した取引のスクリーンショットを見てください。 設定、設定ファイル、デモ版、説明書、問題解決方法は、以下から入手できます。 [ブログ] レビューを読んだり書いたりすることができます。 [リンク] のバージョン [MetaTrader 5] エントリーポイントの計算ルール ポジションをオープンする エントリーポイントを計算するには、VR Cub ツールを最後の高値から最後の安値までストレッチする必要があります。 最初
Alpha Trend signは私たちの取引システムを検証し、取引信号を明確に提示し、信号がドリフトすることはありません。 主な機能: •市場が活況を示している地域に応じて、指標に基づいて現在の相場がトレンド相場に属しているか、それとも揺れ相場に属しているかを直感的に判断することができる。 そして、指標の指示矢印に基づいて市場に切り込み、緑の矢印は購入を提示し、赤の矢印は販売を提示する。 •小周期変動による頻繁な取引信号の発生を回避するために、5分以上の時間周期で取引を行うことを推奨します。 •最適な取引タイミングを逃さないために、シグナルプロンプトをオンにすることもできます。 •本指標はトレンド相場をよく予測するだけでなく、幅広振動相場でも利益を得ることができる。 •本指標は大道至簡の原則に基づいており、異なる段階のトレーダーが使用するのに適している。 注意事項: •Alpha Trend signには明確な入退場信号があり、損失を与えないように逆位相操作を提案しない。 •Alpha Trend signは特に成熟した指標であり、デルのチー
Koala Supply Demand
Ashkan Hazegh Nikrou
5 (3)
MetaTrader 4 の Koala Supply Demand Indicator をご紹介します (他のトレーダーがあなたの経験から恩恵を受けられるように、肯定的なものでも否定的なものでも、レビューやフィードバックを共有することをお勧めします)。 Koala Supply Demandインジケーターへようこそ。このインジケーターは連続したサプライとデマンドゾーンを特定するために設計されています。このインジケーターはトレーダーが市場をゾーンエリアとして表示できるようにし、いくつかの強力なゾーンがどのように価格を尊重しているかを見るのに役立ちます。このインジケーターはまた、ゾーン内で形成されたときに価格アクションのシグナルを表示することもできます。 Koala Trading Solutionチャンネル で最新のKoala製品に関する最新情報を入手するために、mql5コミュニティに参加してください。参加リンクは以下です: https://www.mql5.com/en/channels/koalatradingsolution https://www.mql5.com/en/bl
FREE
「Auto FIBO Pro」Crypto_Forex インジケーターは、取引の補助ツールとして最適です。 - インジケーターは、フィボナッチ レベルとローカル トレンド ライン (赤色) を自動的に計算してチャート上に配置します。 - フィボナッチ レベルは、価格が反転する可能性のある重要な領域を示します。 - 最も重要なレベルは、23.6%、38.2%、50%、61.8% です。 - リバーサル スキャルピングやゾーン グリッド取引に使用できます。 - Auto FIBO Pro インジケーターを使用して、現在のシステムを改善する機会も多数あります。 - Info Spread Swap Display があり、接続されている外国為替ペアの現在のスプレッドとスワップを表示します。 - ディスプレイには、アカウントの残高、エクイティ、マージンも表示されます。 - Info Spread Swap Display は、チャートのどのコーナーにも配置できます。 0 - 左上コーナー、1 - 右上、2 - 左下、3 - 右下。 高品質のトレーディングロボットとインジケーターをご覧にな
"The trend is your friend" is one of the best known sayings in investing, because capturing large trendy price movements can be extremely profitable. However, trading with the trend is often easier said than done, because many indicators are based on price reversals not trends. These aren't very effective at identifying trendy periods, or predicting whether trends will continue. We developed the Trendiness Index to help address this problem by indicating the strength and direction of price trend
El indicador "MR BEAST ALERTAS DE LIQUIDEZ" es una herramienta avanzada diseñada para proporcionar señales y alertas sobre la liquidez del mercado basándose en una serie de indicadores técnicos y análisis de tendencias. Ideal para traders que buscan oportunidades de trading en función de la dinámica de precios y los niveles de volatilidad, este indicador ofrece una visualización clara y detallada en la ventana del gráfico de MetaTrader. Características Principales: Canal ATR Adaptativo: Calcula
Forex Gump Trendは、トレンドの方向を非常に効果的に決定するための普遍的な指標です。トレンドを正しく特定すれば、これは取引成功の95%です。これは、価格変動の方向に取引を開始し、その恩恵を受けることができるためです。 Forex Gump Trendインジケーターは、効率の高いトレーダーが現在のトレンドの方向とトレンドの反転ポイントを判断するのに役立ちます。トレンドの方向はチャート上で色付きの線で示され、トレンド反転ポイントは矢印で示されます。インジケーターには多くの設定があり、ほぼすべての時間枠とすべての通貨ペアで使用できます。 外国為替ガンプトレンドと取引する方法は? 取引戦略は、トレーダーの取引スタイルと彼が働く通貨ペアに依存します。しかし、グローバルに言えば、この指標を使用した取引戦略は、常にトレンドの方向に注文を開くことに基づいています。インジケーターは色付きの線でトレンドを示します。したがって、インジケーターが青い線を引いたときに買い取引を開き、インジケーターが赤い線を引いたときに売り取引を開きます。トレーダーの大多数がスキャルピング戦略を使用して取引
This is an arrow indicator without a future function,developed based on the most advanced profit trading algorithms.It has the most innovative and advanced dual trend analysis module, as well as the latest and highly effective market trend prediction algorithm.Trends are your friends, and following larger trends can earn the maximum profit in foreign exchange. This indicator helps traders identify current trends and track them. Someone once made a profit of 10 times in a week by relying on it.No
THIS IS A NEW PRODUCT RELEASE -  RENT FOR 1 MONTH FOR JUST $49.99: OFFER EXTENDS UNTIL THE END OF JANUARY 2026.   STRATEGY TESTER HAS LIMITED FUNCTIONS AND DOES NOT BEHAVE EXACTLY AS THE INDICATOR WOULD ON A DEMO. Transform Your Trading with Advanced Multi-Timeframe MACD Analysis The Continuation and Reversal Indicator is a sophisticated technical analysis tool that revolutionizes how you interpret MACD signals by analyzing multiple timeframes simultaneously. This professional-grade indicator p
Next level of trend trading here. Possibility 75%, the indicator analyzes the current market to determine short (small dot), middle (circle with a dot inside) and long (cross with a circle and a dot inside) trends.  Wingdings characters of  Aqua color represents the beginning of the UP trend. Wingdings characters of  Orange color represents the beginning of the DOWN trend. Possibility 75% Indicator will improve your trading in the world of forex, commodities, cryptocurrencies and indices.
Szia! Egy indikátorral. Több idő gyertyájának kirajzoltatása egy charton. Különböző színek rendelhetők a long és short gyertyákhoz. Vonal vastagsága állítható. A gyertya kitöltése engedélyezhető. Hello! With an indicator. Drawing multiple time candles on a chart. Different colors can be ordered for long and short candles. Line thickness can be adjusted. Filling the candle can be allowed. Videó: https://www.youtube.com/watch?v=-9bequnAw-g&amp ;ab_channel=GyulaKlein
Voenix
Lorentzos Roussos
4.58 (12)
高調波パターン スキャナーとトレーダー。いくつかのチャートパターンも 含まれているパターン: ABCDパターン ガートレーパターン バットパターン 暗号パターン 3ドライブパターン ブラックスワンパターン ホワイトスワンパターン カジモドパターンまたはオーバーアンダーパターン Altバットパターン 蝶のパターン 深いカニ柄 カニ柄 サメ柄 FiveOパターン 頭と肩のパターン 昇順の三角形のパターン ワンツースリーパターン そして8つのカスタムパターン Voenixは、マルチタイムフレームおよびマルチペアのハーモニックパターンスキャナーであり、25のチャートおよびフィボナッチパターンをサポートします。カスタムブロック光学アルゴリズムを利用し、再描画なしで、確認ステップに依存せずに可能なパターンを迅速に発見できます(ジグザグ計算とは異なります)。 )。 選択したパターンを自動的に交換したり、通知を送信したり、テーブルに収集して簡単にアクセスして評価したりできます。 取引には最大3つの利益目標があり、各目標で成約された注文のパーセンテージに関して分散があります。 簡単なステップトレーリン
Owl smart levels
Sergey Ermolov
4.24 (37)
MT5版  |   FAQ Owl Smart Levels Indicator   は、 Bill Williams   の高度なフラクタル、市場の正しい波構造を構築する Valable ZigZag、エントリの正確なレベルをマークする Fibonacci レベルなどの一般的な市場分析ツールを含む 1 つのインジケーター内の完全な取引システムです。 利益を得るために市場と場所に。 戦略の詳細な説明 インジケータを操作するための指示 顧問-取引助手 プライベートユーザーチャット ->購入後に私に書いて、私はプライベートチャットにあなたを追加し、あなたはそこにすべてのボーナスをダウンロードすることができます 力はシンプルさにあります! Owl Smart Levels   取引システムは非常に使いやすいので、専門家にも、市場を勉強し始めて自分で取引戦略を選択し始めたばかりの人にも適しています。 戦略と指標に秘密の数式や計算方法が隠されているわけではなく、すべての戦略指標は公開されています。 Owl Smart Levels を使用すると、取引を開始するためのシグナルをすばやく確認し、注
Gyroscope        professional forex expert   (for EURUSD, GBPUSD, USDJPY, AUDUSD, USDCHF, EURGBP, EURJPY, NZDUSD, USDCAD, EURCHF, AUDJPY, CADJPY pairs)   alyzing the market using the Elliot Wave Index. Elliott wave theory is the interpretation of processes in financial markets through a system of visual models (waves) on price charts. The author of the theory, Ralph Elliott, identified eight variants of alternating waves (of which five are in the trend and three are against the trend). The mov
The indicator shows the potential trend direction by cyclical-wave dependence. Thus, all the rays of the intersection will be optimal rays, in the direction of which the price is expected to move, taking into account the indicator period. Rays can be used as a direction for potential market movement. But we must not forget that the approach must be comprehensive, the indicator signals require additional information to enter the market.
WARNING: This indicator is distributed EXCLUSIVELY on MQL5.com MT4 version:   https://www.mql5.com/it/market/product/160363 MT5 version:   https://www.mql5.com/it/market/product/160410 ============================================================================================= MAX RIBBON ver 1.00 The indicator that shows you the TREND clearly and unambiguously! ============================================================================================= DESCRIPTION MAX RIBBON is an advanced tr
Pirate
Anatoliy Lukanin
3.9 (20)
Deposit :   from 100 deposit units Trading pairs: I recommend currency pairs: EURAUD, CHFJPY, EURCHF, EURGBP, AUDCHF, CADCHF, USDCHF. Trading period :  Any Account: You should use ECN-ECN.Pro accounts with five-digit quotes with a moderate size (spread). Parameters: USING - Choice, trading risk or fixed lot RISK/LOT - Lot Risk Value RESTORING_THE_BALANCE - Restoring balance* HOW_THE_RESET_WINDOW - Reset the Global Variable TAKE_PROFIT - Set profit STOP_LOSS - Set loss COUNT_BUY - The number of s
EA123 Snipper MACD
Jose Francisco Flores Rojas
MACD Divergence Pro is an intelligent and adaptive Forex trading robot designed to capitalize on MACD signals and detect divergence patterns that often precede major price reversals. The EA automatically places Buy and Sell trades when: Bearish divergence is detected at market highs Bullish divergence is detected at market lows MACD crossover signals confirm potential entry points Key Features: Fully automated trading using MACD and divergence logic ️ Customizable MACD settings for f
The indicator shows which trading pairs, strategies, robots and signals that you use are profitable and which are not. The statistic of trades and balance graph are displayed in the account currency and pips - to switch simply click on the graph. button "$"(top left) - minimize/expand and move the indicator panel button ">"(bottom right) - stretching and resetting to the original size Statistic of trades 1 line - account balance, current profit and lot of open trades; 2 line - the number of all
これは、キャンドルの終値を予測する指標です。 このインジケータは、主にD1チャートでの使用を目的としていますが. この指標は、従来の外国為替取引とバイナリオプション取引の両方に適しています。 インジケーターは、スタンドアロンのトレーディングシステムとして使用することも、既存のトレーディングシステムへの追加として機能させることもできます。 このインジケーターは、現在のキャンドルを分析し、キャンドル自体の内部の特定の強度係数と、前のキャンドルのパラメーターを計算します。 したがって、この指標は、市場の動きのさらなる方向性と現在のキャンドルの終値を予測します。 この方法のおかげで、この指標は、短期の日中取引だけでなく、中期および長期の取引にも適しています。 インジケーターを使用すると、市場の状況の分析中にインジケーターが生成する潜在的な信号の数を設定できます。 インジケーターの設定には、このための特別なパラメーターがあります。 また、インジケーターは、チャート上のメッセージの形式で、電子メールで、およびPUSH通知の形式で、新しい信号について通知することができます。 購入後は必ず私に書いて
H4 GBPUSD Trend Scalper is a trend signal scalper The EA trades according to the trend strategy using original built-in indicator for opening and closing orders. The external inputs for limiting trading on Fridays and Mondays are available. The purpose of the strategy is to use the current trend with the most benefit. According to the results of testing and working on demo and real accounts, the best results achieved by using the Н4 timeframe on the GBP/USD pair Works on MetaTrader 4 Build 971+
PABT Pattern Indicator - it's classical system one of the signal patterns. Indicator logic - the Hi & Lo of the bar is fully within the range of the preceding bar, look to trade them as pullback in trend. In the way if indicator found PABT pattern it's drawing two lines and arrow what showing trend way.  - First line - it's entry point and drawing at: 1. On the high of signal bar or on middle of the signal bar (depending from indicator mode) for buy; 2. On the low of signal bar or on middle of t
This is a trend indicator without redrawing Developed instead of the binary options strategy (by the color of the Martingale candlestick) Also works well in forex trading When to open trades (binary options) A signal will appear in the place with a candle signaling the current candle It is recommended to open a deal for one candle of the current timeframe M1 and M5 When a blue dot appears, open a deal up When a red dot appears, open a trade down. How to open trades on Forex. When a signal is rec
A scalping indicator based on mathematical patterns, which on average gives signals with relatively small SL, and also occasionally helps to catch big moves in the markets (more information in the video) This indicator has three main types of notifications: The first type warns of a possible/upcoming signal on the next bar The second type indicates the presence of a ready signal to enter the market/open a position The third type is for SL and TP levels - you will be notified every time price re
Gold Venamax   - これは最高の株式テクニカル指標です。 指標アルゴリズムは資産の価格変動を分析し、ボラティリティと潜在的なエントリーゾーンを反映します。 インジケーターの機能: これは、快適で収益性の高い取引のためのマジックとトレンド矢印の 2 つのブロックを備えたスーパー インジケーターです。 チャート上にブロックを切り替えるための赤いボタンが表示されます。 マジックはインジケーター設定で設定されているため、異なるブロックを表示する 2 つのチャートにインジケーターをインストールできます。 Gold Venamax は、異なる矢印バッファー (GV と SD) を備えた 2 つのチャートに配置できます。 これを行うには、設定で異なる Magic を選択する必要があります。たとえば、あるマジック = 999、別のマジック = 666 を選択します。次に、チャート上の赤いボタンで矢印バッファを選択できます。 インジケーター設定の各矢印バッファー (GV および SD) には、快適で収益性の高い取引のための個別の矢印フィルターがあります (UseFiltrGV = tru
Indicator which identifies Trend and also buy/sell opportunities. Use for entries aligned to the Trend.  Although Diamond Trend is very accurate identifying entry points, it is always recommended to use a support indicator in order to reconfirm the operation. Remind to look for those Assets and Timeframes which best fit to your trader behavior/need... Valid for Scalping and Long Term operations. Please, set up a Bars Chart to be able to visualize the indicator properly...  ...And remind to give
The trend is your friend! This is what this indicator is all about. Follow this famous saying and be safe. Characteristics: Buy/Sell signals fixed on the close of a bar. Works on all symbols and all timeframes. Clear visual market trend laser line, Buy/Sell signal arrows, market strength meter, TP1 & TP2 boxes. Visual signals when to enter, when to exit the market. No repainting. Compatible with Flexible EA for trading automation. (Ask for a free set file optimized to perform 2010-2018) Parame
GMMA Trade X is an EA based on GMMA. GMMA parameters such as MovingAveragePeriod1-24, MovingAverageMAShift1-24, MovingAverageShift1-24 and CandlestickShift1-24 can be adjusted. GMMA Trade X applies BTN TECHNOLOGY's state-of-the-art intelligent technology to help you create optimal results for your trades. May your dreams come true through GMMA Trade X. Good luck. = == == Inquiries = == == E-Mail:support@btntechfx.com
This indicator is another variant of the famous powerful indicator Fibonacci-SS https://www.mql5.com/en/market/product/10136 but has different behaviour in placing Pending Order and TP Line. Automatically places Fibonacci retracement lines from the last highest and lowest visible bars on the chart with: An auto Pending Order (Buy/Sell). Taking Profit 1, Taking Profit 2 is pivot point and Taking Profit 3 for extended reward opportunity. The best risk and reward ratio. Simple and powerful indicat
このプロダクトを購入した人は以下も購入しています
FFx Engulfing Setup Alerter gives trade suggestions with Entry, Target 1, Target 2 and StopLoss. Below are the different options available: Entry suggestion - pips to be added over the break for the entry 3 different options to calculate the SL - by pips, by ATR multiplier or at the pattern High/Low 3 different options to calculate the 2 TPs - by pips, by ATR multiplier or at Risk/Reward Offset the dashboard - any place on the chart Remove the suggestion once the price reached the SL line Lines
FFx InsideBar Setup Alerter gives trade suggestions with Entry, Target 1, Target 2 and StopLoss. Below are the different options available: Entry suggestion - pips to be added over the break for the entry Minimum candle size - to avoid too close buy/sell entry suggestions 3 different options to calculate the SL - by pips, by ATR multiplier or at the pattern High/Low 3 different options to calculate the 2 TPs - by pips, by ATR multiplier or at Risk/Reward Offset the dashboard - any place on the c
FFx OutsideBar Setup Alerter gives trade suggestions with Entry, Target 1, Target 2 and StopLoss. Below are the different options available: Entry suggestion - pips to be added over the break for the entry. 3 different options to calculate the SL - by pips, by ATR multiplier or at the pattern High/Low. 3 different options to calculate the 2 TPs - by pips, by ATR multiplier or at Risk/Reward. Offset the dashboard - any place on the chart. Remove the suggestion once the price reached the SL line.
FFx PinBar Setup Alerter gives trade suggestions with Entry, Target 1, Target 2 and StopLoss. Below are the different options available: Entry suggestion - pips to be added over the break for the entry Minimum candle size - to avoid too small candles 3 different options to calculate the SL - by pips, by ATR multiplier or at the pattern High/Low 3 different options to calculate the 2 TPs - by pips, by ATR multiplier or at Risk/Reward Offset the dashboard - any place on the chart Remove the sugges
The purpose of this new version of the MT4 standard indicator provided in your platform is to display in a sub-window multiple timeframes of the same indicator with its divergences. See the example shown in the picture below. But the display isn't like a simple MTF indicator. This is the real display of the indicator on its timeframe. Here's the options available in the FFx divergences indicator: Select the timeframes to be displayed (M1 to Monthly) Define the width (number of bars) for each tim
The purpose of this new version of the MT4 standard indicator provided in your platform is to display in a sub-window multiple timeframes of the same indicator with its divergences. See the example shown in the picture below. But the display isn't like a simple MTF indicator. This is the real display of the indicator on its timeframe. Here's the options available in the FFx divergences indicator: Select the timeframes to be displayed (M1 to Monthly). Define the width (number of bars) for each ti
The FFx Dashboard MTF alerter will show you on a single chart all the timeframes (M1 to Monthly) with their own status for the indicator. 2 Alert Options: Single timeframe: each selected timeframe alert separately when a signal occurs Multi timeframes: all selected timeframes must agree for an alert to be triggered Both options have an input to select the timeframes to be used for the alert(s). How to Understand the Status: Green/Red square: histogram above/below 0 line Green square + Red bord
The FFx Dashboard MTF alerter will show you on a single chart all the timeframes (M1 to Monthly) with their own status for the indicator. 2 Alert Options: Single timeframe: each selected timeframe alert separately when a signal occurs Multi timeframes: all selected timeframes must agree for an alert to be triggered Both options have an input to select the timeframes to be used for the alert(s). How to understand the status: Green/Red square: RSI above/below 50 line Green square + Red border: R
The FFx Dashboard MTF alerter will show you on a single chart all the timeframes (M1 to Monthly) with their own status for the indicator. 2 Alert Options: Single timeframe: each selected timeframe alert separately when a signal occurs Multi timeframes: all selected timeframes must agree for an alert to be triggered Both options have an input to select the timeframes to be used for the alert(s). How to understand the status: Green/Red square: Stoch above/below 50 line Green square + Red border:
The FFx Dashboard MTF alerter will show you on a single chart all the timeframes (M1 to Monthly) with their own status for the indicator. 2 Alert Options: Single timeframe: each selected timeframe alert separately when a signal occurs Multi timeframes: all selected timeframes must agree for an alert to be triggered Both options have an input to select the timeframes to be used for the alert(s). How to understand the status: Green/Red square: Price above/below Cloud (Kumo) Green square + Red bo
The FFx Dashboard MTF alerter will show you on a single chart all the timeframes (M1 to Monthly) with their own status for the indicator. 2 Alert Options: Single timeframe: each selected timeframe alert separately when a signal occurs Multi timeframes: all selected timeframes must agree for an alert to be triggered Both options have an input to select the timeframes to be used for the alert(s). How to understand the status: Green/Red square: MA pointing Up/Down Green square + Red border: MA po
The FFx Dashboard MTF alerter will show you on a single chart all the timeframes (M1 to Monthly) with their own status for the indicator. 2 Alert Options: Single timeframe: each selected timeframe alert separately when a signal occurs. Multi timeframes: all selected timeframes must agree for an alert to be triggered. Both options have an input to select the timeframes to be used for the alert(s). How to understand the status: Green square: Price above PSAR Red square: Price below PSAR Options
The FFx Dashboard MTF alerter will show you on a single chart all the timeframes (M1 to Monthly) with their own status for the indicator. 2 Alert Options: Single timeframe: each selected timeframe alert separately when a signal occurs Multi timeframes: all selected timeframes must agree for an alert to be triggered Both options have an input to select the timeframes to be used for the alert(s). How to understand the status: Green/Red square: CCI above/below levels (ie. 100/-100) Grey square: C
The FFx Dashboard MTF alerter will show you on a single chart all the timeframes (M1 to Monthly) with their own status for the indicator. 2 Alert Options: Single timeframe: each selected timeframe alert separately when a signal occurs Multi timeframes: all selected timeframes must agree for an alert to be triggered Both options have an input to select the timeframes to be used for the alert(s). How to understand the status: Green/Red square: ADX above level Grey square: ADX below level Red bor
The FFx Dashboard MTF alerter will show you on a single chart all the timeframes (M1 to Monthly) with their own status. 2 Alert Options: Single timeframe: each selected timeframe alert separately when a signal occurs Multi timeframes: all selected timeframes must agree for an alert to be triggered Both options have an input to select the timeframes to be used for the alert(s). How to understand the status: Green/Red square: bullish/bearish candle Options available in the FFx Dashboard Alerter
The [GRAFF] III manual trading system is based on multiple MetaTrader (MT4) indicators. Together, the entire PACK of GRAFF III indicators makes an advanced trading tool. The system consists of over 20 different custom-built indicators which have been carefully selected and tested in the long term to produce strong and efficient trading signals. The particular indicators are based on different mathematical formulas, so the entire system is calibrated to remove false signals from its own indicator
FFx Universal Strength Meter PRO is more than a basic strength meter. Instead of limiting the calculation to price, it can be based on any of the 19 integrated strength modes + 9 timeframes. With the FFx USM, you are able to define any period for any combination of timeframes. For example, you can set the dashboard for the last 10 candles for M15-H1-H4… Full flexibility! Very easy to interpret... It gives a great idea about which currency is weak and which is strong, so you can find the best pai
MetaTrader 5 version available here : https://www.mql5.com/en/market/product/24882 FFx Basket Scanner is a global tool scanning all pairs and all timeframes over up to five indicators among the 16 available. You will clearly see which currencies to avoid trading and which ones to focus on. Once a currency goes into an extreme zone (e.g. 20/80%), you can trade the whole basket with great confidence. Another way to use it is to look at two currencies (weak vs strong) to find the best single pairs
MetaTrader 5 version available here: https://www.mql5.com/en/market/product/25794 FFx Pivot SR Suite PRO is a complete suite for support and resistance levels. Support and Resistance are the most used levels in all kinds of trading. Can be used to find reversal trend, to set targets and stop, etc. The indicator is fully flexible directly from the chart 4 periods to choose for the calculation: 4Hours, Daily, Weekly and Monthly 4 formulas to choose for the calculation: Classic, Camarilla, Fibonac
The arrows are calculated with: -     2 Parabolic  parameters -     2 ADX parameters -     4 Stochastic parameters We recommend to combine it with Parabolic, ZigZag or Elliot waves indicator. Always trade the trend! If you make sure to draw your trend lines and support/resistance zones you will just have to wait for the signal to appear. Take the trade. For Binary Options it is advisable to set the expiry time to 5-15 min in M1 chart. THIS INDICATOR IS ZERO REPAINT Best assets to trade: - EUR
Let´s try to make some real money! Call me profit addicted. I thought why not try to make THE dream come reality. With discipline, a clear strategy and this indicator I focus on entering the perfect trades. This indicator is very easy to use as you will get perfect entry points for Put or Call trades. The arrows are calculated with: -     Momentum  parameters -     Candle stick patterns -     Fundamental Price action We recommend to combine it with Parabolic, ZigZag or Elliot waves indicator
Golden Chip provides Basic Market Structure, Fibonacci, supply and Demand Zones. Letting you identify when a sell off point is approaching or whne a buy opportunity is arriving. The awesome thing about Golden Chip is that, you will see rejection levels or continuation before ANYBODY ! This indicator moves directly with price and lines up perfectly with the Chart. Some indicators would lag but NOT this one ! Golden Chip is amazing for Clean chart (Naked Chart). GOLDEN CHIP IS ONLY ON METATRADER (
Seconds timeframe generator for MT4  (S1, S5, S10, S15, S20, S30). Features  1. Indicator generates timeframes in real time, with each new tick on the spot. 2. Indicator is also measuring point distance from extreme to extreme when hovered "This additionally shows us how strong movements are". Advantages 1. Easy to spot best entry and exit points. 2. You can easily trade news releases where market is very volatile. 3. You can also easily trade very slow market conditions and spot tre
PROMOÇÃO LIMITADA, NA COMPRA DE 1 INDICADOR VOCÊ LEVA CLUBINARIAS 6.0 , 5.1 e DonForex DE BRINDE!! ATÉ FINAL DO MÊS! -NA HORA DA COMPRA SELECIONAR COMBINAR COM O VENDEDOR OU BUSCAR PESSOALMENTE, A ENTREGA É DIGITAL EM POUCOS SEGUNDOS ==> VEJA O VIDEO PARA TIRAR AS SUAS DUVIDAS <== ==> VÍDEO OPERANDO NO YOUTUBE ROBÔ FEITO COM MUITO ESFORÇO E CARINHO E QUE ESTA TRAZENDO ÓTIMOS LUCROS APESAR DE EXISTIREM PESSOAS QUE APENAS VENDEM ROBÔS FAKES DE OPERAÇÕES , ACREDITO QUE SERIA MUITO BOM DA MI
This is a Dashboard Indicator based on Bruce's Price Predictor Indicator . This Dashboard will Give you a visual to see the trend direction without having to flip through timeframes, so you can always be trading in direction of the trend, with little effort.  I Recommend   www.CoinexxBroker.com  as a great broker and the one I personally use *Non-Repainting Dashboard Arrows *For Desktop MT4 Only *Great For Scalping *Great For Swing Trading *Dashboard Arrow Entry Alerts *Dashboard Arrow Signals
デイリートレンドスカルパー(DTS) このインジケーターはRPTradeProSolutionsシステムの一部です。 DTSは、プライスアクション、ダイナミックサポート、レジスタンスを使用した毎日のトレンドインジケーターです。 誰でも使用できるように設計されており、トレーディングの初心者でも使用できます。 決して塗り直さないでください。 表示は近いものから近いものへと示されます。 単独で使用するように設計されているため、他のインジケーターは必要ありません。 一日の初めにトレンドと潜在的なテイクプロフィットを提供します。 どのように機能しますか DTSは、価格アクションと動的なサポートおよびレジスタンスを組み合わせたブレイクアウト戦略を使用しています。 夜のトレンドとボラティリティが分析され、翌日に使用されます。 この分析から、ブレイクアウト制限(青と濃いオレンジの線)とTakeProfitが決定されます 履歴データのおかげで、戦略と設定の「成功」を即座に確認できます。 履歴部分では、戦略に「穴」があるかどうかをすぐに確認し、最終的にはより適切な別のタイムフレームまたはシンボルを
Namiri Trade Engine is an ALL in ONE trading system that combines price structure, volume pressure, market condition & risk management to give you the BEST opportunities for A+ trade setups with auto lot size WAIT FOR YOUR A+ SETUP || ONLY TAKE YOUR A+ TRADE || RINSE REPEAT YOUR A+ MOVE Chart Features Panel - Shows the asset, market, price, pip, account, trade & profit|loss information Structure - Shows areas of support & resistance Risk Management - Shows risk analysis period of 100 bars, buy
作者のその他のプロダクト
This indicator is based on the ADX indicator and indicates the trend very easily. You can customize the indicator to your needs: ADXPeriod ADXSignal_Level BarWidth CandleWith HeikenAshi The    Adx color candles  indicator is fully FREE and compatible with the other part of the system; the Acc arrow >>>>  https://www.mql5.com/en/market/product/33770 ENJOY and check out my other indicator:  https://www.mql5.com/en/market/product/32111
FREE
This classic "old school" MAGIC MACD indicator gives you the cross of the parameters you set. Standart setting is (12,26,9) . The arrows give you a possible change of trend. Be careful and do not use this indicator as a single signal source. FREE version  Please feel free to check out our other REX indicator series. We do have other free indicators.     "OLD BUT GOLD"
FREE
This indicator for MT4 is the pro version of the REX family. Perfect for beginners and intermediates. REXpro is 100% non repaint and can be used on every timeframe. The strategy is based on a mix of different strategies, statistics, including pivot points, oscillators and patterns. It is an independent strategy that is not based on any custom strategy online. As the trading idea consists of a variety of some classic indicators like CCI or Stochastic, it is clear that the fundamental indicators h
REXultra REVERSALarrow   This indicator for MT4 is the latest ultra   version of the REX family. Perfect for beginners and intermediates. REXultra is 100% non repaint.  The strategy is based on a mix of different strategies, statistics, including pivot points, oscillators and patterns. It is an independent strategy that is not based on any custom strategy online. REXultra has a lot more trading signals than the pro version. The accuracy is higher. The most important indicators are Momentum and W
Due to the huge success of the limited free version, the now low priced LOTUS version will continue being updated in the future. Optimal for Binary Options and Forex. For beginners and intermediates. Lotus is 100% non repaint. The strategy is based on 4 ADX parameters, including pivot points and candle patterns.  It is recommendable to combine the arrow with an moving average, Elliot waves indicator or Parabolic SAR. The main goal was to  keep it as simple as possible ! No useless oscillators.
The arrows are calculated with: -     2 Parabolic  parameters -     2 ADX parameters -     4 Stochastic parameters We recommend to combine it with Parabolic, ZigZag or Elliot waves indicator. Always trade the trend! If you make sure to draw your trend lines and support/resistance zones you will just have to wait for the signal to appear. Take the trade. For Binary Options it is advisable to set the expiry time to 5-15 min in M1 chart. THIS INDICATOR IS ZERO REPAINT Best assets to trade: - EUR
Let´s try to make some real money! Call me profit addicted. I thought why not try to make THE dream come reality. With discipline, a clear strategy and this indicator I focus on entering the perfect trades. This indicator is very easy to use as you will get perfect entry points for Put or Call trades. The arrows are calculated with: -     Momentum  parameters -     Candle stick patterns -     Fundamental Price action We recommend to combine it with Parabolic, ZigZag or Elliot waves indicator
This indicator is based on the ADX indicator and gives you safe entry points. You can customize the indicator to your needs: RISK SSP COUNTBARS The only condition that has to be met when entering a trade is, that the arrow faces in the same direction as the Adx color candles. Download the FREE DEMO and test it! The   Acc arrow  indicator is compatible with the other part of the system; the fully FREE  Adx color candles   >>>>  https://www.mql5.com/en/market/product/33768 ENJOY and check ou
フィルタ:
レビューなし
レビューに返信