Equilibrium Fractal Wave Analytics MT4
- インディケータ
-
Young Ho Seo
 Harmonic Pattern Indicator - Repainting + Japanese Candlestick Pattern Scanner + Automatic Channel + Many more
https://www.mql5.com/en/market/product/4488 - バージョン: 10.8
- アップデート済み: 1 7月 2022
- アクティベーション: 5
Introduction to EFW Analytics
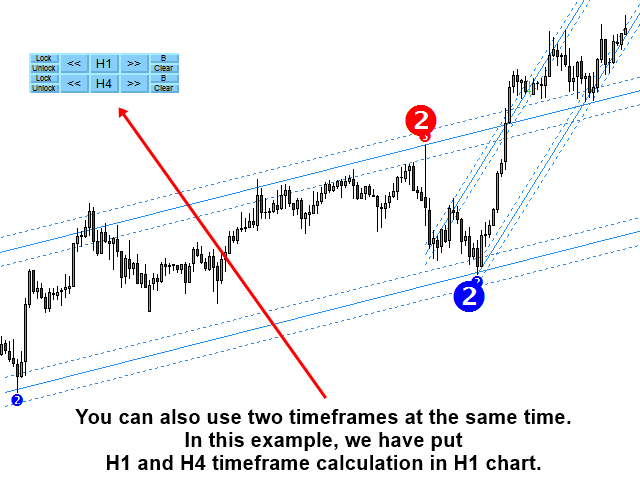
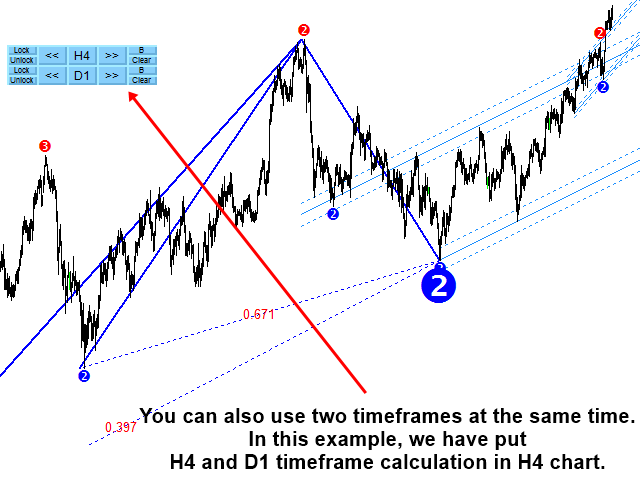
EFW Analytics was designed to accomplish the statement "We trade because there are regularities in the financial market". EFW Analytics is a set of tools designed to maximize your trading performance by capturing the repeating fractal geometry, known as the fifth regularity in the financial market. The functionality of EFW Analytics consists of three parts. Firstly, Equilibrium Fractal Wave Index is an exploratory tool to support your trading logic to choose which ratio to trade. Secondly, EFW Analytics can detect the Superimposed Patterns in your chart. Thirdly, it can detect Equilibrium Fractal Wave (EFW) Channel patterns. EFW Analytics provide the graphic rich and fully visual trading decision support. In default trading strategy, you will be looking at the combined signal from Superimpsoed pattern + EFW Channel. In addition, you can perform many more trading straetgies in a reversal and breakout mode. You can also run two different timeframes in one chart to enforce your trading decision. Sound alert, email and push notifiaction are built inside the indicator.
Equilibrium Fractal Wave Index
Equilibrium Fractal Wave index is an exploratory analysis tool for your trading. How to use the EFW index is similar to Hurst Exponent by Harold Edwin Hurst (1880-1978) or Fractal Dimension coined by Mandelbrot in 1975. Literarily, EFW index can help you to confirm the presence of equilibrium fractal waves in the financial market. However, Equilibrium fractal wave index is more practical and intuitive comparing to Hurst Exponent and Fractal Dimension for your trading. The value of equilibrium fractal wave index can range from 0.0 to over 1.0. The higher the equilibrium fractal wave index, you can confirm the stronger presence of a particular shape ratio of equilibrium fractal wave. Hence this ratio will be your choice of trading. If you stronly believe on fibonacci ratios like 0.618, 0.382, etc, then you may skip this part because default ratio setting uses 0.382, 0.500 and 0.618. However, you will find that some fibonacci ratios are not significant for some currency pairs.
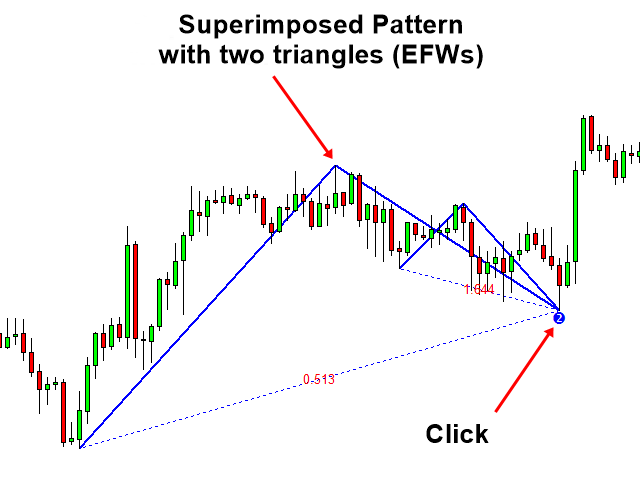
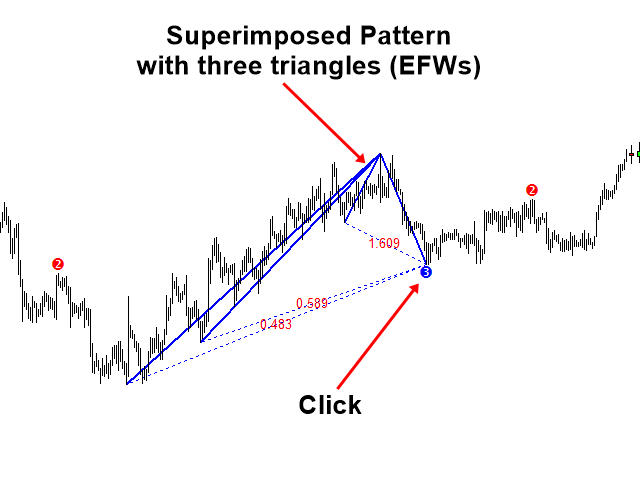
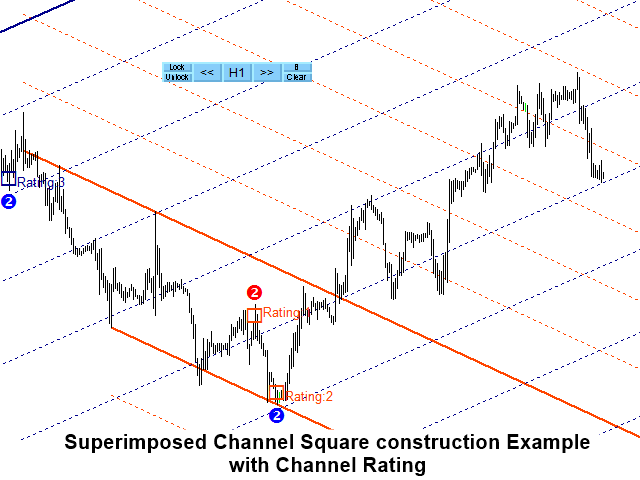
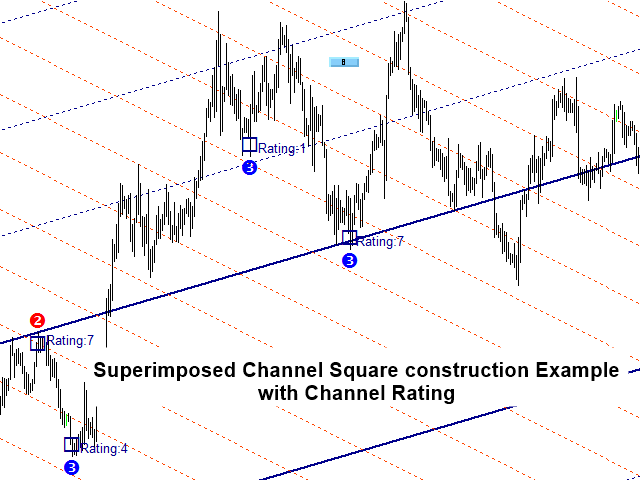
Superimposed Patterns
Superimposed patterns are the several triangles overlapping in the same place in your chart. Superimposed pattern can provide the good trading entries when it is used together with EFW channel.
How to Trade
When you use this tool alone, we recommend the combined signal from superimposed pattern and EFW channel. You can use EFW Analytics with some of our other products. Here is some example of trading signal you can generate.
- Superimposed patterns + EFW channel (Default Reversal trading strategy when you are using EFW Analytics alone)
- You can also use EFW Channel for breakout trading too. But please use your own setup for this case.
- Superimposed patterns with Triangle Pattern, Falling Wedge Pattern, Rising Wedge Pattern and Channel
- EFW channel with Harmonic Pattern Detection Indicator
- Superimposed pattern or EFW channel with Supply Demand Indicator
- Superimposed pattern or EFW channel with Elliott Wave Indicator
- Superimposed pattern or EFW channel with Volume Spread Analysis
Controllable Inputs
- Common User setting: common input setting for EFW Analytics
- EFW Index setting: this input controls everything related to EFW index
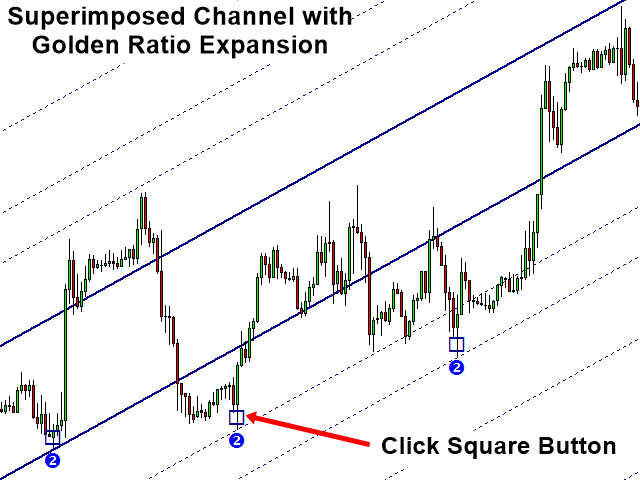
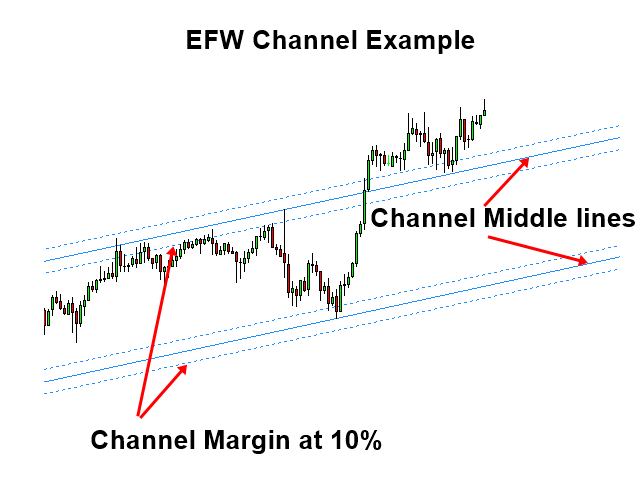
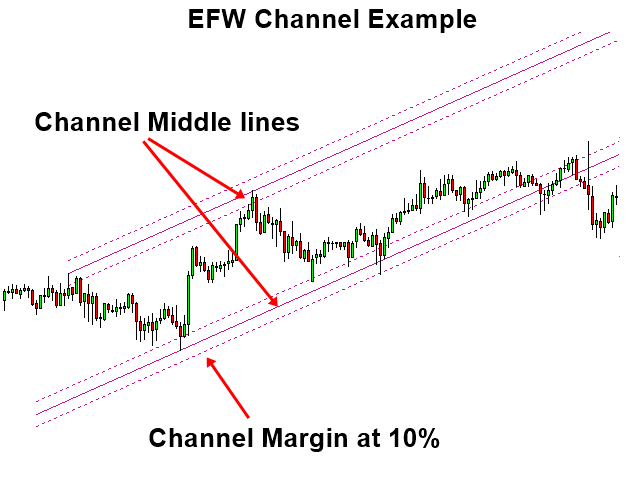
- EFW Channel setting: this input controls everything related to EFW Channel
- Superimposed pattern setting: this input controls everything related Superimposed patterns
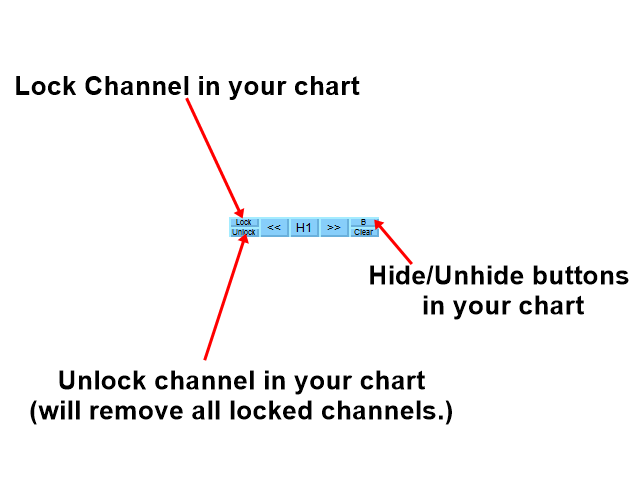
- Button display settings: this input controls how the buttons shows in your chart
Trading Strategy Guide
You can find the detailed trading strategy guide about how to use Superimposed Pattern within EFW Analytics MetaTrader Indicator from the link below. We highly recommend to read this article before using the Superimposed Pattern for your trading.
https://www.mql5.com/en/blogs/post/750385
Important Note
This is the off the shelf product. Therefore, we do not accept any modification or customization request on this product. In addition, we do not provide any code library or any support for your coding for this product.


I agreed with Vincent review 100% Amazing Wave and Superimposed patterns! Thanks Author! but need some manual instruction pdf or url on the setting that explain how to use, the previous tutorial link you posted in comment I click but no instruction cannot find anything, I've posted some comment question in comment page, please help answer my questions?
*updated review 10/3/2023 * What I like about this is able to draw trend for different period easily with a click of a button and it also draw trend into the future and price reacted to the line, accurate and amazing!