Rapid Tester
- ユーティリティ
- バージョン: 1.22
- アップデート済み: 25 7月 2024

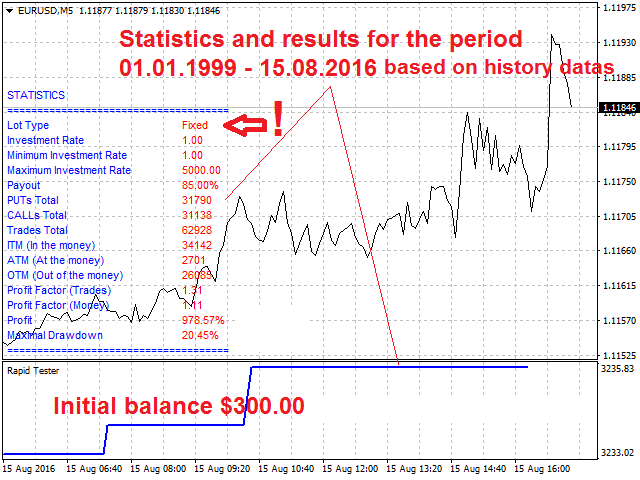
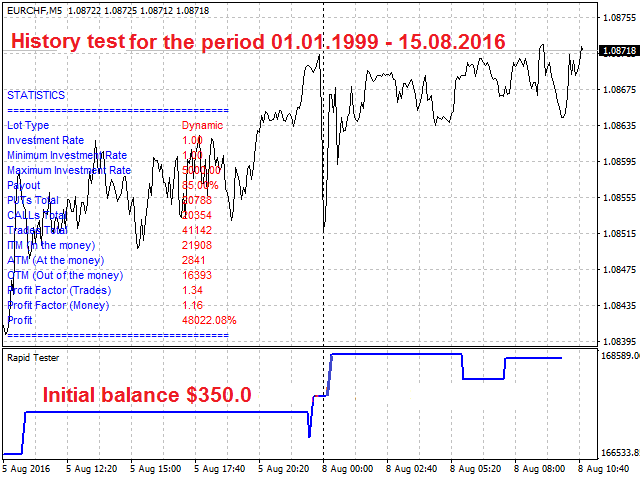
The Rapid Tester indicator is a very simple tester for the Rapid binary options trading system and Rapid Expert.
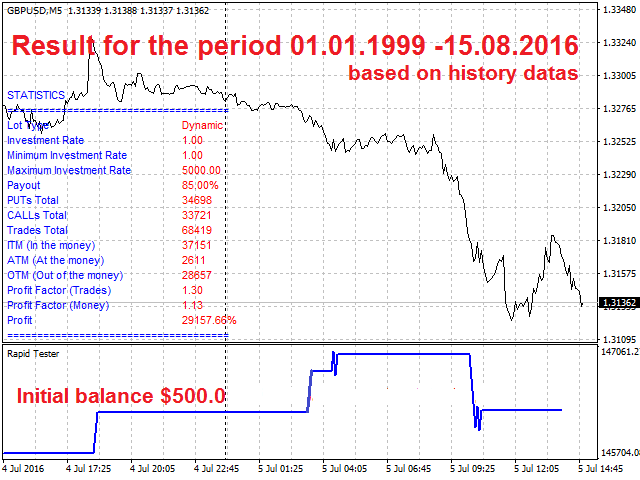
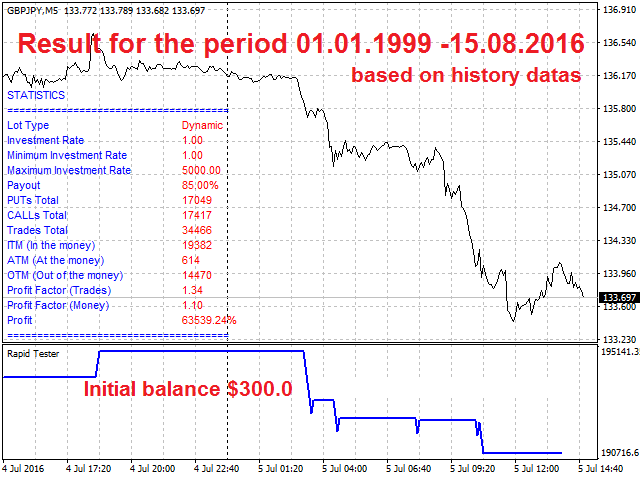
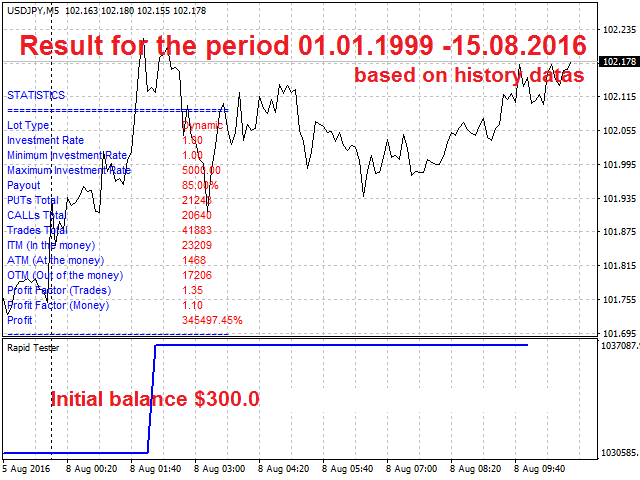
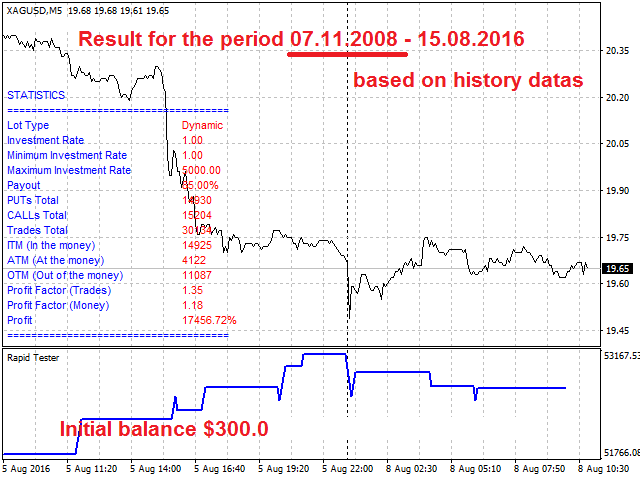
Its objective is constructing a balance line on history data and calculation of statistics during CALL and PUT deals performed by the Rapid trading system for any of the six financial instruments: EURUSD, EURCHF, GBPUSD, GBPJPY, USDJPY or XAGUSD.
The tester requires at least 100 5-minute bars in the history of a trading instrument. However, in order to obtain reliable statistics, you should download the full depth of data!
Input Parameters
- Initial Balance - initial balance.
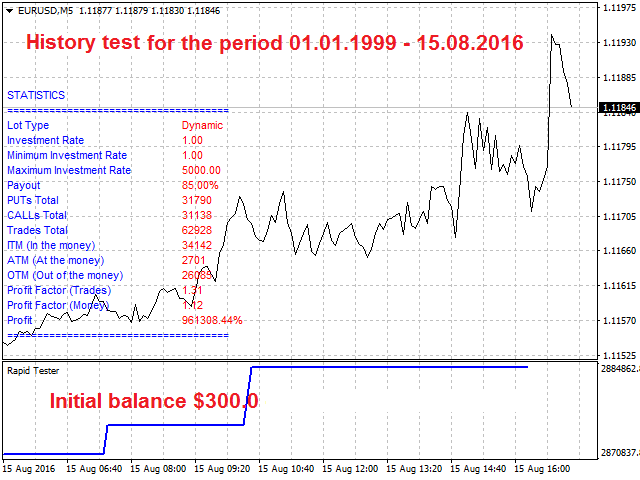
- Lot Type:
- Fixed
- Fixed
- Investment Rate
- Minimum Investment Rate
- Maximum Investment Rate
- Payout - payout in %.
- Loss - loss in %.
- Statistics:
- true - show.
- false - hide.
- Language of Messages - language of messages:
- English
- Russian
- Data Name Display Color - select the color for names.
- Data Display Color - select color for data.
Use
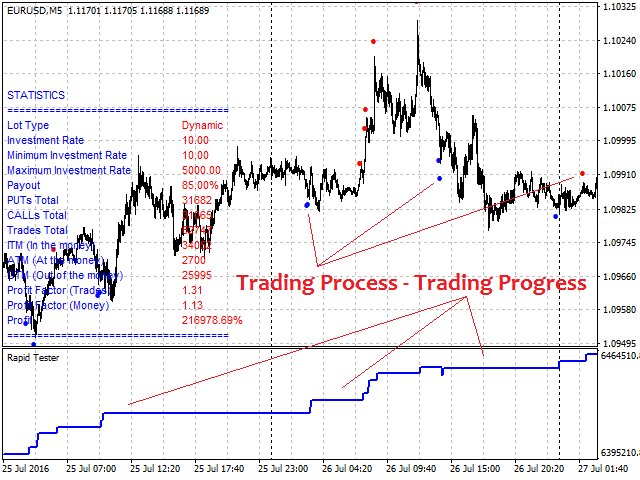
The indicator should be used together with the Rapid trading system as shown in the screenshots.
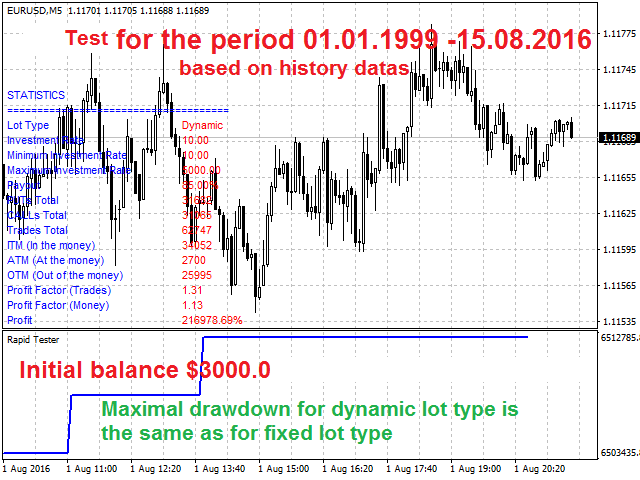
You can test with the Fixed or Dynamic lot. When you use Dynamic lot, the EA trades a fixed lot during the day, which is differentiated on the basis of daily trade results.
Explanation
- ITM (In the money) - means in profit.
- ATM (At the money) - investment rate return, when the deal close price is equal to its open price.
- OTM (Out of the money) - means loss.
Limitations
The indicator is only designed for the above six financial instruments on the M5 timeframe with the payout of no less than 85% and the 15-minute expiration.
The indicator is not designed for testing in the MetaTrader 4 strategy tester, because its purpose is to create a balance line and to calculate statistics immediately after loading the indicator on the chart of a financial instrument.
Since the indicator is a free supplement to the paid Rapid system and Rapid Expert, the balance line is built with a limitation on the last ten bars. Deal results at these bars (as trading continuation) can be seen after repeated indicator launches, as soon as new bars appear.