Great Indicator

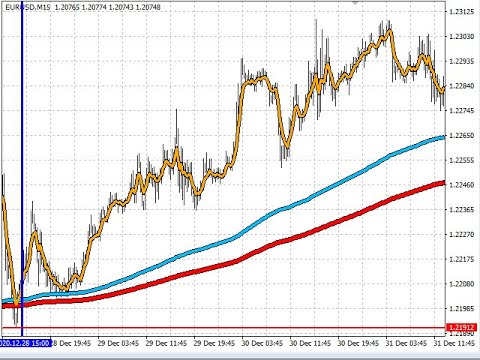
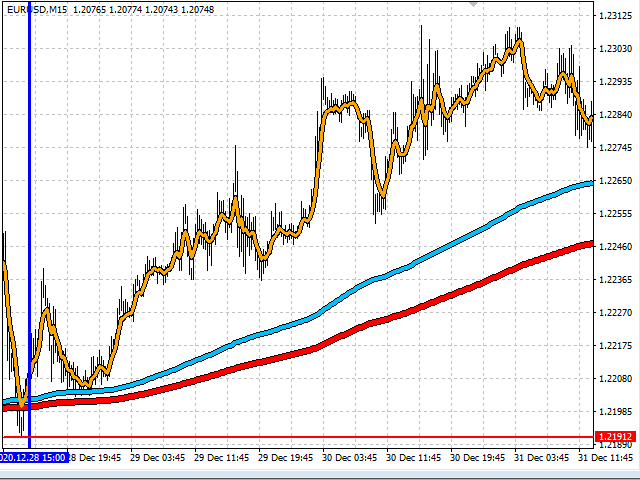
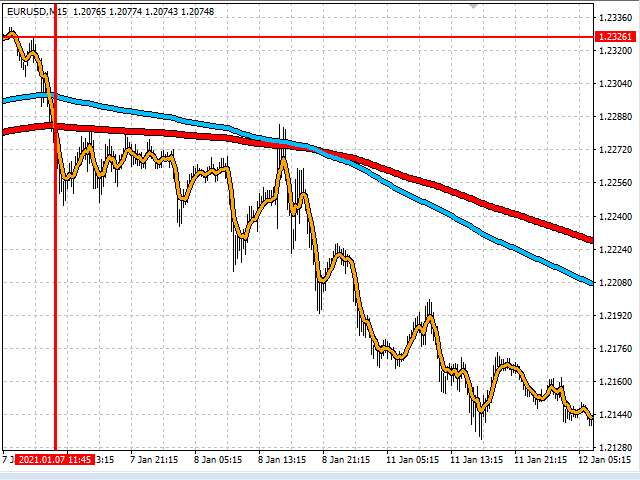
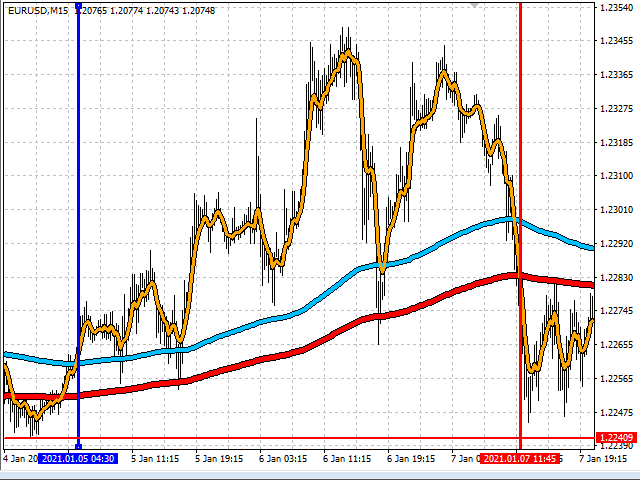
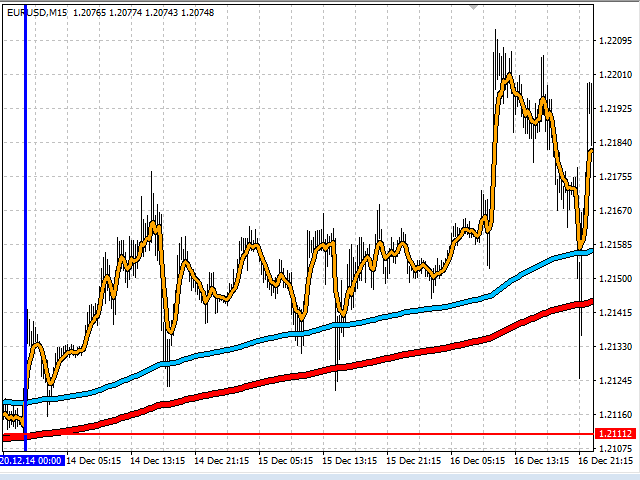
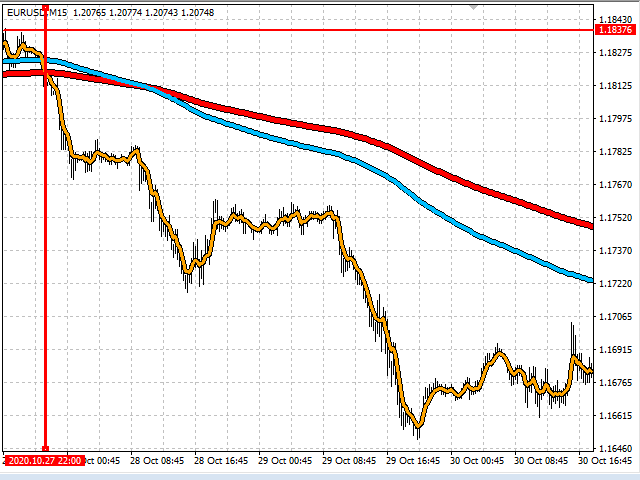
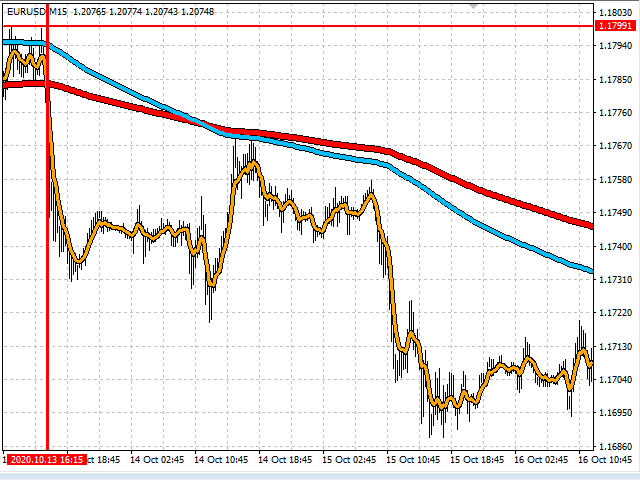
Les presento un indicador que funciona como estrategia por si solo , trabaja muy bien en periodos de 4 horas pero puedes aplicarlo a cualquier timeframe , las señales son muy faciles de interpretar , en momento en que la linea naranja pasa hacia arriba las media azul y roja , se entra en largos , la operativa se mantiene abierta hasta que la linea naranja cruce la media mas cercana ya sea la azul o la roja , si la operacion era long y la linea azul cruza hacia arriba la linea roja y la naranja cruza la linea azul hacia abajo se cierra la operacion , pero si la linea naranja vuelve a cruzar la linea azul hacia arriba haciendo seguimiento de tendencia , podemos considerar el volver a entrar long al mercado , para la entrada short la condicion es la contraria que la entrada long solo que todos los cruces son hacia abajo , el stop loss se coloca en la ultima oscilacion anterior del precio , el take profit es mejor obtenerlo de manera manual cuando finalize la tendencia, se puede tambien ir moviendo el stop loss a nuestro favor es las oscilaciones siguientes de la tendencia, o tambien con los cruces de las lineas , pero si prefieres puedes ubicar el take profit a 3:1 del stop loss , por lo tanto si tu stop loss es de 30 pips el take profit debes ponerlo en 90 pips , espero que sea de ayuda .
おすすめのプロダクト
The indicator detects and displays М. Gartley's Butterfly pattern. The pattern is plotted by the extreme values of the ZigZag indicator (included in the resources, no need to install). After detecting the pattern, the indicator notifies of that by the pop-up window, a mobile notification and an email. The pattern and wave parameters are displayed on the screenshots. The default parameters are used for demonstration purposes only in order to increase the amount of detected patterns. Parameters z
Rainbow Price Visualizer v1.21 See where the market really breathes. Turns your MT4 chart into an ultra-precise heatmap that highlights price zones favored by big players. Why it matters 300 price levels at 0.2‑pip resolution — microscopic detail. 8 visual themes (Rainbow, Fire, Ocean…) for instant readibility. Smart opacity: low noise fades, real zones pop. Lightweight rendering with automatic cleanup. Fully customizable: saturation, opacity, resolution, history depth. Bands project into the f
This    Nice Trade Point     indicator is designed for signal trading. This indicator generates trend signals. It uses many algorithms and indicators to generate this signal. It tries to generate a signal from the points with the highest trend potential. This indicator is a complete trading product. This indicator does not need any additional indicators. The indicator certainly does not repaint. The point at which the signal is given does not change.     Features and Suggestions Time Frame
The main idea of this indicator is rates analysis and prediction by Fourier transform. Indicator decomposes exchange rates into main harmonics and calculates their product in future. You may use the indicator as a standalone product, but for better prediction accuracy there is another related indicator - FreqoMaster - which uses FreqoMeterForecast as a backend engine and combines several instances of FreqoMeterForecast for different frequency bands. Parameters: iPeriod - number of bars in the ma
Introducing Order Blocks Breaker , a brand-new way to identify and leverage order blocks in your trading strategy. After developing multiple order block tools with unique concepts, I’m proud to present this tool that takes things to the next level. Unlike previous tools, Order Blocks Breaker not only identifies order blocks but also highlights Breaker Order Blocks —key areas where the price is likely to retest after a breakout. MT5 -  https://www.mql5.com/en/market/product/124102/ This tool inco
「Auto FIBO Pro」Crypto_Forex インジケーターは、取引の補助ツールとして最適です。 - インジケーターは、フィボナッチ レベルとローカル トレンド ライン (赤色) を自動的に計算してチャート上に配置します。 - フィボナッチ レベルは、価格が反転する可能性のある重要な領域を示します。 - 最も重要なレベルは、23.6%、38.2%、50%、61.8% です。 - リバーサル スキャルピングやゾーン グリッド取引に使用できます。 - Auto FIBO Pro インジケーターを使用して、現在のシステムを改善する機会も多数あります。 - Info Spread Swap Display があり、接続されている外国為替ペアの現在のスプレッドとスワップを表示します。 - ディスプレイには、アカウントの残高、エクイティ、マージンも表示されます。 - Info Spread Swap Display は、チャートのどのコーナーにも配置できます。 0 - 左上コーナー、1 - 右上、2 - 左下、3 - 右下。 高品質のトレーディングロボットとインジケーターをご覧にな
The indicator detects and displays 3 Drives harmonic pattern (see the screenshot). The pattern is plotted by the extreme values of the ZigZag indicator (included in the resources, no need to install). After detecting the pattern, the indicator notifies of that by a pop-up window, a mobile notification and an email. The indicator highlights the process of the pattern formation and not just the complete pattern. In the former case, it is displayed in the contour triangles. After the pattern is com
The   Trendlines Oscillator   helps traders identify trends and momentum based on the normalized distances between the current price and the most recently detected bullish and bearish trend lines. The indicator features bullish and bearish momentum, a signal line with crossings, and multiple smoothing options. USAGE The   Trendlines Oscillator   works by systematically: Identifying pivot highs and lows. Connecting pivots to form bullish (support) and bearish (resistance) trendlines. Measuring
Combined MT4
Ahmed Alaaeldin Abdulrahman Ahmed Elherzawi
Welcome to Investment Castle products   This product is exclusively available in the MQL5 market and is not available and will not be available anywehere else. The Combined indicator is a multi-time frame indicator and it is built using 3 indicators: Bands indicator which draws the support and resistance key levels   using up to 5 different time frames Patterns indicator which draws the chart patterns using up to 6 different time frames Spots indicator which shows the common candlestick pattern
Crypto_Forex インジケーター HTF Ichimoku for MT4。 - Ichimoku インジケーターは、最も強力なトレンド インジケーターの 1 つです。HTF は、Higher Time Frame を意味します。 - このインジケーターは、トレンド トレーダーや、プライス アクション エントリとの組み合わせに最適です。 - HTF Ichimoku インジケーターを使用すると、より高い時間枠の Ichimoku を現在のチャートに添付できます。 - 上昇トレンド - 赤い線が青い線より上 (両方の線が雲より上) / 下降トレンド - 赤い線が青い線より下 (両方の線が雲より下)。 - 価格が Ichimoku 雲の上部境界を突破した場合にのみ、買い注文を開きます。 - 価格が Ichimoku 雲の下部境界を突破した場合にのみ、売り注文を開きます。 - HTF Ichimoku インジケーターを使用すると、大きなトレンドを捉える機会が得られます。 高品質のトレーディングロボットとインジケーターをご覧になるにはここをクリックしてください! これは、この M
Delta Fusion Pro – 日中取引のための高度なオーダーフロー分析 Delta Fusion Pro は MetaTrader 4 用のプロフェッショナル指標で、アグレッシブな注文フローを明らかにし、機関投資家の圧力の強度と方向をリアルタイムで表示します。従来のボリューム指標とは異なり、Ask と Bid のボリューム差(デルタ)を分析し、反転の予測、トレンドの確認、プロフェッショナルな関心ゾーンの特定を可能にします。 主な特徴 インテリジェント自動調整システム 以下に基づき、すべてのパラメータを自動調整: 銘柄タイプ(FX、暗号資産、指数、コモディティ、株式) 運用タイムフレーム 市場のボラティリティ(ATR) 最近の平均ボリューム 初心者トレーダー向けに手動設定不要 — インジケーターが自動でキャリブレーション! 機能概要 NetDelta と累積デルタ Ask/Bid のアグレッシブボリューム差を計算、カスタマイズ可能な EMA スムージング リアルタイムで方向性圧力を表示 ヒストグラムの色をカスタマイズ(買い/売り) 価格/ボリュームのダイバージェンス 通常お
The indicator shows the potential trend direction by cyclical-wave dependence. Thus, all the rays of the intersection will be optimal rays, in the direction of which the price is expected to move, taking into account the indicator period. Rays can be used as a direction for potential market movement. But we must not forget that the approach must be comprehensive, the indicator signals require additional information to enter the market.
KDJ Index 4   交易实用必备工具指标 波浪自动计算指标,通道趋势交易 完美的趋势-波浪自动计算通道计算 , MT4版本 完美的趋势-波浪自动计算通道计算 , MT5版本 本地跟单复制交易 Easy And Fast Copy , MT4版本 Easy And Fast Copy , MT5版本 本地跟单复制交易 模拟试用 Easy And Fast Copy , MT4 模拟账号运行 Easy And Fast Copy , MT5 模拟账号运行 "Cooperative QQ:556024  "  "Cooperation wechat:556024"  "Cooperative email:556024@qq.com" 强烈推荐趋势指标, 波浪的标准自动计算   和   波浪的标准自动计算MT5版本     KDJ指标又叫 随机指标 ,是一种相当新颖、实用的技术分析指标,它起先用于期货市场的分析,后被广泛用于股市的中短期趋势分析,是期货和股票市场上最常用的技术分析工具。 随机指标KDJ一般是用于股票分析的统计体系,根据统计学原理,通过一个特定的周期(常为9日、9周等)
平均方向性指数(ADX)マルチカレンシースキャナー MT4 は、複数の通貨ペアを同時に分析するために設計された高度なトレーディングインジケーターです。これは、平均方向性指数に基づいたリアルタイムのシグナルを提供することで、意思決定プロセスを強化しようとするトレーダーにとって有益です。効率的な市場トレンド分析を可能にします。 このツールは、トレンドの強さと方向の動きを簡単に特定できるようにすることで、トレーダーにとって不可欠な資産となります。ADXに基づく戦略を採用しているトレーダーにとって特に重要です。リアルタイムのアラートと使いやすいダッシュボードにより、トレーダーは市場の状況を迅速に評価し、情報に基づいた取引選択を行うことができます。 MQL製品のインストールガイド | MT4/MT5で購入したMQL製品の更新 | 一般的なトラブルシューティングガイド | インジケーター設定 / ガイド 主な機能 バッファ統合: インジケーターの値をアクセス可能なバッファとして公開し、Expert Advisorが自動取引のためにシグナルデータを利用できるようにします。 視覚的矢印シグナル: シグ
The indicator detects and displays Shark harmonic pattern (see the screenshot). The pattern is plotted by the extreme values of the ZigZag indicator (included in the resources, no need to install). After detecting the pattern, the indicator notifies of that by a pop-up window, a mobile notification and an email. The indicator highlights the process of the pattern formation and not just the complete pattern. In the former case, it is displayed in the contour triangles. After the pattern is comple
MACD Divergence Finder Indicator will help you to find Divergences between your typical MACD values and the Chart Prices as potential points of actual Trend Reversion or Pull Backs to increase your positions as per the current Trend. Indicator Windows draws MACD value and Divergence arrows but not MACD Signal as it is not considered relevant to detect this kind of Classic Divergences. In some computer/VPS with old microprocessors or low RAM size, when you launch this Indicator (attach it, change
Tin
Maryna Shulzhenko
The Tin indicator is designed to visually display the current trend in the market. One of the key aspects of foreign exchange market analysis is to determine the trend, which is the sustainable direction of price movement. To do this, the Tin indicator uses algorithms that smooth out sharp fluctuations that do not have a significant impact on the overall trend. A trend can be either upward (bullish) or downward (bearish). Typically, a trend persists for a long time before abruptly changing dir
Gets is a smart trading system with complex market analysis mechanism. The operation principle of Gets is based on neural networks and diversified collection of information from various market analyzers. Then the system analyzes the statistical databases to create a general idea of the current market situation and the further price movement. The information is displayed on the screen in a simple and intuitive way - in the form of buy and sell arrows. Also, the information on the current trend st
This indicator provides a statistical analysis of price changes (in points) versus time delta (in bars). It calculates a matrix of full statistics about price changes during different time periods, and displays either distribution of returns in points for requested bar delta, or distribution of time deltas in bars for requested return. Please, note, that the indicator values are always a number of times corresponding price change vs bar delta occurred in history. Parameters: HistoryDepth - numbe
FREE
The Range Directional Force Indicator is designed to help traders analyze market trends, reversals, and directional strength. It focuses on price movements within defined ranges, identifying key moments when the market is gaining momentum or preparing for a shift. By dividing the chart into dynamic price ranges, the indicator detects critical support and resistance levels. It calculates the directional force of price movements, highlighting potential entry and exit points based on market sentim
GS trendS is a trend indicator that can be used for any Forex financial instrument. The indicator does not redraw and does not lag. Recommended timeframe H1. It is possible to select the trend algorithm settings {Only Open, Average Open/Close, Average High/Low} The color indicates the direction of the trend: yellow - direction can be SELL or BUY (S_B) blue - uptrend (BUY) red - downward trend (SELL) The indicator panel displays trend values of 5 timeframes for the current price level. The va
Crypto_Forex MT4用インジケーター「 WPR SPEED 」は、優れた予測ツールで、リペイント機能はありません。 - このインジケーターの計算は物理学の方程式に基づいています。WPR SPEEDは、WPRオシレーター自体の1次導関数です。 - WPR SPEEDは、横ばい相場やフラット相場でのスキャルピングエントリーに適しています。 - WPR SPEEDインジケーターは、WPR自体の方向転換の速さを示します。非常に敏感です。 - モメンタムスキャルピング戦略には、WPR SPEEDインジケーターの使用をお勧めします。インジケーターの大きなピークを見つけ、反対方向にスキャルピングトレードを開始します(図を参照)。 - インジケーターには、モバイルとPCの両方でアラートが組み込まれています。 Click here to see high quality Trading Robots and Indicators! これは、このMQL5ウェブサイトでのみ提供されるオリジナル製品です。
PipsZenith Virtual Candle Levels – Indicator Description Take your trading to the next level with PipsZenith Virtual Candle Levels – the ultimate multi-timeframe support and resistance tool. This powerful indicator plots High, Low, Open, and Close levels from multiple standard and custom timeframes, helping traders identify key market zones with precision. Unlike ordinary indicators, PipsZenith Virtual Candle Levels lets you see levels from: Yearly, 6-Month, 4-Month, 3-Month, 2-Month Monthly, We
Price Magnet — Price Density and Attraction Levels Indicator Price Magnet is a professional analytical tool designed to identify key support and resistance levels based on statistical Price Density. The indicator analyzes a specified historical period and detects price levels where the market spent the most time. These zones act as “magnets,” attracting price action or forming a structural base for potential reversals. Unlike traditional Volume Profile tools, Price Magnet focuses on price-time d
The resistance and support lines are the position where the price will have a change, be it a breakout to follow the trend or reverse. The price rule will go from support to resistance and Long's resistance can be Short's support and the opposite is true. Accurately identifying support and resistance lines is the key to being able to trade well and profitably. This indicator is based on the Fractals indicator, the indicator will be redrawn by 2 candles. *Great For Swing Trading *Blue is Support
The main idea of this indicator is rates analysis and prediction by Fourier transform. The indicator decomposes exchange rates into main harmonics and calculates their product in future. The indicator shows 2 price marks in history, depicting price range in the past, and 2 price marks in future with price movement forecast. Buy or sell decision and take profit size are displayed in a text label in the indicator window. The indicator uses another indicator as an engine for calculations - FreqoMet
This indicator is the logical continuation of the well-known equidistant channel indicator: https://www.mql5.com/en/market/product/8723 . The main purpose of the indicator is the visualization of price levels relative to the parallel channel using Fibo Bobokus levels in a separate window and the price history. This often allows forecasting the future price movement with a sufficiently high degree of probability. The Fibo levels calculation equation is as follows: FiboLevel = (50-(100*((Close[i]-
VR Cub
Vladimir Pastushak
VR Cub は、質の高いエントリーポイントを獲得するためのインジケーターです。このインジケーターは、数学的計算を容易にし、ポジションへのエントリーポイントの検索を簡素化するために開発されました。このインジケーターが作成されたトレーディング戦略は、長年にわたってその有効性が証明されてきました。取引戦略のシンプルさはその大きな利点であり、初心者のトレーダーでもうまく取引することができます。 VR Cub はポジション開始ポイントとテイクプロフィットとストップロスのターゲットレベルを計算し、効率と使いやすさを大幅に向上させます。取引の簡単なルールを理解するには、以下の戦略を使用した取引のスクリーンショットを見てください。 設定、設定ファイル、デモ版、説明書、問題解決方法は、以下から入手できます。 [ブログ] レビューを読んだり書いたりすることができます。 [リンク] のバージョン [MetaTrader 5] エントリーポイントの計算ルール ポジションをオープンする エントリーポイントを計算するには、VR Cub ツールを最後の高値から最後の安値までストレッチする必要があります。 最初
The MTF MA Trend indicator is an advanced model of the moving average indicator. With this indicator, you can follow the moving averge inductor in the multi time frame from a single graphical display. This indicator shows 7 different time zones on a single graphical display. This display is designed in oscillator style. It is also a new generation trend indicator. Features It can work in 7 different time zones. different color settings can be made for each time zone. each time zone has a level
The indicator displays Renko bars on the chart, plots two moving averages by them and generates buy/sell signals based on the conditions displayed in the screenshots and described below: the buy signal is formed if the fast moving average is above the slow moving average, from 4 to 10 consecutive bullish Renko bars are displayed, followed by no more than 2 bearish and one bullish Renko bars; the sell signal is formed if the fast moving average is below the slow moving average, from 4 to 10 conse
このプロダクトを購入した人は以下も購入しています
Gann Made Easy は、ミスター・ギャンの理論を使用した取引の最良の原則に基づいた、プロフェッショナルで使いやすい外国為替取引システムです。 W・D・ガン。このインジケーターは、ストップロスとテイクプロフィットレベルを含む正確な買いと売りのシグナルを提供します。 PUSH通知を利用して外出先でも取引可能です。 ご購入後、取引方法の説明と優れた追加インジケーターを無料で入手するには、私にご連絡ください! おそらく、ギャンの取引手法についてはすでに何度も聞いたことがあるでしょう。通常、ギャンの理論は初心者のトレーダーだけでなく、すでにある程度の取引経験がある人にとっても非常に複雑なものです。なぜなら、ギャンの取引手法は理論的にはそれほど簡単に適用できるものではないからです。私はその知識を磨き、最良の原則を私の外国為替インジケーターに組み込むために数年を費やしました。 このインジケーターは非常に簡単に適用できます。必要なのは、それをチャートに添付し、簡単な取引推奨事項に従うだけです。このインジケーターは常に市場分析の仕事を行い、取引の機会を探します。適切なエントリーポイントを検出す
M1 SNIPER は使いやすいトレーディングインジケーターシステムです。M1時間足向けに設計された矢印インジケーターです。M1時間足でのスキャルピングのためのスタンドアロンシステムとして、また既存のトレーディングシステムの一部としても使用できます。このトレーディングシステムはM1時間足での取引に特化して設計されていますが、他の時間足でも使用できます。元々、この手法はXAUUSDとBTCUSDの取引用に設計しましたが、他の市場においても役立つと考えています。 インジケーターのシグナルは、トレンドの方向と逆方向に取引できます。インジケーターのシグナルを利用して両方向に取引するのに役立つ特別な取引テクニックをご紹介します。この手法は、特別な動的なサポートとレジスタンスの価格帯を利用することに基づいています。 ご購入後、M1 SNIPER矢印インジケーターをすぐにダウンロードできます。さらに、M1 SNIPERツールのすべてのユーザーに、以下のスクリーンショットに表示されているApollo Dynamic SRインジケーターを無料で提供しています。この2つのインジケーターを組み合わせることで
Scalper Inside PRO – Since 2020. An exclusive indicator that utilizes an innovative algorithm to swiftly and accurately determine the market trend. The indicator automatically calculates opening, closing, and profit levels, providing detailed trading statistics. With these features, you can choose the most appropriate trading instrument for the current market conditions. Additionally, you can easily integrate your own arrow indicators into Scalper Inside Pro to quickly evaluate their statistics
PRO Renko Systemは、特別にRENKOチャートを取引するために設計された高精度の取引システムです。 これは、様々な取引商品に適用することができる普遍的なシステムです。 システムは効果的に正確な逆転信号へのアクセスを与えるいわゆる市場の騒音を中和する。 表示器は非常に使いやすく、信号の生成に責任がある1つの変数だけがあります。 あなたは簡単にお好みの任意の取引ツールとレンコバーのサイズにツールを適応させることができます。 私はいつもあなたが私のソフトウェアで収益性の高い取引を支援するために余分なサポートを提供する準備ができています! 私はあなたに幸せで収益性の高い取引をしたいです! ご購入後にご連絡ください! 私はあなたに私のレンコチャートジェネレータを送信します。 私はまた、私の個人的な推奨事項やシステムの他のモジュールを無料で共有します!
Auto Optimized Parabolic RSI: 高度な3Dモメンタムエンジン ほとんどのリテール向けインジケーターは、市場のボラティリティが変化した瞬間に破綻する静的な入力値に依存しているため、失敗に終わります。Auto Optimized Parabolic RSIは、自らの数学的優位性を継続的に再計算することで「インジケーターの陳腐化」問題を解決し、機関投資家レベルの定量的適応力をMT5ターミナルに直接もたらします。 最大の強み: カスタムインメモリ3D最適化   標準的な自動最適化ツールは、インジケーターの呼び出しで端末に過負荷をかけるため、頻繁にMT5プラットフォームをフリーズさせます。本ツールは、このボトルネックを完全に回避しています。RAMベースのカスタムネイティブ計算機を内蔵した内部エンジンは、チャートを読み込んだりタイムフレームを変更したりするたびに、超高速の3Dグリッド探索を実行します。RSI期間(頻度)、SARステップ(加速度)、SAR最大値(制限速度)を同時にスイープし、プラットフォームを遅延させることなく、数万通りものパラメーターの組み合わせを絶対的
ご紹介     Quantum Breakout PRO は 、ブレイクアウト ゾーンの取引方法を変革する画期的な MQL5 インジケーターです。 13年以上の取引経験を持つ経験豊富なトレーダーのチームによって開発された Quantum Breakout PROは 、革新的でダイナミックなブレイクアウトゾーン戦略により、あなたの取引の旅を新たな高みに押し上げるように設計されています。 クォンタム ブレイクアウト インジケーターは、5 つの利益ターゲット ゾーンを備えたブレイクアウト ゾーン上のシグナル矢印と、ブレイクアウト ボックスに基づいたストップロスの提案を提供します。 初心者トレーダーにもプロのトレーダーにも適しています。 量子EAチャネル:       ここをクリック MT5バージョン:   ここをクリック 重要!購入後、インストールマニュアルを受け取るためにプライベートメッセージを送ってください。 推奨事項: 時間枠: M15 通貨ペア: GBPJPY、EURJPY、USDJPY、NZDUSD、XAUUSD アカウントの種類: ECN、Raw、またはスプレッドが非
After purchase, contact me privately to receive 1 month of free testing with EA Forex Proton! This advanced MT4 trading robot automatically executes signals from any MT4 indicator, including Market Makers. The latest version also includes AI integration, allowing each trade signal to be analyzed using Artificial Intelligence. Live Signal with EA Forex Proton: Click here Market Makers is a powerful price action trading system designed to identify high-probability Buy and Sell opportunities based
このインジケーターを購入すると、プロ仕様のトレードマネージャーを無料で差し上げます。 まず第一に、このトレーディングシステムがノンリペイント、ノンリドロー、ノンラグのインジケーターであることを強調する価値がある。これにより、手動取引とロボット取引の両方に理想的なものになっています。 オンラインコース、マニュアル、プリセットのダウンロード。 「スマートトレンドトレーディングシステム MT5」は、新規および経験豊富なトレーダー向けにカスタマイズされた包括的なトレーディングソリューションです。10以上のプレミアムインジケーターを組み合わせ、7つ以上の堅実なトレーディング戦略を備えており、多様な市場状況に対応する多目的な選択肢となっています。 トレンドフォロー戦略:トレンドを効果的に乗り越えるための正確なエントリーとストップロス管理を提供します。 リバーサル戦略:潜在的なトレンドの反転を特定し、トレーダーがレンジ相場を活用できるようにします。 スキャルピング戦略:高速で正確なデイトレードおよび短期取引のために設計されています。 安定性:すべてのインジケーターはノンリペイント、ノンリドロー、ノ
これはほぼ間違いなく、MetaTraderプラットフォームで見つけることができる最も完全な調和価格形成自動認識インジケーターです。 19種類のパターンを検出し、フィボナッチプロジェクションをあなたと同じように真剣に受け止め、潜在的逆転ゾーン(PRZ)を表示し、適切なストップロスとテイクプロフィットレベルを見つけます。 [ インストールガイド | 更新ガイド | トラブルシューティング | よくある質問 | すべての製品 ] 19の異なる調和価格形成を検出します プライマリ、派生および補完フィボナッチ投影(PRZ)をプロットします 過去の価格行動を評価し、過去のすべてのパターンを表示します この指標は、独自の品質とパフォーマンスを分析します 適切なストップロスとテイクプロフィットのレベルを表示します ブレイクアウトを使用して適切な取引を通知します すべてのパターン比をグラフにプロットします 電子メール/音声/視覚アラートを実装します スコット・M・カーニーの本に着想を得て、この指標は最も純粋で急を要するトレーダーのニーズを満たすように設計されています。ただし、トレードを容易にする
Please send me Direct message on MQL5 CHAT after purchasing the Indicator for Training and Installation Support There are some additional files that is important to use with the Indicator . So be sure to contact me after purchasing the Indicator So that I can add you for training and support . If you find any difficulty with installation then send me Direct message here So that I can connect with you via Anydesk or Teamview for the product installation. " Smart Order Block Indicator " to find m
ゴールドラッシュ・トレンド・アロー・シグナル ゴールドラッシュ・トレンド・アロー・シグナル 指標は、XAU/USDにおける高速・短期スキャルパー向けに最適化された、正確でリアルタイムのトレンド分析を提供します。 1分足専用に設計されたこのツールは、明確なエントリーポイントを示す方向矢印を表示し、スキャルパーが変動の激しい市場状況でも自信を持って取引できるよう支援します。 この指標は、PRIMARY(主要)とSECONDARY(補助)のアラート矢印で構成されています。PRIMARYシグナルは、トレンドの方向転換を示す白と黒の方向矢印であり、SECONDARYシグナルは、PRIMARY矢印が示す方向を確認し、潜在的なエントリーポイントを示す青と赤の矢印です。 注意:トレンド方向の変化後にPRIMARYアラート矢印が1つだけ表示される場合、複数のSECONDARY青/赤矢印が表示される点に注意が必要です。SECONDARYシグナルは、シグナル基準を満たす任意のローソク足後に表示されます。したがって、長期的なトレンド移動の場合、画面に多くのSECONDARY矢印が表示されます(添付の
デイトレーダーマスターは、デイトレーダーのための完全なトレーディングシステムです。システムは2つのインジケーターで構成されています。 1つの指標は売買する矢印信号です。それはあなたが得る矢印インジケーターです。 2つ目のインジケーターを無料で提供します。 2番目のインジケーターは、これらの矢印と組み合わせて使用​​するために特別に設計されたトレンドインジケーターです。 インジケーターは繰り返さず、遅れないでください! このシステムの使用は非常に簡単です。 2色の線で表示されている現在のトレンドの方向に矢印信号をたどる必要があります。青は買いの傾向です。赤い色は売りの傾向です。青い矢印は買いシグナルです。赤い矢印は売りの合図です。トレンドラインの色と一致するように、矢印の色と信号の方向が必要です。 矢印インジケーターは、主に時間間隔M5とM15での日中取引のために作成されました。ただし、技術的には、システムは他の時間間隔で使用できます。 インジケータには、PUSHメッセージ機能を備えたポップアップアラートが装備されています。 購入後、必ず私に書いてください!私はあなたにシステムとの取引の
「 Dynamic Scalper System 」インジケーターは、トレンド波の中でスキャルピング取引を行う手法のために設計されています。 主要通貨ペアと金でテスト済みで、他の取引商品との互換性があります。 トレンドに沿った短期的なポジションオープンのシグナルを提供し、追加の価格変動サポートも提供します。 インジケーターの原理 大きな矢印はトレンドの方向を決定します。 トレンド波の中では、小さな矢印の形でスキャルピングシグナルを生成するアルゴリズムが機能します。 赤い矢印は強気方向、青い矢印は弱気方向です。 トレンドの方向には敏感な価格変動ラインが描かれ、小さな矢印のシグナルと連動します。 シグナルは次のように機能します。適切なタイミングでラインが現れるとエントリーシグナルが形成され、ラインが開いている間はポジションが保持され、完了すると取引が終了します。 推奨される動作時間枠はM1~H4です。 矢印は現在のローソク足に形成され、次のローソク足が開いている場合は、前のローソク足の矢印は再描画されません。 入力パラメータ Trend Wave Period - トレンド方向
トレンドトレーディング は、タイミングのプルバックとブレイクアウトにより、市場で起こっているトレンドから可能な限り利益を得るように設計された指標です。確立されたトレンドの中で価格が何をしているかを分析することにより、取引の機会を見つけます。 [ インストールガイド | 更新ガイド | トラブルシューティング | よくある質問 | すべての製品 ] 自信を持って効率的に金融市場を取引する むち打ちにならずに確立されたトレンドから利益を得る 収益性の高いプルバック、ブレイクアウト、早期の逆転を認識する この指標は、独自の品質とパフォーマンスを分析します 複数時間枠のダッシュボードを実装します インジケーターは再描画されていません 電子メール/音声/視覚アラートを実装します 確立されたトレンドは多くの取引機会を提供しますが、ほとんどのトレンド指標はそれらを完全に無視しています。インジケーターの解釈はかなり簡単です: (1) トレンドの変化 (2) トレンドの方向への後退 (3) トレンドの方向へのブレイクアウト 赤いダッシュ は下降トレンド中の修正です 青いダッシュ は上昇トレンド中
GOLD Impulse with Alert
Bernhard Schweigert
4.67 (12)
このインディケータは、当社の2つの製品 Advanced Currency IMPULSE with ALERT  +   Currency Strength Exotics . のスーパーコンビネーションです。 このインジケーターは全ての時間枠で作動し、8つの主要通貨と1つのシンボルの強弱のインパルスをグラフで表示します。 このインジケータは、金、エキゾチックペア、商品、インデックス、先物など、あらゆるシンボルの通貨強度の加速度を表示することに特化されています。金、銀、原油、DAX、US30、MXN、TRY、CNHなどの通貨強度の加速度(インパルスまたは速度)を表示するために、任意のシンボルを9行目に追加できる、この種の最初のものです。 新しいアルゴリズムに基づいて構築され、潜在的な取引の特定と確認がさらに容易になりました。これは、通貨の強さや弱さが加速しているかどうかをグラフィカルに表示し、その加速の速度を測定するためです。加速すると物事は明らかに速く進みますが、これはFX市場でも同じです。つまり、反対方向に加速している通貨をペアリングすれば、潜在的に利益を生む取引を特定
Advanced Supply Demand
Bernhard Schweigert
4.91 (300)
現在40%オフ 初心者にもエキスパートトレーダーにも最適なソリューション このインジケーターは独自の機能と新しい公式を多数内蔵しており、ユニークで高品質かつ手頃な取引ツールです。このアップデートでは、2つの時間枠ゾーンを表示できるようになります。より長いTFだけでなく、チャートTFとより長いTF(ネストゾーンを表示)の両方を表示できます。すべてのSupply Demandトレーダーの皆さんのお気に召すはずです。:) 重要情報の公開 Advanced Supply Demandの可能性を最大化するには、 https://www.mql5.com/ja/blogs/post/720245 にアクセスしてください。   エントリーまたはターゲットの正確なトリガーポイントを正確に特定できれば取引がどのように改善されるか想像してみてください。新しい基盤となるアルゴリズムに基づいて構築されているため、買い手と売り手の間の潜在的な不均衡をさらに簡単に特定できます。これは、最も強い需要と供給のゾーンと、過去のパフォーマンス(古いゾーンを表示)がグラフィカルに表現されるためです。これらの機能は、最適な
CRT Candle Range Theory HTF MT4.   Ultimate CRT Indicator: Advanced ICT Concepts and Malaysian SnR Trading System Discounted   Price   $50  !!     Secure your lifetime access   now   before it switches to   subscription-only ! Master the Market Maker's Footprints with the Most Advanced Candle Range Theory Indicator Unlock the true power of   Smart Money Concepts (SMC)   and trade precisely like the institutions with the   Ultimate CRT Indicator . Built exclusively for serious traders, this indic
このインディケータは、異なる期間のフラクタルの価格構造を調べて、市場で起こり得る反転ポイントを決定し、すでに基本的または技術的な評価モデルを持っているポジショントレーダーにタイミングを提供します。弟の リバーサルフラクタル とは異なり、このインジケーターは選択された期間のためにリバーサルを逃すことはなく、ジグザグ形式でリバーサルフラクタルを見つけます。 [ インストールガイド | 更新ガイド | トラブルシューティング | よくある質問 | すべての製品 ] ターニングポイントは長いトレンドを開始できます インジケーターは再描画されていません あらゆる種類のアラートを実装します カスタマイズ可能な色とサイズ フラクタルは奇数番目のバーのフォーメーションであり、フォーメーションの最上位または最下位の中間バーであり、フラクタル内のすべてのバーが閉じるとインディケーターが描画されるため、このインジケーターはリアクティブまたは遅れ信号です。ただし、既存の方向バイアスを持つトレーダーは、この指標が非常に有用であり、早期のエントリポイントを取得します。 このインディケーターは、ボイルダウンされた
サポート線と抵抗線のプロットにうんざりしていませんか? サポートレジスタンス は、非常に興味深いひねりを加えてチャート内のサポートとレジスタンスラインを自動検出およびプロットするマルチタイムフレームインジケーターです。価格レベルは時間とともにテストされ、その重要性が高まるにつれて、ラインは太くなり、暗くなります。 [ インストールガイド | 更新ガイド | トラブルシューティング | よくある質問 | すべての製品 ] 一晩でテクニカル分析を強化 チャートを閲覧せずに重要な価格レベルを検出 一目ですべての価格レベルの相対的な強さを認識する すべての取引で最大30時間のプロットラインを節約 インジケーターは、すべての価格レベルの年齢を表示します インジケーターは再描画されていません 過去および現在の価格レベルは近接によって崩壊し、現在の市場行動に合わせて調整されます。動作は、必ずしもピークではない場所に線が引かれます。 価格レベルは、時間とともに拒否されるにつれて、より暗く、より広くなります ノイズを避けるために、重要でない価格レベルは定期的にクリアされます カスタマイズ可能な時間枠の
They say history repeats itself. What if you could prove it in real-time? The Propfolio Ghost Pattern is an advanced algorithmic pattern-matching engine. It empowers you to select any current price action structure on your chart and instantly scan thousands of historical candles to find the exact moment in the past where the market did the exact same thing. Once it finds the highest probability match, it projects the historical outcome into the future as "Ghost Candles"—giving you a highly calcu
まず第一に、この取引インジケーターは再描画されず、再描画されず、遅延しないことを強調する価値があります。これにより、手動取引とロボット取引の両方に理想的なものになります。 ユーザーマニュアル:設定、入力、戦略。 アトミックアナリストは、価格の強さとモメンタムを利用して市場でより良いエッジを見つけるためのPA価格アクションインジケーターです。ノイズや誤ったシグナルを除去し、取引ポテンシャルを高めるための高度なフィルターを備えています。複雑なインジケーターの複数のレイヤーを使用して、アトミックアナリストはチャートをスキャンし、複雑な数学的計算をシンプルなシグナルと色に変換します。これにより、どのような初心者トレーダーでも理解して使用し、一貫した取引の決定を行うことができます。 「アトミックアナリスト」は、新規および経験豊富なトレーダー向けにカスタマイズされた包括的な取引ソリューションです。プレミアムインジケーターとトップノッチの機能を1つの取引戦略に組み合わせ、すべてのタイプのトレーダーにとって汎用性のある選択肢にします。 デイリートレーディングとスキャルピング戦略:高速で正確な
現在26%OFF! このインディケータは、当社のメインインディケータ( Advanced Currency Strength 28   &  Advanced Currency IMPULSE with ALERT )の両方のスーパーコンビネーションです。28の外国為替ペアのTICK-UNITSとアラートシグナルの通貨強度の値を示しています。11種類のTick-Unitが使用可能です。1、2、3、4、5、6、10、12、15、20、30秒の11種類です。サブウィンドウのTick-Unitバーは、秒単位のタイマーに1ティック以上含まれる場合に表示され、左側にシフトされます。 たった1枚のチャートで、28のFXペアをスキャルピングできます。スキャルピングのチャンスとなるトリガーポイントを正確に把握することで、スキャルピングが上達することを想像してみてください。 1分足よりも短い期間で動作する市場初の通貨強度インジケーターです! このインジケータは、素早いインとアウトを行い、小さなピップを切り取ることを望む高速スキャルパーのためのものです。 ユーザーマニュアル: ここをクリック h
KURAMA GOLD SIGNAL PRO(MT4版)— 7層フィルター・自動TP/SL・品質スコア搭載 XAUUSD完全トレードシステム リペイントなし。リドローなし。ラグなし。すべてのサインは確定後に変わりません。見たままが結果です。 特典:買い切りライセンスをご購入いただいた方に、AI Zone Radar($59相当)+PDFマニュアルを無料プレゼント。購入後にMQL5でメッセージをお送りください。 AI Zone Radar: https://www.mql5.com/en/market/product/175834 トレーダーから信頼されています:ゴールドトレーダーのコミュニティで実際に使用され、精度と使いやすさで高く評価されています。 あなたの問題 — そしてその解決策 ゴールドは1日$30〜$50動く。チャンスがあるのは分かっている。でもこういう経験はないか: - エントリーが早すぎて、$10逆行してから思った方向に動く - MAタッチのたびに入って、半分は負ける - TP/SLの基準がないから、持ちすぎるか早すぎる決済をする - 動かない時間帯にトレ
購入後、このインジケーターに基づいたボーナスEAを受け取るためにご連絡ください。 Self Optimizing Double MA Strategyは、パラメータ推測の必要性を排除するために設計されたプロフェッショナルグレードの取引ツールです。組み込みの自動最適化エンジンを搭載し、バックグラウンドで何千ものパラメータの組み合わせをシミュレートすることで、変化する市場状況に継続的に適応し、統計的な優位性を維持します。 静的で時代遅れの設定に依存するのではなく、インジケーターは自身のロジックを動的に更新し、現在の時間枠と取引商品にとって最も収益性の高い構成を見つけ出します。 主な機能 組み込みの自動最適化: 選択した更新頻度に基づいて、システムはFast MA、Slow MA、およびRSIの期間を定期的に再計算し、設定が常に現在の市場のリズムと一致するようにします。 MAダイバージェンスフィルター: 移動平均線が明確に乖離している(広がっている)場合にのみシグナルを検証する、トレンド強度のコア指標です。これにより、移動平均線が収束している相場や平坦なレンジ相場での誤ったエントリーを防ぎ
Gold Scalper Super is an easy-to-use trading system. The indicator can be used as a standalone scalping system on the M1 time frame, as well as part of your existing trading system. Bonus: when purchasing an indicator, Trend Arrow Super is provided free of charge, write to us after purchase. The indicator 100% does not repaint!!! If a signal appears, it does not disappear! Unlike indicators with redrawing, which lead to the loss of a deposit, because they can show a signal and then remove it.
現在40%オフ 初心者やエキスパートトレーダーに最適なソリューション! このインジケーターは、独自の機能と新しい計算式を取り入れた、ユニークで高品質、かつ手頃な価格のトレーディングツールです。たった1枚のチャートで28の為替ペアの通貨強度を読み取ることができます。新しいトレンドやスキャルピングチャンスの引き金となるポイントを正確に特定することができるので、あなたのトレードがどのように改善されるか想像してみてください。 ユーザーマニュアルはこちら  https://www.mql5.com/en/blogs/post/697384 これが最初の1本、オリジナルだ! 価値のないクローンを買わないでください。 特別な サブウィンドウの矢印で強い通貨の勢いを表示 GAPがあなたのトレードを導く! 基準通貨や気配値が売られすぎ・買われすぎのゾーン(外相フィボナッチレベル)にあるとき、個別チャートのメインウィンドウに警告表示。 通貨がレンジの外側から反落した場合、プルバック/リバーサルのアラート。 クロスパターンの特別なアラート 複数の時間枠を選択可能で、トレンドを素早く確認できます
チャートを構成し、周期的な価格変動を識別するテクニカル指標。 どのチャートでも動作します。 いくつかの種類の通知。 グラフ自体に追加の矢印があります。 履歴を再描画せずに、キャンドルのクローズに取り組みます。 M5以上のTFを推奨します。 パラメータの使用と設定が簡単です。 異なるパラメータを持つ 2 つのインジケーターを使用する場合、他のインジケーターなしで使用できます。 入力パラメータは2つあります 周期性と信号持続時間 これら 2 つのパラメータは、チャート構造の処理を扱います。 Cyclicity - 反転サイクルが変化する頻度を調整し、サイクルを滑らかにします。 Signal duration - 最小数では価格変動の衝動を検出し、最大数では長期的なトレンドの動きを検出します。
The indicator is built on a non-standard Zig Zag, it draws accumulations after which if the price leaves this zone and a test of this zone occurs, then a sound signal is given and an arrow appears - after the test candle closes.The indicator does not redraw its signals, it is very easy to use, there are only three settings 1- this is the zig zag parameter 2- this is the minimum price exit from the zone 3- this is the maximum price exit from the zone. The lower the parameter for Zig Zag, the more
ZigZag Lines MTF
Taras Slobodyanik
4.38 (13)
Multi timeframe ZigZag indicator. It displays the support/resistance horizontal lines and their breakouts, as well as draws the current targets of the market. It can also display lines of the Fractals indicator and candles from other periods (up to Quarterly). So, you can actually see the supply and demand levels. Indicator – connects key lows and highs to show trend lines. You can also use it as indicator for the Break of Structure(BOS) & Market Structure Shift(MSS). The indicator redraws the
Trend Screener
STE S.S.COMPANY
4.79 (95)
トレンドインジケーター、1つのツールに組み込まれたすべての重要なトレンド機能を備えたトレンドトレーディングとフィルタリングのための画期的なユニークなソリューション! これは、すべてのシンボル/商品(外国為替、商品、暗号通貨、インデックス、株式)で使用できる100%再描画されていないマルチタイムフレームおよびマルチ通貨インジケーターです。 期間限定オファー: サポートおよびレジスタンス スクリーナー インジケーターは、たった 65 ドルで永久的にご利用いただけます。(元の価格 250 ドル) (オファー延長) トレンドスクリーナーは、チャート内のドットで矢印トレンドシグナルを提供するインジケーターに続く効率的なインジケーターです。 トレンド分析インジケーターで使用できる機能: 1.トレンドスキャナー。 2.最大利益分析を備えたトレンドライン。 3.トレンド通貨強度メーター。 4.アラート付きのトレンド反転ドット。 5.アラート付きの強いトレンドドット。 6.トレンド矢印 毎日の分析例、毎日のシグナルパフォーマンス...など、トレンドスクリーナーインジケーターを使用して、ここで見つけること
作者のその他のプロダクト
Raiden Forex
Ruben David Santana Rodriguez
5 (1)
Este indicador es muy practico ya que nos ofrece las señales directamente en el grafico en forma de linea , pero no solo eso , la misma linea nos indica el stop loss , al mismo tiempo , el indicador nos dice cuando salir del mercado con el cambio de señal pero para eso habria que monitorizar la señal por lo que se puede optar por poner un take profit minimo de 1:1. Las señales son claras , en el momento en que el indicador dibuja debajo del precio una linea azul , se abre una operacion de compra
Gato Forex
Ruben David Santana Rodriguez
これは非常に解釈しやすいシグナルのトレンドインジケーターです。たとえば、1Hおよび4Hで操作するには、1Dチャートで確認する必要があり、1Dチャートで操作するには、1Wチャートで確認する必要があります。シグナルは次のとおりです。次に、インジケーターが緑のシグナルを提供するときにロングを入力します。逆に、インジケーターが赤のシグナルを提供するときにショートを入力します。ストップロスはシグナルの最後の高/低振動に配置されます。 、テイクプロフィットは2:1になります。お役に立てば幸いです。 デモ版をダウンロードして、無料でお試しください!!!! あなたは何も失うことはありません、多分あなたはたくさん勝ちます
Hunter RD
Ruben David Santana Rodriguez
Tunnel Trend Forex
Ruben David Santana Rodriguez
Indicador de tunel de tendencia , este indicador se utiliza de la siguiente forma : Para entradas al alza , el precio debe cerrar primero por encima del tunel , si despues de cerrar el precio encima del tunel la siguiente vela abre y cierra su precio por encima del tunel abriremos una operacion al alza , para las operaciones a la baja las condiciones son las mismas solo que al contrario , el precio debe cerrar debajo del tunel y la siguiente vela debe abrir y cerrar debajo del tunel , el stop lo
Arrow Forex
Ruben David Santana Rodriguez
Este es un indicador tecnico que nos ofrece señales de entrada al mercado , el indicador no repinta , se puede utilizar en cualquier timeframe , yo lo recomiendo en periodos largos ya que es mi estilo de trading pero para aquellos que hagan scalping tambien puede funcionar , en el video lo muestro con una media movil de 150 periodos a modo de ejemplo . Las señales son las siguientes , entraremos largo cuando en el grafico se muentre una flecha azul , por el contrario si la flecha es roja entrare
RD Trend Forex
Ruben David Santana Rodriguez
Indicador Forex de tendencias , puede emplearse en cualquier timeframe aunque lo recomiendo en periodos de 4 horas , puede añadirse a tu estrategia o crear una estrategia con el . Las señales son las siguientes , se entra en largos cuando el indicador cambia a color azul , por el contrario se entrará en cortos cuando el indicador cambie su color a rojo , el stop loss se coloca en la ultima oscilacion alto\bajo del precio y el take profit minimo a 1:1 aunque yo recomendaria 2:1 , eso es elección
フィルタ:
レビューなし
レビューに返信