Volume Statistic

5

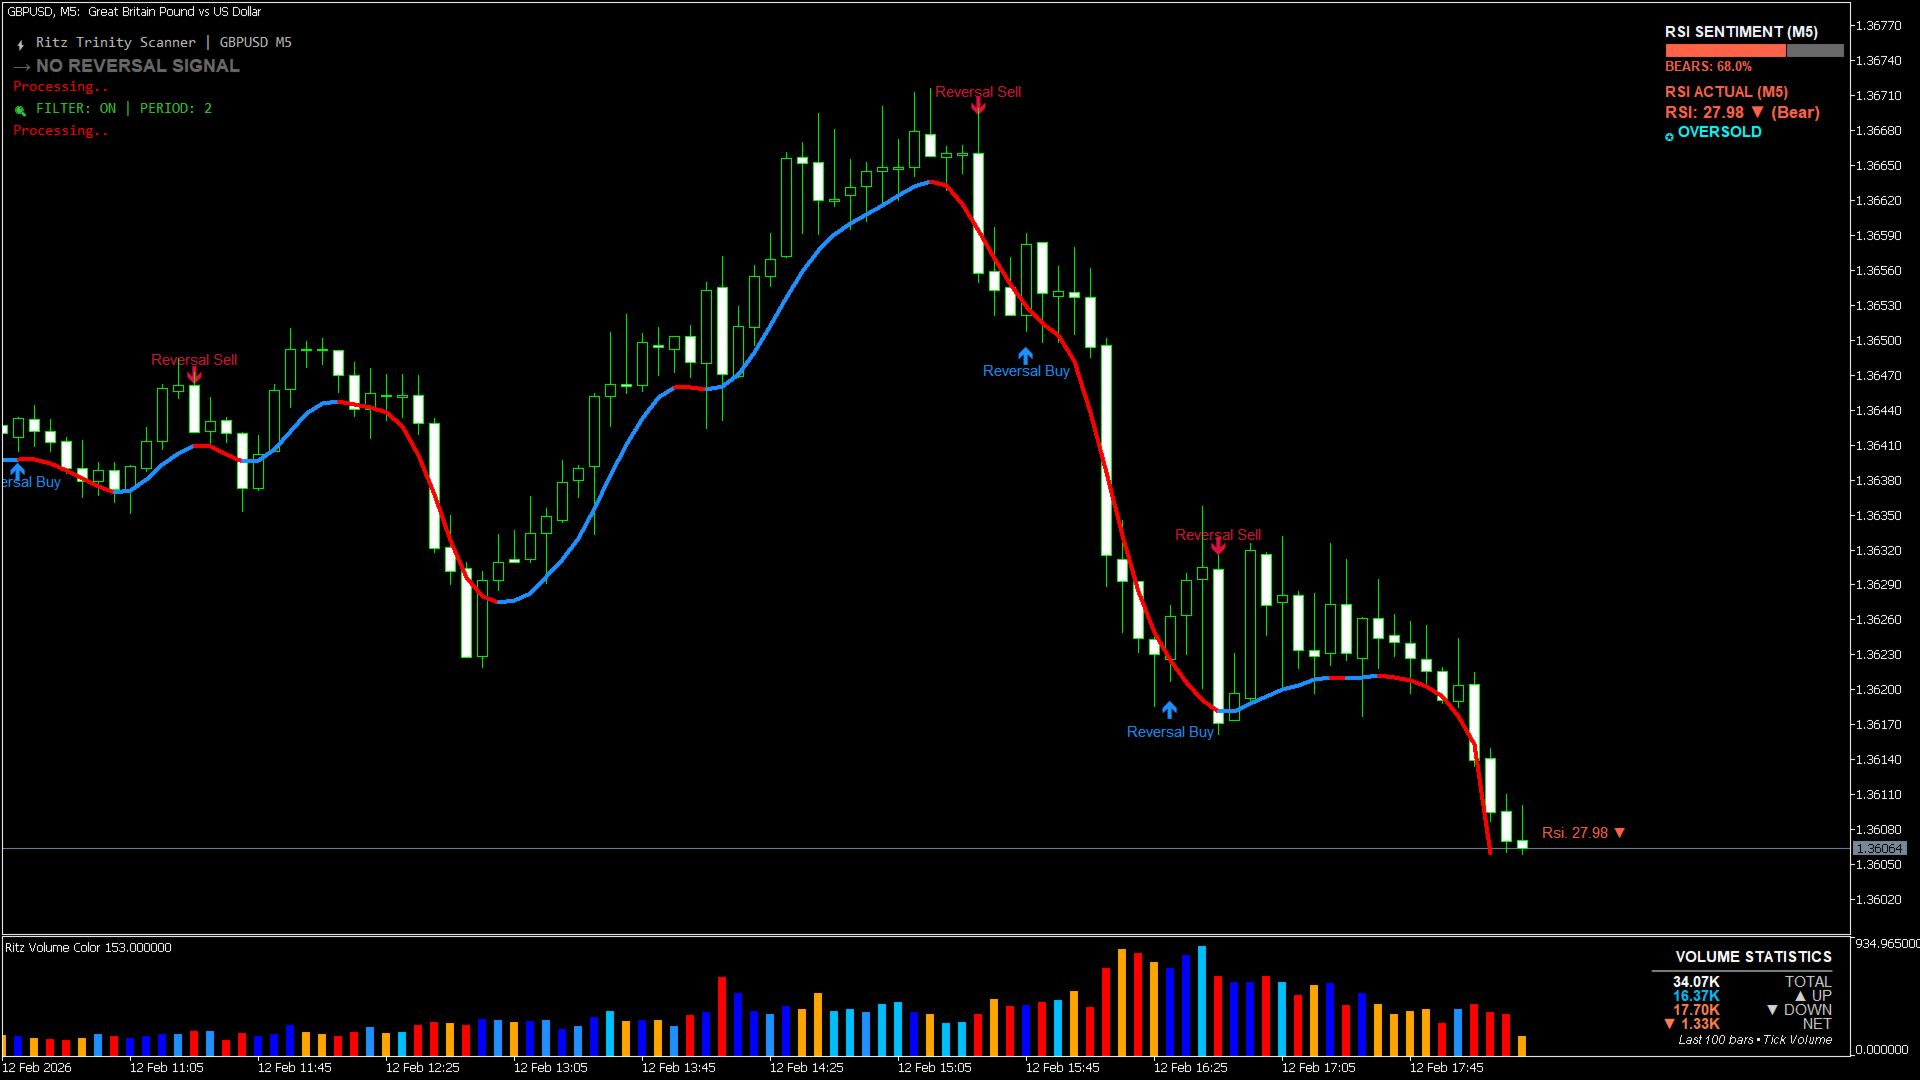
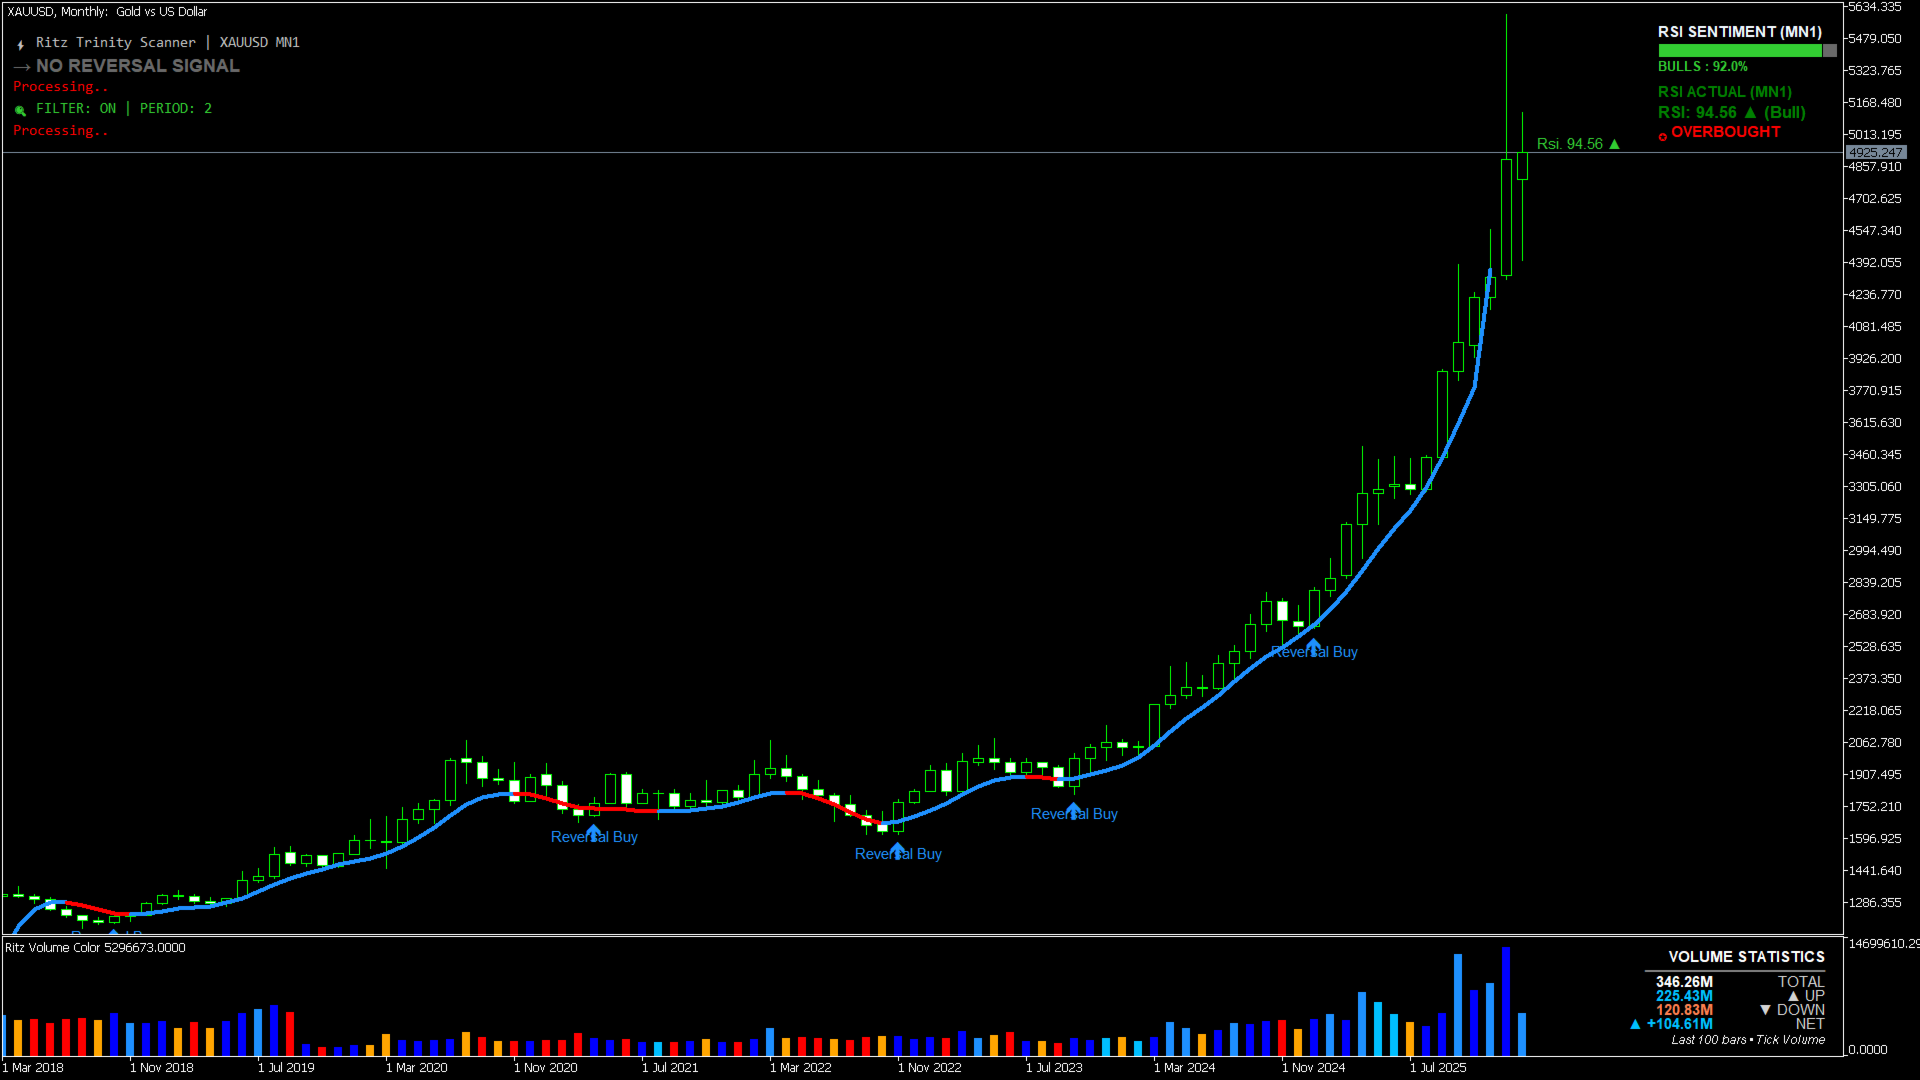
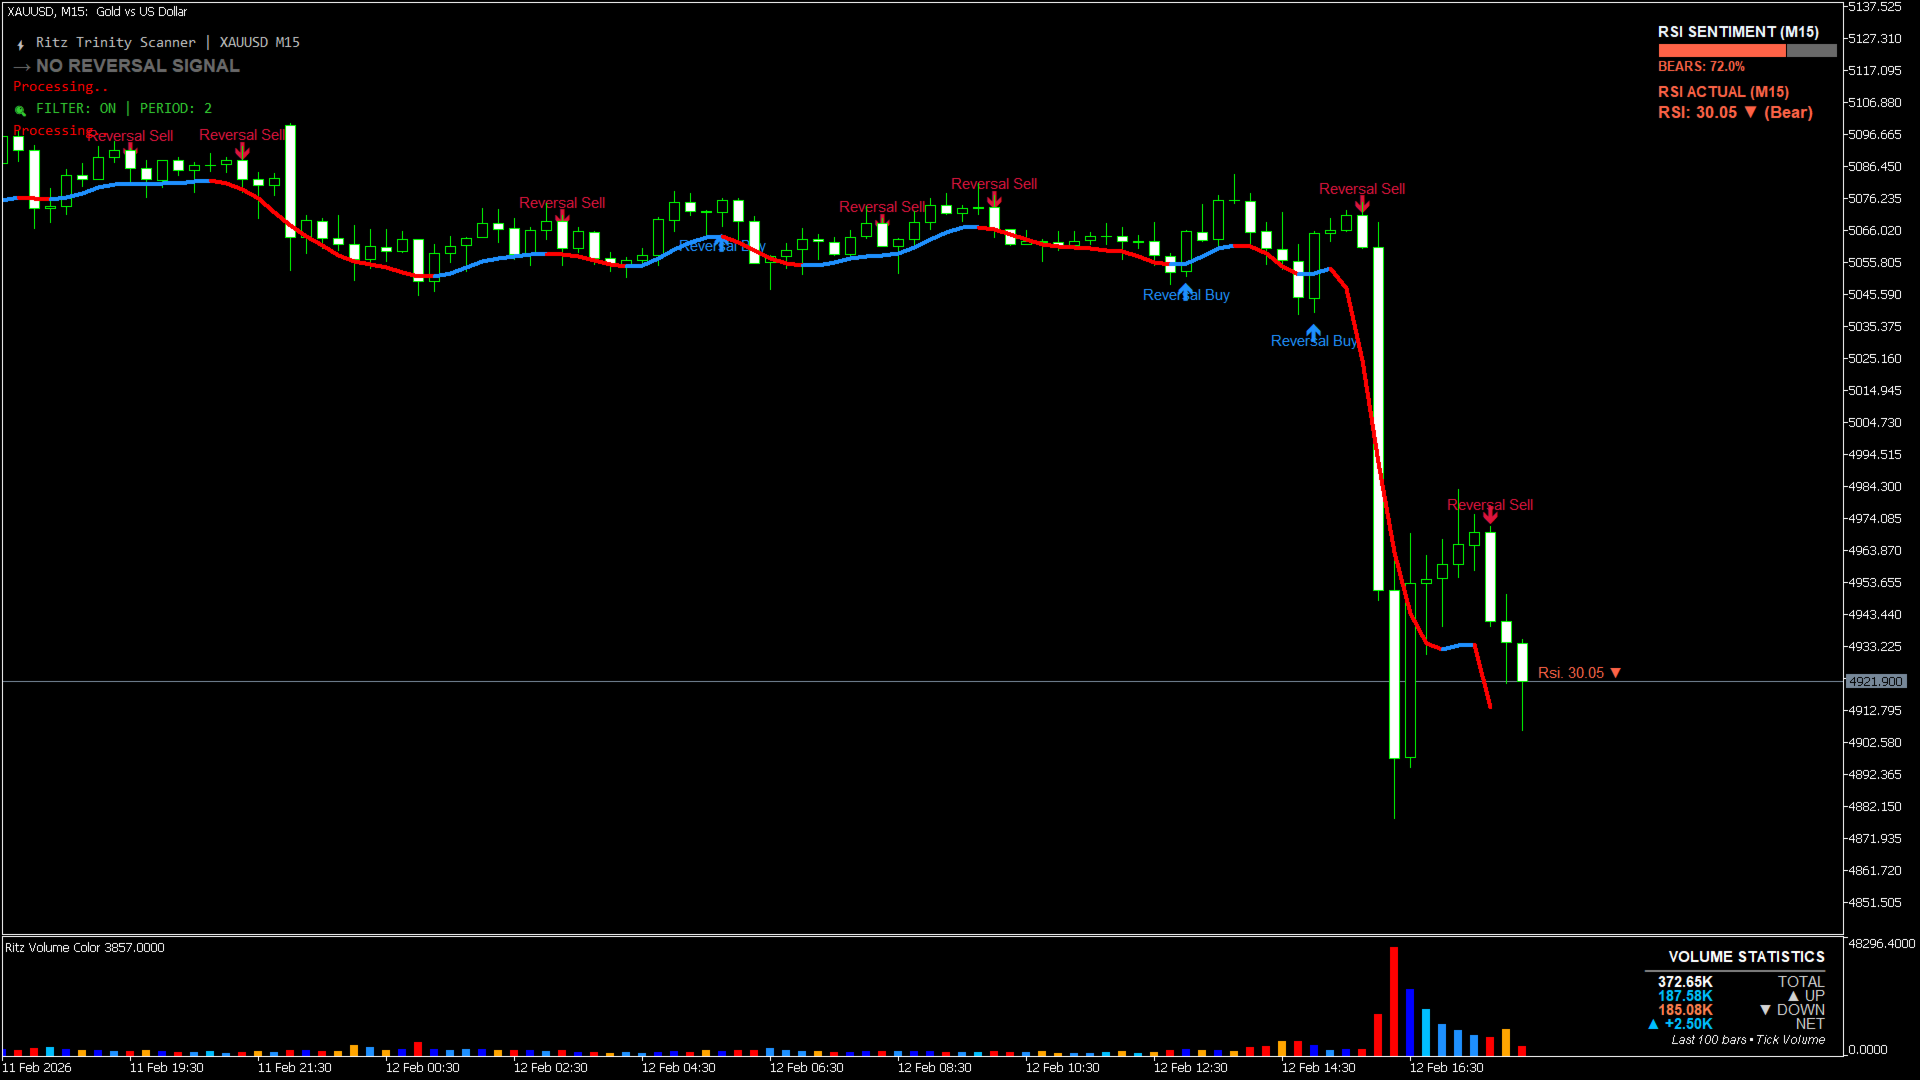
Ritz Volume Statistic – Color Volume Histogram & Market Flow Insight

Ritz Volume Statistic is a clean and powerful volume analysis indicator designed to visualize bullish and bearish market pressure through a dynamic color-graded volume histogram.

The indicator transforms raw tick volume into an intuitive color spectrum, allowing traders to instantly identify volume expansion, exhaustion, and dominance shifts between buyers and sellers. A built-in statistical panel summarizes total volume, bullish volume, bearish volume, and net volume balance over recent bars, providing quick insight into current market strength.

Optimized for clarity and performance, Ritz Volume Statistic works smoothly on all symbols and timeframes, making it ideal for scalping, intraday trading, and trend confirmation. It can be used as a standalone volume tool or as a confirmation layer alongside price action, reversal, or Smart Money Concept strategies.

レビュー 1
Xuntao Su
894
Xuntao Su 2026.02.15 12:52 
 

1-its also will be much better if can make a X/Y position with the volume-panel of sub-chart ,

2-up volume should go upside of 0-line, down volume should go downside of 0-line , so this will be much clearly;

thanks !

おすすめのプロダクト
Swiss VWAPsimple
Terence Gronowski
4.8 (5)
Swiss VWAPsimple Motivation Did not find free VWAP that works, the one that I found craseh. So I created a VWAP which calculates values only for the actual day. So computer resouces are not over stressed. What is VWAP, how is it used?  VWAP stands for Volume Weighed Average Price, it calculates the running sum of tick volume and the runnung sum of price times tickvolume. The division of these sums result in a weighed price (Sum P*V/Sum V). The calculation starts normally at midnight. The values
FREE
White Weis Volume This indicator shows the sum of the volume in each wave, bulish or bearish, as idealized by David Weis , but it brings an important addition , which is the marking of the bar with the highest volume of the wave (White Bar)! In coding the indicator, it was sought to optimize the code to require minimal processing during use and not to overload mt5. The indicator can be used for pre-trading analysis and study, where the trader analyzes possible points of support and resistance
B2U Market State System Part of the B2U Market State System A professional indicator suite designed to analyze market structure, trend state, and momentum. B2U Market State System 의 구성 요소입니다. 시장 구조, 추세 상태, 모멘텀을 입체적으로 분석하기 위한 전문 인디케이터 시스템입니다. Highlights structurally validated reaction zones after FVG inversion. The New Generation of Inversion Fair Value Gaps B2U IFVG BOX & Zone visually analyzes market reaction zones formed after Fair Value Gap (FVG) inversion. 차세대 Inversion Fair Value Gaps FVG 반
FREE
English VWAP Daily (Clean) is a simple and lightweight indicator that plots the classic Daily VWAP (Volume Weighted Average Price) directly on your MT5 chart. Features: Classic Daily VWAP calculation Supports real volume (if available) or tick volume Timezone offset option to match your broker’s server time Weekend merge option (merge Saturday/Sunday data into Friday) Clean version → no arrows, no alerts, only VWAP line VWAP is widely used by institutional traders to identify fair value, su
FREE
Time Candle with Sound Alert This indicator will be display the time left candle Features : 1. Multi Time Frames, Multi Pairs 2. Time Left 2. Position dynamic with Bid Price or Edge of Chart Screen 3. Font Size and Color 4. Display Current Spread, Maximum Spread and Minimum Spread Note: Maximum and Minimum Spread will be reset when you change TF Tested On MT5 Version 5 Build 5200 If you want the source code, just PM me
FREE
VWAP Anchor Tool
Jackson Mukurani Wanguthi
Anchored VWAP is a lightweight, interactive volume-weighted average price indicator designed for traders who need precision without clutter. Unlike standard VWAP that resets every session, this tool lets you drop up to five custom anchors directly on any candle. Each anchor calculates VWAP from that exact point forward, complete with standard deviation bands to highlight where price may find support or resistance relative to volume. Key Features: • Up to 5 simultaneous anchors — compare multi
FREE
Peak Trough Analysis is the great tool to detect peaks and troughs in your chart. Peak Trough Analysis tool can use three different peaks and troughs detection algorithm. The three algorithm include the orignal Fractals Indicator by Bill Williams, the Modified Fractals indicator and ZigZag indicator. You can use this peak and trough analysis tool to detect the price pattern made up from Equilibrium Fractal-Wave process. For further usage, there are good guide line on how to use this peak trough
FREE
Important Lines
Terence Gronowski
4.88 (24)
This indicator displays Pivot-Lines, preday high and low, preday close and the minimum and maximum of the previous hour. You just have to put this single indicator to the chart to have all these important lines, no need to setup many single indicators. Why certain lines are important Preday high and low : These are watched by traders who trade in a daily chart. Very often, if price climbs over or falls under a preday low/high there is an acceleration in buying/selling. It is a breakout out of a
FREE
Raymond Cloudy Day Indicator for MT5 – Pivot-Based Reversal and Trend Levels Raymond Cloudy Day Indicator is a pivot-based level indicator for MetaTrader 5 (MT5). It was developed by Ngo The Hung based on Raymond’s original idea and is designed to give a structured view of potential reversal zones, trend extensions and support/resistance levels directly on the chart. The default settings are optimised for XAUUSD on the H1 timeframe, but the indicator can be tested and adjusted for other symbols
FREE
Shadow Flare インジケーターは、MetaTrader 5 向けの 非リペイント型トレンド & 流動性ツール です。設定可能な移動平均ベースライン(HMA / EMA / SMA / RMA から選択)を計算し、その上下に ATR(Average True Range)ベースのバンドを巻き付けることで「粘着性」のあるトレンド状態を生成します。トレンド状態は、価格の終値が上側バンドまたは下側バンドを明確にブレイクしてクローズしたときにだけ反転します。同じトレンドエンジンが自動サプライ・デマンドゾーンモジュールも駆動し、スイングハイ/スイングローを検出してその周囲に色付きボックスを描画し、価格がクローズでゾーンを抜けた瞬間にそのゾーンを無効化(ミティゲート)します。 トレンド状態が反転したバーで買い・売りシグナルが発生し、オプションの出来高フィルターと RSI フィルターにより、弱いエントリーやモメンタムに逆行するエントリーをブロックできます。内蔵ダッシュボードはリアルタイムでトレンドバイアス、モメンタム(RSI ベース)、出来高ステータスを表示します。ポップアップ、サウンド、モ
FREE
Last Day Support & Resistance Platform: MetaTrader 5 Type: Custom Indicator Display: Chart Window (Overlay) Functions: Calculates Support and Resistance zones based on high/low patterns of the previous day. Uses a sliding sampling window ( SampleWindowSize ) to detect recent price ranges. Detects potential support if current price range is significantly below previous highs. Detects potential resistance if price range is significantly above previous lows. Updates four output buffers: LDResistanc
FREE
Pivot Points are a classic technical analysis indicator that calculates the central pivot point (PP) as well as support (S1–S3) and resistance (R1–R3) levels based on the previous day’s High, Low, and Close. The indicator allows you to: • identify key zones where the price may bounce or break through • determine the direction of the trend • find good entry points, as well as set stop loss and take profit levels Indicator settings: • enable/disable PP, R1/S1, R2/S2, R3/S3 • enable/disable price l
FREE
VWAP Diaria
Samuel De Souza Ferreira
Daily VWAP — Institutional Reference for Intraday Value The Daily VWAP is a professional indicator based on the Volume-Weighted Average Price (VWAP) , designed to reveal the true balance between price and volume throughout the trading session. Unlike traditional moving averages, the Daily VWAP incorporates the weight of traded volume in every price movement, providing a much more accurate reference to the behavior of institutional traders and large market participants. What the indicator deliver
FREE
HTF Candles Nikaは、MetaTrader 5の現在のチャートに、任意の上位時間足のローソク足をフルサイズで直接オーバーレイ表示します。チャートを切り替えることなく、マルチタイムフレームの視点を提供します。 主な機能 - 上位時間足のローソク足を、ヒゲ付きの塗りつぶし矩形として現在のチャートに描画 - 標準ローソク足とHeiken Ashiの両表示モードに対応 - 現在のHTFローソク足が閉じるまでの残り時間をリアルタイムでカウントダウン表示 - 陽線・陰線のカラーをカスタマイズ可能 - ローソク幅の自動または手動制御 - ヒゲの幅、フォント、フォントサイズ、テキスト位置オフセットを設定可能 - あらゆるシンボルと時間足の組み合わせに対応 - セッションのギャップを自動検出してレンダリングを調整 - 軽量設計 — チャートオブジェクトのみ使用、インジケーターバッファなし 入力パラメーター 表示設定 - Max Lookback — 描画するHTFバー数(デフォルト:500) - Timeframe — 表示する上位時間足(デフォルト:H1) - Bars Mode
FREE
Macro-R Pro Signal — Advanced Trading Signal Indicator Macro-R Pro Signal is a professional trading indicator designed to deliver high-quality BUY and SELL signals with enhanced precision and reduced market noise. By combining Bollinger Bands, RSI, and adaptive volatility filtering , this indicator helps traders identify high-probability reversal points while avoiding unfavorable market conditions. How the Strategy Works This indicator is built on a mean reversion + momentum confirmation concep
FREE
Weis Waves
Flavio Javier Jarabeck
2.83 (18)
The original author is David Weis, an expert in the Wyckoff Method. The Weis Wave is a modern adaptation of the 1930's Wyckoff Method, another expert in Tape Reading techniques and Chart Analysis. Weis Waves takes market volume and stacks it into waves according to price conditions giving the trader valuable insights about the market conditions. If you want to learn more about this subject you can find tons of videos in YouTube. Just look for "The Wickoff Method", "Weis Wave" and "Volume Spread
FREE
Bollinger RSI Momentum Reversal: Precision Signal Indicator Stop chasing every price spike. Most traders lose money because they enter on a Bollinger Band touch without waiting for momentum to shift. The Bollinger RSI Momentum Reversal indicator solves this by requiring a "Double-Lock" confirmation before ever printing a signal. ____________________________________________________________________________________________________________________________________________ How It Works This indicator
FREE
AliPivot Points is a Meta Trader 5 Indicator that draws you the latest pivot points. You can choose from timeframes ranging from 1 Minute to 1 Month. Calculation methods for pivot points includes: Classic Pivot Points Camarilla Pivot Points Fibonacci Pivot Points Woodie Pivot Points You can personalize the line colors, style, and width to suit your preference. The indicator displays values on the right side of the chart. AliPivot Points values can also be utilized by developers for creating Expe
FREE
VWAP Indicator
LUC JACOBUS A VERHEECKE
4.11 (27)
Volume Weighted Average Price (VWAP) The volume weighted average price (VWAP) is a  trading   benchmark  used by traders that gives the average price a security has traded at throughout the day, based on both volume and price. It is important because it provides traders with insight into both the trend and value of a security. This indicator VWAP V2 is free and is the manual version of the extended Easy VWAP indicator (30 Euro), where the date and time properties are automatically entered. With
FREE
Value Chart Candlesticks
Flavio Javier Jarabeck
4.57 (14)
The idea of a Value Chart indicator was presented in the very good book I read back in 2020 , " Dynamic Trading Indicators: Winning with Value Charts and Price Action Profile ", from the authors Mark Helweg and David Stendahl. The idea is simple and the result is pure genius: Present candlestick Price analysis in a detrended way! HOW TO READ THIS INDICATOR Look for Overbought and Oversold levels. Of course, you will need to test the settings a lot to find the "correct" one for your approach. It
FREE
Order Book, known also as Market Book, market depth, Level 2, - is a dynamically updated table with current volumes of orders to buy and to sell specific financial instument at price levels near Bid and Ask. MetaTrader 5 provides the means for receiving market book from your broker, but in real time only, without access to its history. The indicator OrderBook Cumulative Indicator accumulates market book data online and visualizes them on the chart. In addition, the indicator can show the market
An extended version of the indicator for visualizing the time ranges of key trading sessions: Asian, European and American. The main advantage of this indicator is the automatic construction of a price profile for a trading session. The indicator has the functionality to set the start and end time of each trading session, as well as automatically determine the time zone of the trading server. The indicators include the ability to work with minimal CPU usage and save RAM. In addition, the option
FREE
Statistical Arbitrage Spread Generator for Cointegration [MT5] What is Pair Trading? Pair trading is a market-neutral strategy that looks to exploit the relative price movement between two correlated assets — instead of betting on the direction of the market. The idea? When two assets that usually move together diverge beyond a statistically significant threshold, one is likely mispriced. You sell the expensive one, buy the cheap one , and profit when they converge again. It’s a statistica
FREE
フェニックス移動平均メーター (MT5) MetaTrader 5向けプロフェッショナルな移動平均トレンド分析・可視化ツール。インテリジェントな傾き分析、雲幅測定、相場状態分類を洗練されたリアルタイムダッシュボードに統合。 概要 フェニックス移動平均メーターは、速い移動平均と遅い移動平均の関係を分析し、トレンドの方向性、強さ、成熟度を判定します。本指標は移動平均の傾き角度、雲幅の拡大・縮小、クロスオーバー発生からの経過時間を継続的に監視し、現在の市場レジームをリアルタイムで分類します。 システムは二つの馬蹄形メーター表示を採用。傾き位置メーターは短期移動平均の角度を「下降→横ばい→上昇」まで可視化し、雲幅メーターはトレンドの圧縮・拡大を過去平均値と比較して測定します。両メーターが連動することで、勢いの質とトレンド持続性に関する即時的な洞察を提供します。 トレンド状態は強気・弱気双方において「弱」「中」「強」「延長」に自動分類されます。雲のカラーリングはトレンド状態に直接連動し、チャートとダッシュボード間の視覚的整合性を確保。ノイズを低減し、生指標値ではなく実用的なトレンド状態
FREE
Waves Sizer
Flavio Javier Jarabeck
3.86 (7)
Wyckoff fans, enjoy! Ideally to be used with the Weis Waves indicator, but it can be easily used alone, the Waves Sizer puts the range (in resulting Price movement) done by the Price on its market swings. You can control how accurate or loose will be the swings. This tool is very helpful for visually know how much the Price has traveled in your Timeframe. This way you can confront this level of effort with the resulting Volume, etc... Weis Waves indicator: https://www.mql5.com/en/market/produc
FREE
Simple Vwap with the daily, weekly and monthly VWAP is the abbreviation for   volume-weighted average price , which is a technical analysis tool that shows the ratio of an asset's price to its total trade volume. It provides traders and investors with a measure of the average price at which a stock is traded over a given period of time. How it's used Identify entry and exit points:   Traders can use VWAP to determine when to buy or sell an asset.   Understand price trends :  Traders can use V
FREE
Dual RSI
Paul Conrad Carlson
3.5 (2)
Indicator alerts for Dual Relative strength index rsi. Large rsi preset at 14 is below 30 small rsi preset at 4 is below 10 for buy bullish signals . Large rsi preset are 14 is above 70 small rsi preset at 4 is above 90 for sell bearish signals . Includes mobile and terminal alerts. draws lines when alerts. This indicator can help identify extremes and then the tops or bottoms of those extremes .
FREE
Phoenix Delta Volume
Nigel Nii Darku Narnor Darko
This is the Phoenix Institutional SMC Dashboard (Emerald-Teal Edition). It is engineered to provide retail traders with the same "Volume-at-Price" clarity used by institutional desks. Below is a full breakdown of the benefits, the high-confluence logic for entries, and how to manage your trades using the current visual engine. Strategic Benefits to the User Sentiment over Price: Most indicators only look at where the price is. This dashboard tells you how much effort (Volume Delta) was required
FREE
Read This : Please provide comments and reviews for future improvements. WaveTrendPro_Indi v1.05 WaveTrend indicator with enhanced histogram visualization : Histogram is now scaled higher (adjustable via  HistScale ). Different colors for positive & negative bars, making trend direction clearer. Lightweight & responsive across pairs and timeframes. Perfect for scalpers, swing traders, and trend-following strategies. WaveTrendPro_Indi v1.05 Indikator WaveTrend dengan tampilan histogram yang le
FREE
概要 Fair Gap Value インジケーターは、MetaTrader 5 のチャート上で「フェアバリューギャップ」(公平価値ギャップ)を検出・強調表示します。フェアバリューギャップとは、あるローソク足の安値と、1本隔てた別のローソク足の高値の間に価格の空白が生じる現象を指します。本インジケーターは、これらの領域を多の矩形で表示し、プライスアクション戦略の視覚的サポートを提供します。 主な機能 ブルギャップ検出 :現在のローソク足の安値と2本前のローソク足の高値の間のギャップを緑色の矩形で強調。 ベアギャップ検出 :逆方向のギャップを赤色の矩形で強調。 動的拡張 :矩形をチャート右方向へ任意のバー数だけ延長可能。 透明度制御 :矩形の不透明度を設定し、下部のチャートを隠さないよう調整。 表示切替 :ブルギャップ/ベアギャップを個別にオン・オフ可能。 履歴制限 :スキャンする最大バー数を設定でき、大量データ時のパフォーマンスを最適化。 自動クリア :タイムフレーム変更時や初回ロード時に既存ギャップを一旦削除し再描画。 入力パラメーター LookbackBars :ギャップ計算に遡る
FREE
このプロダクトを購入した人は以下も購入しています
ARIPoint
Temirlan Kdyrkhan
1 (1)
ARIPoint is a powerful trading companion designed to generate high-probability entry signals with dynamic TP/SL/DP levels based on volatility. Built-in performance tracking shows win/loss stats, PP1/PP2 hits, and success rates all updated live. Key Features: Buy/Sell signals with adaptive volatility bands Real-time TP/SL/DP levels based on ATR Built-in MA Filter with optional ATR/StdDev volatility Performance stats panel (Success, Profit/Loss, PP1/PP2) Alerts via popup, sound, push, or email Cu
SuperScalp Pro
Van Minh Nguyen
4.63 (24)
SuperScalp Pro – 高度なマルチフィルタースキャルピングインジケーターシステム SuperScalp Pro は、クラシックな Supertrend と複数のインテリジェント確認フィルターを組み合わせた高度なスキャルピングインジケーターです。M1 から H4 まで複数の時間足で効率的に動作し、XAUUSD、BTCUSD、主要 Forex 通貨ペア向けに最適化されています。 このインジケーターは明確な Buy / Sell シグナルを提供し、ATR に基づいてエントリー価格、Stop Loss、Take Profit を自動計算します。Fibonacci Take Profit 機能により、重要な価格帯で早期決済し、到達時に通知を送信します。 初期設定では Fibonacci Take Profit が有効化されており、より安定した取引体験を重視しています。チャートに適用するだけですぐ利用可能です。上級者向けに、すべてのパラメータは自由にカスタマイズできます。 EMA、RSI、ADX、Volume、VWAP、Bollinger Bands、MACD Divergence な
このインジケーターを購入された方には、以下の特典を 無料 で提供しています: 各トレードを自動で管理し、ストップロスとテイクプロフィットを設定し、戦略ルールに基づいてポジションを決済する補助ツール 「Bomber Utility」 様々な銘柄に合わせたインジケーターの設定ファイル(セットファイル) 「最小リスク」、「バランスリスク」、「待機戦略」 の3つのモードで使用できる Bomber Utility 用の設定ファイル このトレーディング戦略をすぐに導入・設定・開始できる ステップバイステップのビデオマニュアル ご注意: 上記の特典を受け取るには、MQL5のプライベートメッセージシステムを通じて販売者にご連絡ください。 オリジナルのカスタムインジケーター 「Divergence Bomber(ダイバージェンス・ボンバー)」 をご紹介します。これは、MACDのダイバージェンス(乖離)戦略に基づいた 「オールインワン」型のトレーディングシステム です。 このテクニカルインジケーターの主な目的は、価格とMACDインジケーターの間に発生するダイバージェンスを検出 し、将来の価格の動きを示す
Entry In The Zone and SMC Multi Timeframe is a real-time 2-in-1 market analysis tool that combines market structure analysis and a No Repaint BUY / SELL signal system into a single indicator, built on Smart Money Concepts (SMC) — a widely adopted framework used by professional traders to understand market structure. This indicator helps you see the market more clearly, make decisions based on structure rather than guesswork, and focus on high-probability zones where price is more likely to react
Gold Entry Sniper – ゴールドスキャルピング&スイングトレード用プロフェッショナル多時間足ATRダッシュボード Gold Entry Sniper は、XAUUSDや他の銘柄向けに正確な 売買シグナル を提供する、MetaTrader 5用の高度なインジケーターです。 ATRトレーリングストップロジック と 多時間足分析ダッシュボード を搭載し、スキャルピングからスイングトレードまで対応します。 主な特徴と利点 多時間足シグナル分析 – M1、M5、M15 のトレンドを同時表示。 ATRベースのトレーリングストップ – ボラティリティに応じて動的に調整。 プロ仕様のチャートダッシュボード – シグナル状況、ATRレベル、回帰線、売買方向を表示。 明確な売買マーカー – 自動矢印とテキストラベル。 エグジットアラートとトレード管理 – 利益確定のための自動検出。 完全カスタマイズ可能 – パネル位置、色、フォント、ATR/回帰設定を調整可能。 ゴールド(XAUUSD)に最適化 – M1〜M15のスキャルピングに最適、FXや指数、暗号資産にも対応。 Gold Entry
Power Candles V3 - 自己最適化型強弱インジケーター Power Candles V3は 、通貨や銘柄の強さを、適用されたすべてのチャート上で実行可能なトレードプランに変換します。単にローソク足を色分けするだけでなく、バックグラウンドでリアルタイムの自動最適化を実行し、目の前の銘柄に対して最適なストップロス、テイクプロフィット、およびシグナルの閾値を提示します。ワンクリックで実取引に適用でき、エントリーポイント、ストップロス、テイクプロフィットのラインが正確な価格位置にチャート上に表示され、方向性を示すアラートがリアルタイムで発動します。 このツールは、Stein Investmentsのエコシステムの一部です。  18種類以上のツールをすべて閲覧し、AIを活用したセットアップの推奨事項を入手し、  https://stein.investments でコミュニティに参加しましょう クローズしたバーごとに3,000回以上のトレードシミュレーション。9つの強さの状態。2つの戦略を並行してテスト。勝率の高い設定をワンクリックで適用。 なぜこれが必要なのか ほとんどの強
SignalTech MT5 is a fully rule based trading system for EURUSD, USDCHF, USDJPY, AUDUSD, NZDUSD, EURJPY, AUDJPY, NZDJPY, CADJPY.  All the winning trades with chart setups are published on the comments page. 2025-12 1174 Pips 2026-01 2624 Pips 2026-02 2937 Pips 2026-03 2165 Pips 2026-04 2243 Pips It can generate signals with Buy/Sell Arrows and Pop-Up/Sound Alerts. Each signal has clear Entry and Stop Loss levels, which should be automatically flagged on the chart, as well as potential Targets 1,
このインジケーターを購入すると、プロ仕様のトレードマネージャーを無料で差し上げます。 まず第一に、このトレーディングシステムがノンリペイント、ノンリドロー、ノンラグのインジケーターであることを強調する価値がある。これにより、手動取引とロボット取引の両方に理想的なものになっています。 オンラインコース、マニュアル、プリセットのダウンロード。 「スマートトレンドトレーディングシステム MT5」は、新規および経験豊富なトレーダー向けにカスタマイズされた包括的なトレーディングソリューションです。10以上のプレミアムインジケーターを組み合わせ、7つ以上の堅実なトレーディング戦略を備えており、多様な市場状況に対応する多目的な選択肢となっています。 トレンドフォロー戦略:トレンドを効果的に乗り越えるための正確なエントリーとストップロス管理を提供します。 リバーサル戦略:潜在的なトレンドの反転を特定し、トレーダーがレンジ相場を活用できるようにします。 スキャルピング戦略:高速で正確なデイトレードおよび短期取引のために設計されています。 安定性:すべてのインジケーターはノンリペイント、ノンリドロー、ノ
RelicusRoad Pro: 定量的市場オペレーティングシステム 【期間限定】無制限アクセス 70% OFF - 2,000人超のトレーダーと共に なぜ多くのトレーダーは「完璧な」インジケーターを使っても失敗するのでしょうか? それは、文脈を無視して 単一の概念 だけでトレードしているからです。文脈のないシグナルは単なるギャンブルです。勝ち続けるには、 根拠の重なり(コンフルエンス) が必要です。 RelicusRoad Proは単なる矢印インジケーターではありません。完全な 定量的市場エコシステム です。独自のボラティリティモデリングを用いて、価格が推移する「適正価値の道(Fair Value Road)」をマッピングし、ノイズと真の構造的ブレイクを判別します。 推測はやめましょう。機関投資家レベルの「ロード・ロジック」でトレードを。 コアエンジン:「Road」アルゴリズム システムの中心となる Road Algo は、市場環境にリアルタイムで適応するダイナミックなボラティリティチャネルです。 安全ライン(平衡点) と、価格が数学的に反転しやすい 拡張レベル を投影します。 Si
MetaTrader 5 向けスマート多層ブレイクアウト&プルバック検出器 「スマート・シンプル・ファスト!」 高確率のブレイクアウトエントリーを見逃すことにうんざりしていませんか? 複数のチャートを何時間もスキャンし、ブレイクアウトをトレンド方向と通貨のモメンタムに合わせようとして、それでも動きを逃してしまうことはありませんか? Break Pullback は、1つのインジケーターでそのすべてを解決します。 Break Pullback とは何ですか? Break Pullback は、マーケットストラクチャー、ブレイクアウト、トレンド継続のセットアップを取引するトレーダー向けに特別に設計されたプロフェッショナルグレードの MetaTrader 5 インジケーターです。 リアルタイムで複数の通貨ペアにわたるブレイクとプルバックの形成を自動的に検出し、3層の確認を通じてすべてのシグナルをフィルタリングします: ストラクチャラルブレイクアウト検出 — チャート上の主要なブレイクレベルを特定 HTF 日足バイアス — エントリーを支配的な日足トレンド方向に合わせる 通貨強弱指数 —
Gann Made Easy   は、ミスター・ギャンの理論を使用した取引の最良の原則に基づいた、プロフェッショナルで使いやすい外国為替取引システムです。 W・D・ガン。このインジケーターは、ストップロスとテイクプロフィットレベルを含む正確な買いと売りのシグナルを提供します。 PUSH通知を利用して外出先でも取引可能です。 ご購入後、取引方法の説明と優れた追加インジケーターを無料で入手するには、私にご連絡ください! おそらく、ギャンの取引手法についてはすでに何度も聞いたことがあるでしょう。通常、ギャンの理論は初心者のトレーダーだけでなく、すでにある程度の取引経験がある人にとっても非常に複雑なものです。なぜなら、ギャンの取引手法は理論的にはそれほど簡単に適用できるものではないからです。私はその知識を磨き、最良の原則を私の外国為替インジケーターに組み込むために数年を費やしました。 このインジケーターは非常に簡単に適用できます。必要なのは、それをチャートに添付し、簡単な取引推奨事項に従うだけです。このインジケーターは常に市場分析の仕事を行い、取引の機会を探します。適切なエントリーポイントを検
ご紹介     Quantum Breakout PRO は 、ブレイクアウト ゾーンの取引方法を変革する画期的な MQL5 インジケーターです。 13年以上の取引経験を持つ経験豊富なトレーダーのチームによって開発されました。     クォンタム ブレイクアウト プロ   は、革新的でダイナミックなブレイクアウト ゾーン戦略により、あなたのトレーディングの旅を新たな高みに押し上げるように設計されています。 クォンタム ブレイクアウト インジケーターは、5 つの利益ターゲット ゾーンを備えたブレイクアウト ゾーン上のシグナル矢印と、ブレイクアウト ボックスに基づいたストップロスの提案を提供します。 初心者トレーダーにもプロのトレーダーにも適しています。 量子EAチャネル:       ここをクリック 重要!購入後、インストールマニュアルを受け取るためにプライベートメッセージを送ってください。 推奨事項: 時間枠: M15 通貨ペア: GBPJPY、EURJPY、USDJPY、NZDUSD、XAUUSD アカウントの種類: ECN、Raw、またはスプレッドが非常に低い R
Azimuth Pro
Ottaviano De Cicco
5 (7)
Azimuth Pro V2:MT5向けシンセティック・フラクタル構造分析と確認済みエントリー 概要 Azimuth Pro は Merkava Labs によるマルチレベルスイング構造インジケーターです。4つのネストされたスイングレイヤー、スイングアンカーVWAP、ABCパターン検出、3タイムフレーム構造フィルタリング、そして確定バーでの確認済みエントリー — 1つのチャートで、ミクロスイングからマクロサイクルまでを網羅するワークフロー。 これはブラインドシグナル製品ではありません。ロケーション、コンテキスト、タイミングを重視するトレーダーのための構造ファーストワークフローです。 V2発売記念オファー — Azimuth Pro V2をUSD 399で(次の100本)。最終価格:USD 499。 1. V2での変更点 シンセティック・マルチタイムフレームエンジン 上位タイムフレーム分析をMeridian Proと同じ独自のシンセティックアーキテクチャで一から再構築。よりクリーンなHTFコンテキスト、安定したライブ動作、従来のMTF同期問題なし。シンセティックエンジンは 固定比率タ
まず第一に、この取引ツールはノンリペイント、ノンリドロー、ノンラグの指標であり、プロの取引に理想的ですことを強調する価値があります。 オンラインコース、ユーザーマニュアル、デモ。 スマートプライスアクションコンセプトインジケーターは、新米から経験豊富なトレーダーまで、非常 に強力なツールです。Inner Circle Trader AnalysisやSmart Money Concepts Trading Strategiesなど、20以上の有用な指標を1つに組み合わせています。このインジケーターはスマートマネーコンセプトに焦点を当て、大手機関の取引方法を提供し、彼らの動きを予測するのに役立ちます。 特に、流動性分析に優れており、機関がどのように取引しているかを理解しやすくしています。市場のトレンドを予測し、価格の動きを慎重に分析するのに優れています。機関の戦略とトレードを合わせることで、市場の動向についてより正確な予測ができます。このインジケーターは多目的であり、市場構造を分析し、重要な注文ブロックを特定し、さまざまなパターンを認識するのに優れています。 このインジケーター
まず正直に言いましょう。 どんなインジケーターも、それ単体であなたを利益化させることはできません。もしそう言う人がいるなら、それは夢を売っているだけです。完璧な売買シグナル(矢印)を表示するインジケーターは、いくらでも“完璧に見せる”ことができます。正しい過去の区間を拡大して、勝ちトレードだけを切り取ればいいだけです。私たちはそれをしません。 SMC Intraday Formula はツールです。 市場構造を読み取り、最も高い確率の価格ゾーンを特定し、今この瞬間のスマートマネーの痕跡をシンプルな言葉で正確に示します。最終判断はあなたが行います。トレードを実行するのもあなたです。しかし今は「希望」ではなく「精度」でエントリーできます。 私たちはこのインジケーターを、ゴールド(XAUUSD)および主要FX通貨ペアで約3年間、日々のスキャルピングに使用してきました。M1、M5、M15、M30の主要ツールです。これは未来を予測しようとするのではなく、今まさに形成されている高確率セットアップを示し、その理由を説明します。 他のすべてのインジケーターと何が違うのか? ほとんどのトレーディングイ
Quantum TrendPulse を ご紹介します。これは、   SuperTrend   、   RSI   、および Stochastic のパワーを 1 つの包括的なインジケーターに組み合わせて、取引の可能性を最大限に引き出す究極の取引ツールです。精度と効率を求めるトレーダー向けに設計されたこのインジケーターは、市場のトレンド、勢いの変化、最適なエントリー ポイントとエグジット ポイントを自信を持って特定するのに役立ちます。 主な特徴: SuperTrend 統合: 現在の市場動向に簡単に追従し、収益性の波に乗ることができます。 RSI精度: 買われすぎと売られすぎのレベルを検出し、市場の反転のタイミングに最適で、SuperTrendのフィルターとして使用されます。 確率的精度: 確率的振動を活用して、変動の激しい市場で隠れたチャンスを見つけます。SuperTrend のフィルターとして使用されます。 マルチタイムフレーム分析:   M5 から H1 または H4 まで、さまざまなタイムフレームで市場を常に把握します。 カスタマイズ可能なアラート: カスタム取引条件が満たされ
FX Trend NG:次世代マルチマーケット・トレンドインテリジェンス 概要 FX Trend NG は、複数の時間足に対応したプロフェッショナル向けトレンド分析およびマーケット監視ツールです。 市場全体の構造を数秒で把握することができます。 複数のチャートを切り替える必要はありません。どの銘柄がトレンド中なのか、どこでモメンタムが弱まっているのか、そしてどの時間足で強い整合性があるのかを瞬時に確認できます。 ローンチ特別オファー – FX Trend NG を $30(6ヶ月) または $80 永久ライセンス でご利用いただけます。 すでに Stein Investments のユーザーですか? -> メッセージを送信 して、プライベートグループへアクセスしてください。 セットアップや詳細情報が必要ですか? -> Stein Investments 公式ページ をご覧ください。 1. FX Trend NG が他と異なる理由 3ステート・トレンドロジック ― Buy と Sell だけではない • 多くのインジケーターは Buy または Sell の2状態のみを表示します。
まず第一に、この取引インジケーターは再描画されず、再描画されず、遅延しないことを強調する価値があります。これにより、手動取引とロボット取引の両方に理想的なものになります。 ユーザーマニュアル:設定、入力、戦略。 アトミックアナリストは、価格の強さとモメンタムを利用して市場でより良いエッジを見つけるためのPA価格アクションインジケーターです。ノイズや誤ったシグナルを除去し、取引ポテンシャルを高めるための高度なフィルターを備えています。複雑なインジケーターの複数のレイヤーを使用して、アトミックアナリストはチャートをスキャンし、複雑な数学的計算をシンプルなシグナルと色に変換します。これにより、どのような初心者トレーダーでも理解して使用し、一貫した取引の決定を行うことができます。 「アトミックアナリスト」は、新規および経験豊富なトレーダー向けにカスタマイズされた包括的な取引ソリューションです。プレミアムインジケーターとトップノッチの機能を1つの取引戦略に組み合わせ、すべてのタイプのトレーダーにとって汎用性のある選択肢にします。 デイリートレーディングとスキャルピング戦略:高速で正確なデイ
Meridian Pro
Ottaviano De Cicco
5 (2)
Meridian Pro 2.00:MT5向けプロ仕様マルチタイムフレーム・トレンドマトリクス Meridian Pro 2.00 は、MetaTrader 5 向けのプロ仕様の適応型トレンドマトリクスです。オリジナルの Meridian トレンドエンジン、クリーンなチャート ribbon、確定足ベースのシグナル矢印、8時間足 dashboard、Fuel momentum、weighted consensus、synthetic HTF processing、そしてチャート上に直接表示される上位足コンテキストラインを統合します。 目的はシンプルです。現在のトレンド、マルチタイムフレーム構造、強度、momentum、EA-ready 状態を、複数チャートに無関係なインジケータを重ねるのではなく、1つの整理された workflow で読むことです。 Meridian Pro の違い 1つの適応型エンジン - 同じ volatility-aware Meridian ロジックを M1 から W1 まで適用します。 Synthetic HTF architecture - 上位足行は下位足デ
BTMM State Engine Pro is a MetaTrader 5 indicator for traders who use the Beat The Market Maker approach: Asian session context, kill zone timing, level progression, peak formation detection, and a multi-pair scanner from a single chart. It combines cycle state logic with a built-in scanner dashboard so you do not need the same tool on many charts at once. What it does Draws the Asian session range; session times can follow broker server offset or be set in inputs. Tracks level progression (L
Market Structure Order Block Dashboard MT5 は、市場構造と主要な価格反応ゾーンをチャート上で直接読み取りたいトレーダー向けに設計された MT5 インジケーターです。BOS、ChoCH、オーダーブロック、Fair Value Gap (FVG)、流動性、Kill Zones、Volume Profile、そして素早い分析のためのコンパクトなダッシュボードを組み合わせています。 本インジケーターは、市場構造、ICT、Smart Money の概念を意思決定の枠組みとして使用するトレーダーを対象としています。トレンド継続、反転の可能性、価格の不均衡、流動性ターゲット、注目ゾーンをより構造的に特定する助けとなります。 購入者向けの付属リソース 購入後、MQL5 のプライベートメッセージにてご依頼いただくと、完全な PDF ユーザーガイドとパラメータ設定のヒントを提供いたします。MQL5 のプライベートメッセージによる直接的な技術サポート。 バージョン 1.20 では 2 つの重要な追加機能があります: Pending BOS / Pending Cho
多くの矢印インジケーターは、シグナルだけを表示して、その後の判断をすべてトレーダーに任せてしまいます。KT Alpha Hunter Arrows は、完整なトレードプランをチャート上に提示します。 各シグナル矢印が表示されるたびに、エントリーライン、ストップロス、4つのテイクプロフィット水準、そして現在の銘柄と時間足が今トレードに値するかどうかを示すリアルタイムのエッジ判定が、すでに描画された状態で表示されます。付属の Trade Manager EA は、あなたが手動でエントリーした後の実行管理を担当し、相場が荒れて判断がぶれやすい場面でも規律あるトレードを保ちやすくします。リペイントなし。確定足シグナルのみ。Forex、ゴールド、指数、その他あなたが取引するあらゆる銘柄に対応します。 主な機能 リペイントしない買い矢印と売り矢印を、足の確定後にのみ表示。 各シグナルに、エントリーライン、構造的ストップロス、4つのテイクプロフィット水準を表示。 Edge Dashboard が、現在のチャートで買いセットアップと売りセットアップを別々に評価。 判定システム:No Edge、Mar
このインジケーターは、反転ポイントと価格戻りゾーンを正確に表示します。     主要プレーヤー 。新たなトレンドが形成される場所を把握し、最大限の精度で意思決定を行い、すべての取引をコントロールします。 TREND LINES PRO インジケーターと組み合わせることで、その潜在能力を最大限に発揮します。 VERSION MT4 インジケーターが示す内容: 新しいトレンドの始まりに活性化する反転構造と反転レベル。 リスクと報酬の比率を最小限に抑えた利益 確定 と 損失停止の レベルの表示     RR 1:2   。 インテリジェントな削減ロジックによるストップロス。 指定されたインジケーターから 2 つのトレンド タイプの反転パターンを表示します。 指標: トレンドを追う   TREND LINES PRO   (世界的なトレンドの変化) TREND PRO   (クイックトレンド変更) シンプルで効果的   スキャナー   リアルタイムトレンド(新機能)。 マルチタイムフレームのインストゥルメント フィルタリング。 画面   利益     LOGIC AI信号の後。 当日プラス方
優れたテクニカルインジケーター「Grabber」をご紹介します。これは、すぐに使える「オールインワン」トレーディング戦略として機能します。 ひとつのコードに、市場のテクニカル分析ツール、取引シグナル(矢印)、アラート機能、プッシュ通知が強力に統合されています。 このインジケーターを購入された方には、以下の特典を無料で提供します: Grabberユーティリティ:オープンポジションを自動で管理するツール ステップバイステップのビデオマニュアル:インジケーターのインストール、設定、取引方法を解説 カスタムセットファイル:インジケーターをすばやく自動設定し、最大限の成果を出すための設定ファイル 他の戦略はもう忘れてください!Grabberだけが、あなたを新たなトレードの高みへと導いてくれるのです。 Grabber戦略の主な特徴: 推奨タイムフレーム:M5〜H4 対応通貨ペア・資産:どれでも使用可能ですが、私が実際に検証した以下を推奨します(GBPUSD、GBPCAD、GBPCHF、AUDCAD、AUDUSD、AUDSGD、AUDCHF、NZDUSD、NZDCAD、EURCAD、EURUSD、E
これはMT5のインジケーターで、再描画なしで取引に参入するための正確なシグナルを提供します。 外国為替、暗号通貨、金属、株式、インデックスなど、あらゆる金融資産に適用できます。かなり正確な見積もりを提供し、取引を開始して終了するのに最適な時期を教えてくれます。1つのシグナルを処理しただけでインジケーターの元が取れた例の 動画 (6:22)をご覧ください。Entry PointsPro インジケーターの助けを借りたほとんどのトレーダーの最初の1週間の結果が改善しています。 Telegramグループ に登録してください。Entry Points Proインジケーターのメリットは次の通りです。 再描画のないエントリーシグナル 再描画されるインジケーターでは一度表示されたシグナルが削除されて大きな金銭的損失につながることがありますが、これと異なり、表示されて確認されたシグナルは消えることがありません。 エラーなしの取引開始 インジケーターアルゴリズムによって取引を開始する(資産を売買する)理想的な瞬間を見つけることができます。それを使用するすべてのトレーダーの成功率が向上します。 あら
このダッシュボードは、選択されたシンボルの最新の利用可能なハーモニックパターンを表示するので、時間を節約し、より効率的に /   MT4バージョン 。 無料インジケーター:   Basic Harmonic Pattern インジケーター列 Symbol : 選択したシンボルが表示されます。 Trend :   強気または弱気 Pattern : パターンの種類(ガートレー、バタフライ、バット、カニ、サメ、サイファー、ABCD) Entry : エントリー価格 SL: ストップロス価格 TP1: 1回目の利食い価格 TP2: 2回目の利食い価格 TP3:   3回目の利食い価格 Current price :   現在値 Age (in bars):    最後に描画されたパターンの年齢 主な入力項目 Symbols:   "28 Major Currency Pairs "または "Selected Symbols "から選択。 Selected Symbols:   カンマで区切られた監視したいシンボル("EURUSD,GBPUSD,XAUUSD")。ブローカーがペアに接
FX Power: 通貨の強弱を分析して、より賢い取引を実現 概要 FX Power は主要通貨と金の実際の強弱をあらゆる市場状況で理解するための必須ツールです。強い通貨を買い、弱い通貨を売ることで、 FX Power は取引の意思決定を簡素化し、高い確率の取引機会を見出します。トレンドを追従する場合でも、極端なデルタ値を使用して反転を予測する場合でも、このツールはあなたの取引スタイルに完全に適応します。ただ取引するだけではなく、 FX Power で賢く取引をしましょう。 1. なぜ FX Power がトレーダーにとって非常に有益なのか 通貨と金のリアルタイム強弱分析 • FX Power は主要通貨と金の相対的な強弱を計算し、マーケットダイナミクスに関する明確な洞察を提供します。 • どの資産がリードしているか、または後れを取っているかを監視して、取引するペアを賢く選びましょう。 マルチタイムフレームの包括的なビュー • 短期、中期、長期のタイムフレームで通貨と金の強弱を追跡し、マーケットトレンドに基づいて取引戦略を調整できます。 • スキャルピングからスイングトレード
トレンドラインプロ   市場の真の方向転換点を理解するのに役立ちます。この指標は、真のトレンド反転と主要プレーヤーが再び参入するポイントを示します。 分かりますか     BOSライン   複雑な設定や不要なノイズなしに、より長い時間足でのトレンドの変化と重要なレベルを把握できます。シグナルは再描画されず、バーが閉じた後もチャート上に残ります。 MT4バージョン   -   RFI LEVELS PRO インジケーター と組み合わせることで、その最大限の能力を発揮します インジケーターが示す内容: 本当の変化   トレンド(BOSライン) 一度シグナルが現れたら、それは有効です!これは、リペイント機能を持つインジケーターとの重要な違いです。リペイント機能を持つインジケーターは、シグナルを発した後、それを変更し、資金の損失につながる可能性があります。これにより、より高い確率と精度で市場に参入できます。また、矢印が現れた後、目標値(利益確定)に達するか、反転シグナルが現れるまで、ローソク足の色を変更する機能もあります。 繰り返しエントリ   主要プレーヤーの補充 エントリーポイントを探す
Super Signal Market Slayer 非リペイント|高精度|マルチマーケット対応インテリジェントトレンド指標 トレードにおいて本当に難しいのは、 注文することではなく、相場のノイズの中で「トレンドが始まった瞬間」を見極めることです。 Market Slayer はそのために開発されました。 本インジケーターは、日中取引向けに設計された非リペイント型のインテリジェント指標です。 多層確認とトレンドフィルターにより、重要な局面でのみ明確かつ信頼性の高い Buy / Sell シグナルを表示します。 主な特長 非リペイントシグナル 一度表示されたシグナルは固定され、消えたり移動したりしません。 高精度なトレンド判定 複数銘柄で検証され、特にゴールド M5 / M15 で安定した結果を示します。 マルチマーケット対応 ゴールド、FX、指数、主要暗号資産に対応。 日中取引向け最適化 M5・M15 に特化し、ノイズを抑え実行性を向上。 直感的で分かりやすい 初心者でも理解しやすく、すぐに使用可能。 技術ロジック概要 Market Slayer は単一条件の矢印ではありません。 以
OmniSync Projection
Antonio-alin Teculescu
5 (1)
Chronos Fractal Engine is an innovative price projection indicator for MetaTrader 5, designed to transform your technical analysis by intelligently identifying and projecting historical price patterns. Built upon an advanced correlation algorithm and the fractal principles of the market, this powerful tool visualizes potential future price movements, giving you a unique edge in your trading decisions. What is Chronos Fractal Engine? At its core, the Chronos Fractal Engine employs a sophisticat
作者のその他のプロダクト
Ritz Smart Detection BUY & SELL Visit premium products :  https://www.mql5.com/en/market/product/155962 This indicator will be very suitable to be paired with BUY and SELL Smart detection : https://www.mql5.com/en/market/product/170689 Visit, what can you get? :   https://www.mql5.com/en/users/ritzfalih/seller The Ritz Smart Detection BUY & SELL is a next-generation trading indicator engineered to detect high-probability entry signals by combining ATR-based volatility measurement , trend rever
FREE
Ritz Smart FIBOPIVOT Optimus Pro Advanced Multi-Timeframe Fibonacci Trading System SMART PREDICTION & ACCURATE FORECAST Revolutionary Fibonacci Pivot Technology combines traditional pivot points with advanced Fibonacci extensions, creating a powerful predictive tool for professional traders. Our algorithm intelligently detects significant price levels across multiple timeframes, delivering laser-accurate support and resistance zones before the market moves . INTELLIGENT VOLUME-VALIDATED SIGNALS
FREE
MOVING AVERAGE RIBBON Ritz MA Ribbon Dynamics – The Next-Gen Trend Visualizer Ritz MA Ribbon Dynamics is a futuristic multi-layer Moving Average system engineered to visualize trend momentum, volatility balance, and market rhythm in one adaptive ribbon. Designed for modern traders who demand clarity, flexibility, and automation — this tool transforms the classic MA visualization into a dynamic analytical framework. Core Concept The indicator creates a multi-tier MA Ribbon that adapts to the cho
FREE
BUY and SELL smart The BUY and SELL Smart Indicator is a next-generation trading tool engineered for precision scalpers, intraday strategists, and professional analysts who demand both speed and clarity in market visualization. It seamlessly integrates smart candle-based analytics, adaptive ATR logic, and real-time economic event awareness — giving you a fully synchronized view of market volatility and momentum. Through an elegant and optimized interface, FlashScalp delivers   instant signal fee
Smart Finder Order Block The Ritz Smart Finder Order Block is a next-generation market structure recognition tool, designed to intelligently detect and highlight institutional footprints within price action. Built on a dynamic blend of order block theory, consolidation tracking, and adaptive volatility modeling, it provides traders with a sophisticated lens to anticipate high-probability market reactions. Core Capabilities Smart Order Block Detection Identifies both Bullish and Bearish Order Blo
FREE
RITZ Candle Kaufman’s AMA is a precision market-flow indicator built around Kaufman’s Adaptive Moving Average (KAMA / AMA) — a dynamic smoothing algorithm that automatically adjusts to changing volatility. This enhanced version interprets AMA momentum directly into smart candle-color signals , giving traders a clean, noise-filtered view of trend strength and directional bias. Where most indicators repaint or react too slowly, RITZ Candle AMA delivers stable, non-repainting color shifts based on
FREE
ZIGZAG and FRACTAL CANDLE PRO ( Only candles, No RSI strength panel) " Suitable for QQE RITZ " > Check My Product is an advanced market structure visualization system built for precision trend detection, powered by dynamic fractal logic and adaptive swing validation. It seamlessly identifies Higher Highs (HH), Lower Lows (LL), and key structural shifts — allowing traders to read the true rhythm of market transitions with institutional clarity. This system combines   ZigZag precision ,   fractal
FREE
RITZ QUANTUM PULSE Next-Generation Economic Intelligence System Ritz Quantum Pulse — Next-Gen Economic Intelligence System. Experience quantum-level precision in news trading: real-time event detection, AI-powered filtering, and temporal synchronization. Anticipate volatility before it happens — not after. Where Market Intelligence meets Temporal Physics. Ritz Quantum Pulse   represents the convergence of   quantum logic ,   AI-driven analytics , and   real-time economic intelligence . This is
FREE
Pivot eXtreme Pivot adalah level referensi penting yang digunakan trader untuk memetakan potensi support & resistance intraday maupun jangka lebih panjang. Dalam sistem ini, level pivot dikembangkan menjadi P (Pivot Point utama) , R1–R13 (Resistance) , serta S1–S13 (Support) . Pivot Point (P) Titik pusat utama, dihitung dari rata-rata harga (High + Low + Close) / 3 . Berfungsi sebagai acuan keseimbangan harga : Jika harga di atas P → tren cenderung bullish. Jika harga di bawah P → tren cenderung
FREE
Conspiracy 16
Syamsurizal Dimjati
3 (1)
Ritz Conspiracy 16  – 多層型マーケット・インテリジェンス・システム Ritz Conspiracy 16 は、16種類の主要テクニカル指標を 1つの統合ビジュアルパネルにまとめた 多層型マーケット分析インジケーター です。 マーケット・インテリジェンスの概念に基づいて設計され、 トレンド、ボラティリティ、モメンタム、出来高、価格構造など、 あらゆる角度から市場の挙動を司令室のように読み取ります。 “コンスピラシー(共謀)” 的アプローチにより、 16のアルゴリズムが生み出す小さな手がかりをつなぎ合わせ、 市場が本当に向かおうとしている力学を一つの大きな絵として描き出します。 最終的に、各テクニカルカテゴリに対する BUY/SELL の確率パーセンテージ を リアルタイムで、かつ適応的に、非常に情報量豊かに表示します。 Ritz Conspiracy 16 の内部構造 1つのインジケーター、6つの主要カテゴリ、16の分析エンジン。 1. TREND インテリジェンス クラシック指標と適応型指標を組み合わせ、 トレンドの方向性と強さを捉える層。 Moving Aver
FREE
Ritz Smart Trend Adaptive Finder – Auto-Detect Dynamic Trend Channels A powerful trend detection indicator that adaptively analyzes price structure using dynamic ATR and statistical filters to discover the most significant trend channels on any timeframe and symbol. This tool automatically finds the most relevant period and slope for price movement and draws upper/lower channel zones, midline (mean), and trend support/resistance. Suitable for trend-following, breakout, and mean-reversion strateg
FREE
RITZ SMART TREND ADAPTIVE FINDER Precision Trend Intelligence. Adaptive. Insightful. Real-Time. Ritz Smart Trend Adaptive Finder is an advanced market intelligence indicator engineered to detect and adapt to evolving market structures with dynamic precision. It automatically calibrates its analytical period based on real-time volatility, price momentum, and correlation strength — delivering true adaptive trend detection rather than static or lagging signals. By combining Pearson correlation , sl
FREE
Push Notif for Mobile Trading (Now you can trade perfectly through notifications to your Mobile Gadget, with Signals that you can adjust to your trading style, Use VPS to activate real time trading) Description Push Notif for Mobile Trading is a custom MetaTrader 5 (MT5) indicator designed to send mobile push notifications to traders when certain price or indicator-based conditions are met. This allows traders to monitor markets remotely and act quickly, even when not at their trading terminal.
FREE
Ritz_BUYnSELL_Detection The Ritz_BUYnSELL_Detection is a custom MetaTrader 5 (MT5) indicator that detects BUY and SELL trading signals based on trend detection and ATR-based volatility filtering. It provides visual arrows , entry alerts , and mobile push notifications , making it suitable for traders using a VPS setup for 24/7 signal monitoring. How to Use the Indicator Install on MT5 : Place the .mq5 file in the MQL5/Indicators folder. Compile it in MetaEditor, then apply it to any chart. A
FREE
indikator Visual Panel Strengt MultiTimeframe : English Description Visual Panel Strength MultiTimeframe is a real-time trend strength indicator panel that displays the buy/sell pressure across multiple selected timeframes—such as M1, M3, and M5. The indicator utilizes ATR-based volatility analysis and a smoothed trend algorithm to calculate trend signals. Visually presented as a horizontal bar chart at the corner of your main chart, this tool helps traders instantly identify the prevailing
Moving Average Sentiment "Transform Raw Market Data into Clear Sentiment Vision" Moving Average Sentiment is a next-generation adaptive trend sentiment indicator that visualizes the true bias of the market — bullish, bearish, or neutral — in real time. It combines Moving Average dynamics with ATR-based volatility zones , creating a fluid, self-adjusting sentiment curve that reacts instantly to price structure and volatility shifts. This tool goes beyond a simple MA — it reads the behavior of th
FREE
SCALPFLASH-X Where Fibonacci Precision Meets RSI Intelligence. Next-gen trading system combining Adaptive Fibonacci Pivots, RSI Heat Mapping, and Smart Candle Analytics. Detect market dominance, momentum shifts, and reversal zones in real time across multiple timeframes. Institutional accuracy, retail simplicity — built for speed, clarity, and precision. Advanced Multi-Timeframe Fibonacci & RSI-Driven Market Intelligence System ScalpFlash-X — A next-generation trading system combining Fibonacc
Detect Trend and Consolidation :  Push Notif for Mobile Trading  Overview Push Notif for Mobile Trading: Detect Trend and Consolidation is a custom MetaTrader 5 (MT5) indicator developed by Ritz_EANEHA that intelligently detects whether the market is in a trend (bullish/bearish) or in consolidation (sideways) . It uses a proprietary comparison of Standard Deviation (StdDev) and Average True Range (ATR) to assess volatility and market structure, and sends mobile push notifications to alert trade
FREE
Candle MAXIMUS RITZ Candle MAXIMUS adalah indikator visual cerdas yang menggabungkan kekuatan analisis tren berbasis Kaufman Adaptive Moving Average (KAMA) , informasi perubahan harian (Daily Change), perbandingan OHLC terhadap hari sebelumnya, serta panel dominasi bar multi-hari. Dirancang untuk semua pair dan semua timeframe, indikator ini menghadirkan tampilan modern, bersih, serta informatif dalam satu panel kompak di chart Anda. Fitur Utama Trend Candle Warna Adaptif (Color Candles) Warna
FREE
Manual Trade Helper is an MT5 Expert Advisor designed as an automated assistant for managing manually opened trades. This EA does not open trades on its own, but instead enhances manual trading by automatically managing risk and position settings. Remote Management via VPS + Mobile Devices When deployed on a Virtual Private Server (VPS), the RitzEAneha Manual Trade Helper allows traders to seamlessly manage their trades from anywhere using just a smartphone or tablet. Since the EA runs 24/7 on t
FREE
MultiTimeframe Info Feed (MIF) Indicator Description: MultiTimeframe Info Feed (MIF) is a smart MQL5 indicator that displays a dynamic, real-time info panel directly on your chart, offering powerful insight into current market conditions. Key features include: Real-time display of Open, High, Low, Close, and live Tick price Tick Rate (ticks per second) for assessing market activity Auto-calculated Entry Price on new candle formation Signal direction detection (BUY / SELL) Price action pattern re
FREE
READ THIS !! to the end Expert Advisor Description:   XAUUSD Reversal Pattern EA (EAneha GoodWill) Important Note: No martingale, averaging or grid Highly dependent on execution quality & low spreads XAUUSD Reversal Pattern EA  is an advanced automated trading robot developed specifically for trading  XAUUSD  (Gold vs USD) on the  M30 timeframe . It uses a robust combination of  candlestick patterns ,  volatility/volume indicators , and  oscillator filters  to identify high-probability reversal
RUHM Reborn
Syamsurizal Dimjati
RUHM REBORN for Micro Account / Cent Account XAUUSD - GOLD (Note: The grid-based system carries high risk during long trends without retrace. Use appropriate capital and understand the risks involved.) RUHM REBORN is a Grid-based Expert Advisor (EA) with ATR Entry developed to provide consistent, stable, and adaptive trading results on the XAUUSD (Gold) pair. This EA is specifically designed for USD Cent accounts, allowing it to run with relatively affordable capital while maintaining stability
Support & Resistance Zone Indicator This indicator dynamically identifies and draws support and resistance zones based on recent price action and fractal patterns. By analyzing ZigZag pivot points and tracking price reactions (touches, bounces, and breaks), the indicator determines the strength and validity of each zone. Key Features: Multi-Timeframe Support: Can work across different timeframes. Fractal-Based Detection: Utilizes both fast and slow fractal detection to find significant swing po
Smart Swing HH - LL Indikator ini dirancang untuk mendeteksi Swing High (HH) dan Swing Low (LL) secara cepat dan akurat pada grafik harga. Deteksi dilakukan berdasarkan analisa range ATR adaptif, konfirmasi pola candlestick (seperti pin bar dan engulfing), serta opsi tambahan menggunakan Fractal untuk validasi. Fitur utama: Deteksi otomatis titik Swing High dan Swing Low menggunakan ATR dan price action. Penyesuaian sensitivitas deteksi berdasarkan ATR multiplier dan range bar . Notifikasi real-
Ritz Smart Support & Resistance Zones Market Structure Based S/RT his advanced indicator detects and displays high-probability support and resistance zones based on actual market structure (swing highs and lows). Using intelligent zone merging and ATR-based fuzz buffers, it ensures the zone blocks are aligned with real price extremes without gaps. Zones are classified by strength (Proven, Verified, Untested, Turncoat, Weak) and visually rendered using colored rectangles. Ideal for traders seeki
ScalpReactor X A Tactical Indicator for Precision Traders The Ritz Scalping Habbit is a powerful MT5 indicator designed to help traders execute disciplined, high-probability trades through clear visual cues and multi-strategy confirmations. Whether you’re an intraday scalper or a swing trader , this tool integrates advanced market analysis into a single, easy-to-use interface. Key Strengths: Smart Buy & Sell Arrows — Based on multi-layer signals from RSI, ATR, EMA, ADX, and price momentum. Colo
Quantum Reflex Kuantum Reflex is a momentum-based oscillator indicator designed to deliver fast, accurate, and adaptive market insights. Built for real-time trading environments, it enables traders to spot rapid trend reversals, identify overbought/oversold levels, and combine short-term cross signals with higher-timeframe trend confirmation. Key Features Visual Cross Detection → Detects BUY/SELL signals from %K/%D crossover with instant updates for fast reversals. Dynamic Zone Highlight → Autom
BUY or SELL FlashScalp Multi-System Indicator The FlashScalp Multi-System Indicator is a next-generation trading tool engineered for precision scalpers, intraday strategists, and professional analysts who demand both speed and clarity in market visualization. It seamlessly integrates smart candle-based analytics, adaptive ATR logic, and real-time economic event awareness — giving you a fully synchronized view of market volatility and momentum. Through an elegant and optimized interface, FlashSc
キャンドル分析コナン Candle Analysis Conan PRO は、 ダイナミックなフラクタルロジックとアダプティブスイング検証エンジンによって構築された、 高精度のトレンド検出と市場構造可視化システムです。 本システムは、HH(高値更新)、LL(安値更新)、および主要な構造変化をシームレスに判別し、 機関投資家レベルの明確さで市場の「本質的なリズム」を読み解くことを可能にします。 ZigZag 精度、フラクタル検証、そしてボリューム認識ロジックを統合し、 SMC(Smart Money Concept)、マーケットストラクチャー分析、 高精度のスイング分析に最適化された設計となっています。 コアエンジンモジュール(Core Engine Modules) 1. ZigZag フラクタル検出 カスタマイズ可能な Fractal_Period による高度なフラクタル認識 ノイズを抑え、構造的な転換点を確実に捉えるアダプティブ ZigZag Min_Deviation による最小変動幅の精密管理 2. トレンド確認フィルター(Trend Confirmation Filter)
フィルタ:
Xuntao Su
894
Xuntao Su 2026.02.15 12:52 
 

1-its also will be much better if can make a X/Y position with the volume-panel of sub-chart ,

2-up volume should go upside of 0-line, down volume should go downside of 0-line , so this will be much clearly;

thanks !

Syamsurizal Dimjati
19872
開発者からの返信 Syamsurizal Dimjati 2026.02.15 14:37
Hi Xuntao Su, I don't plan to develop your suggestion further. 1. Volume is irrelevant when setting max and min levels. If you look at each timeframe, the difference in volume depends on the transaction time and interval, so there's no benchmark for a percentage. Even when the volume increases, the price moves only briefly. 2. Creating subcharts is certainly possible, but their effectiveness is far less noticeable. Changes in the histogram are more noticeable than the values ​​occurring on the subcharts. The bottom right is the pure transaction result from the number of bars calculated (customized in the parameters), which can already provide an overview of the trend of transaction values ​​at the interval used. Thank you for using it. Don't forget to try my paid indicators; I really appreciate it.
レビューに返信