Basic Pivot Point Indicator for MT5
- インディケータ
- バージョン: 2.1
- アップデート済み: 6 1月 2026
- アクティベーション: 5

To review our products, please click the link: LINK
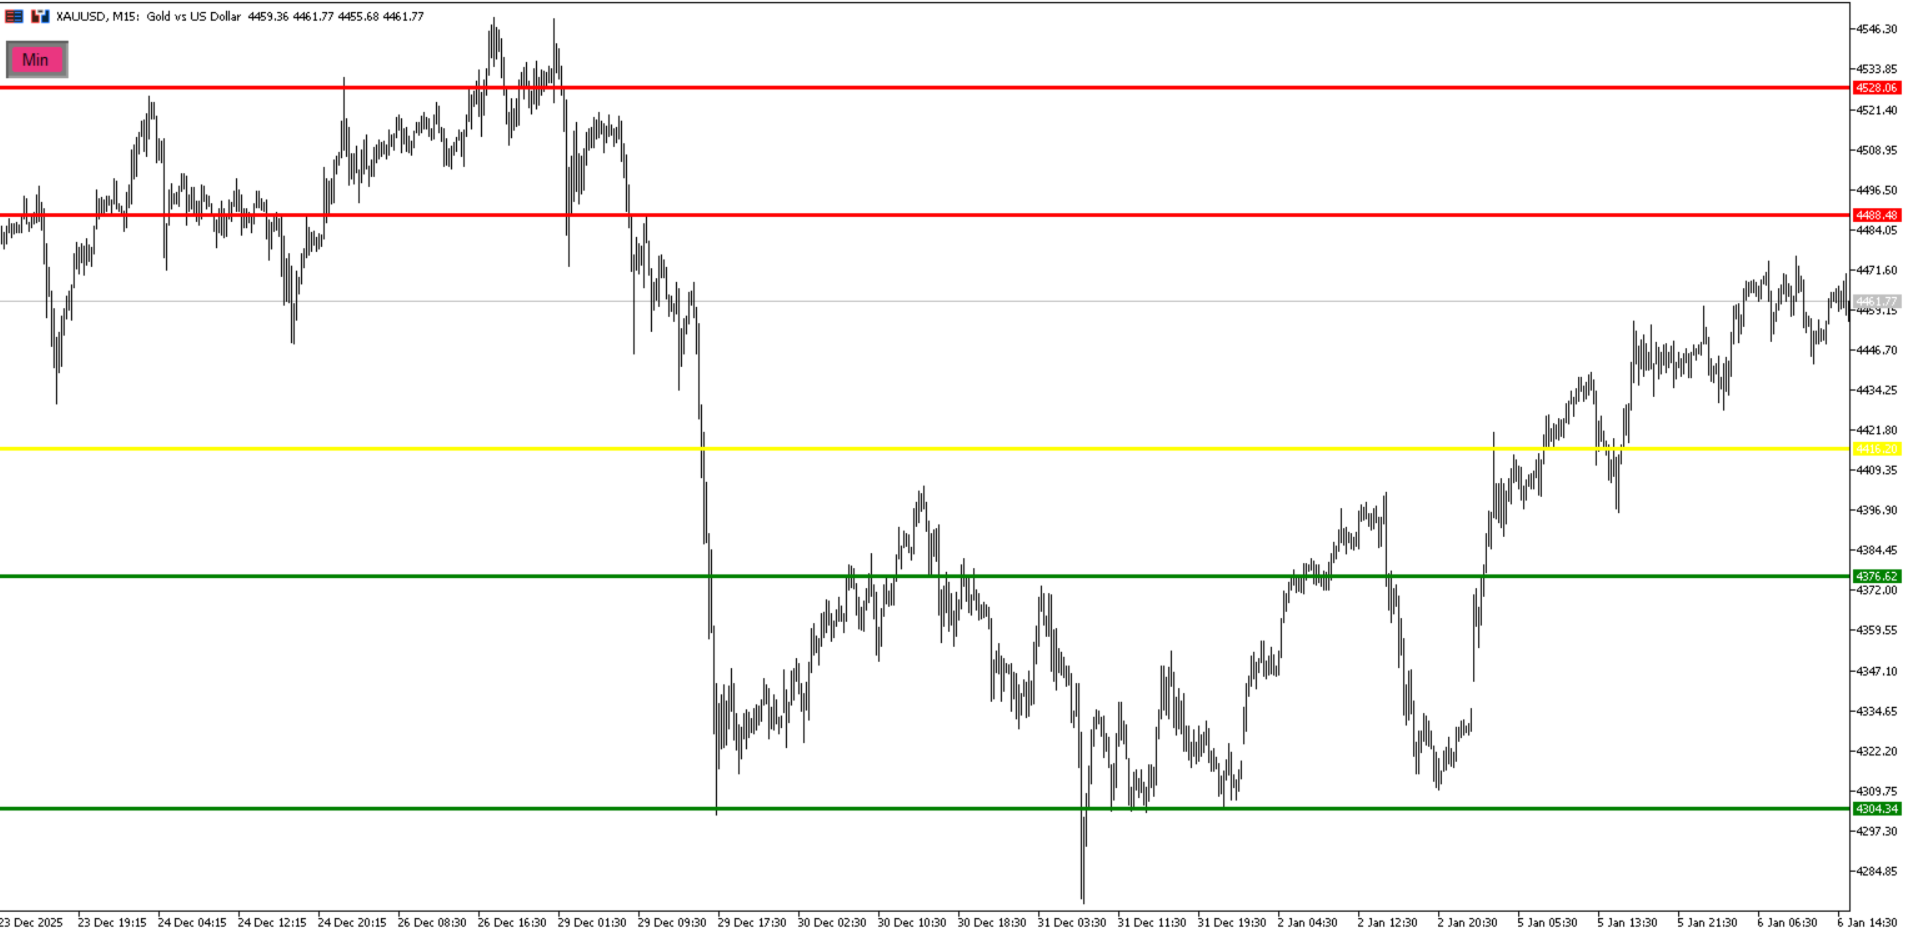
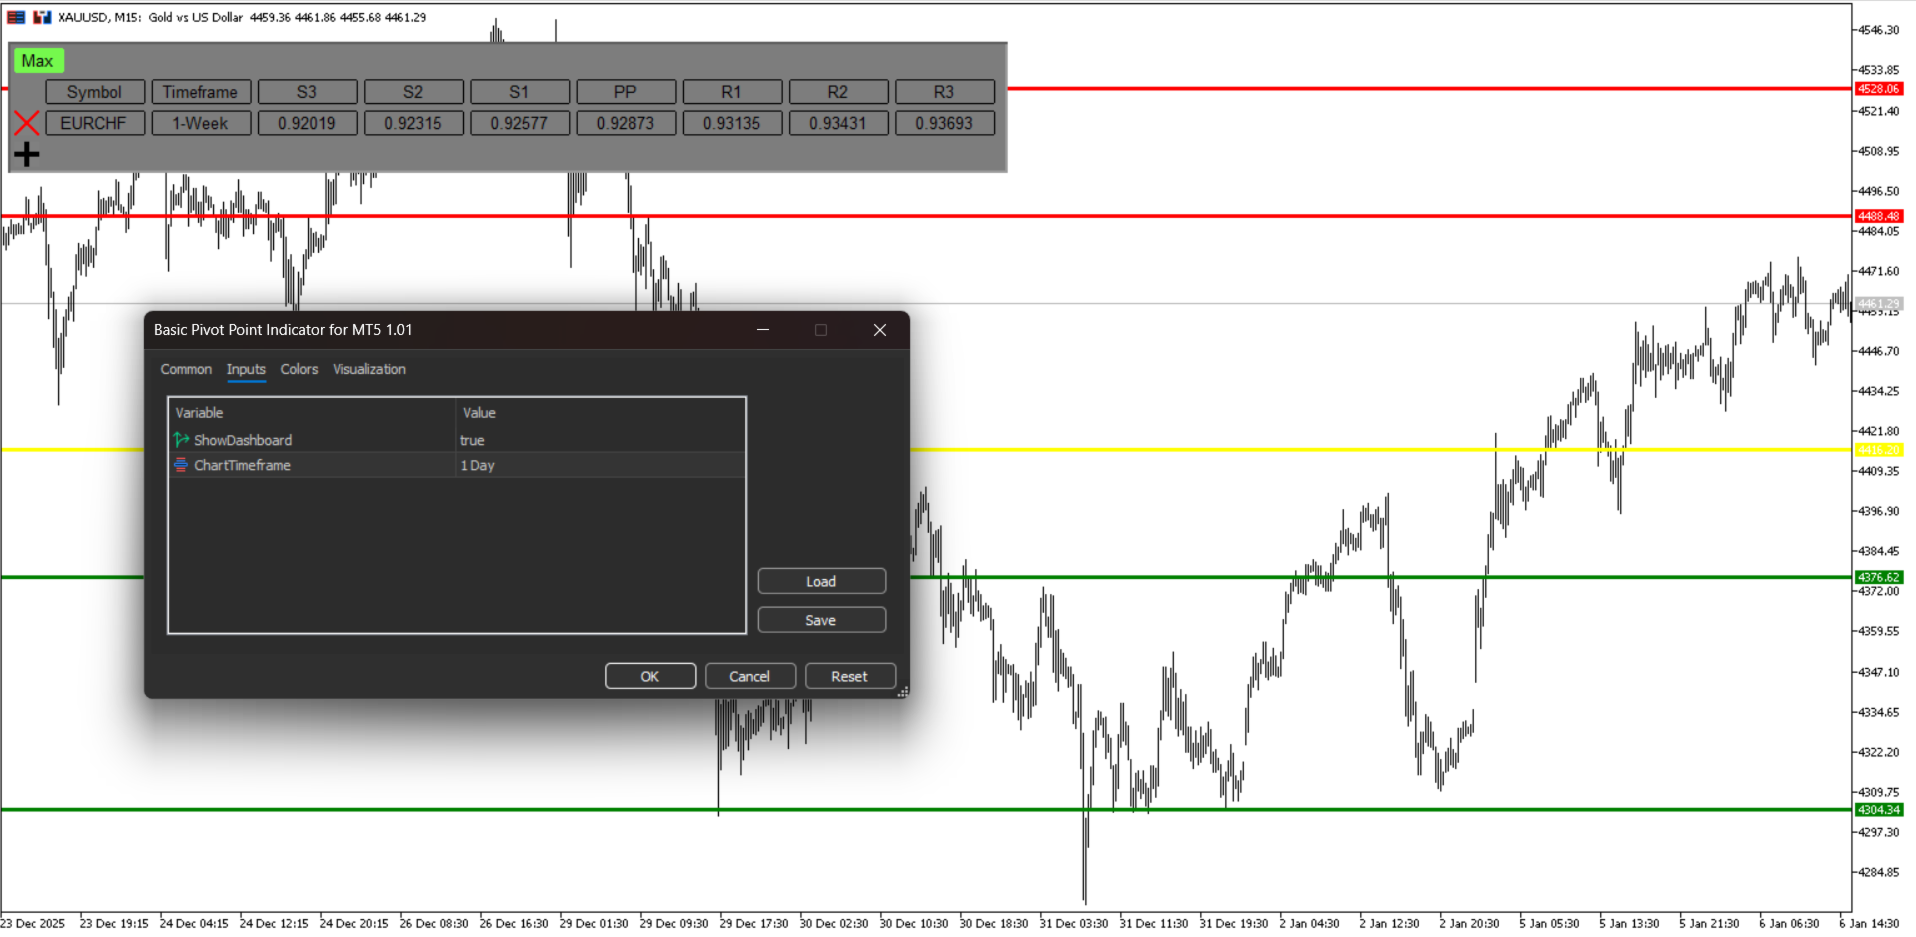
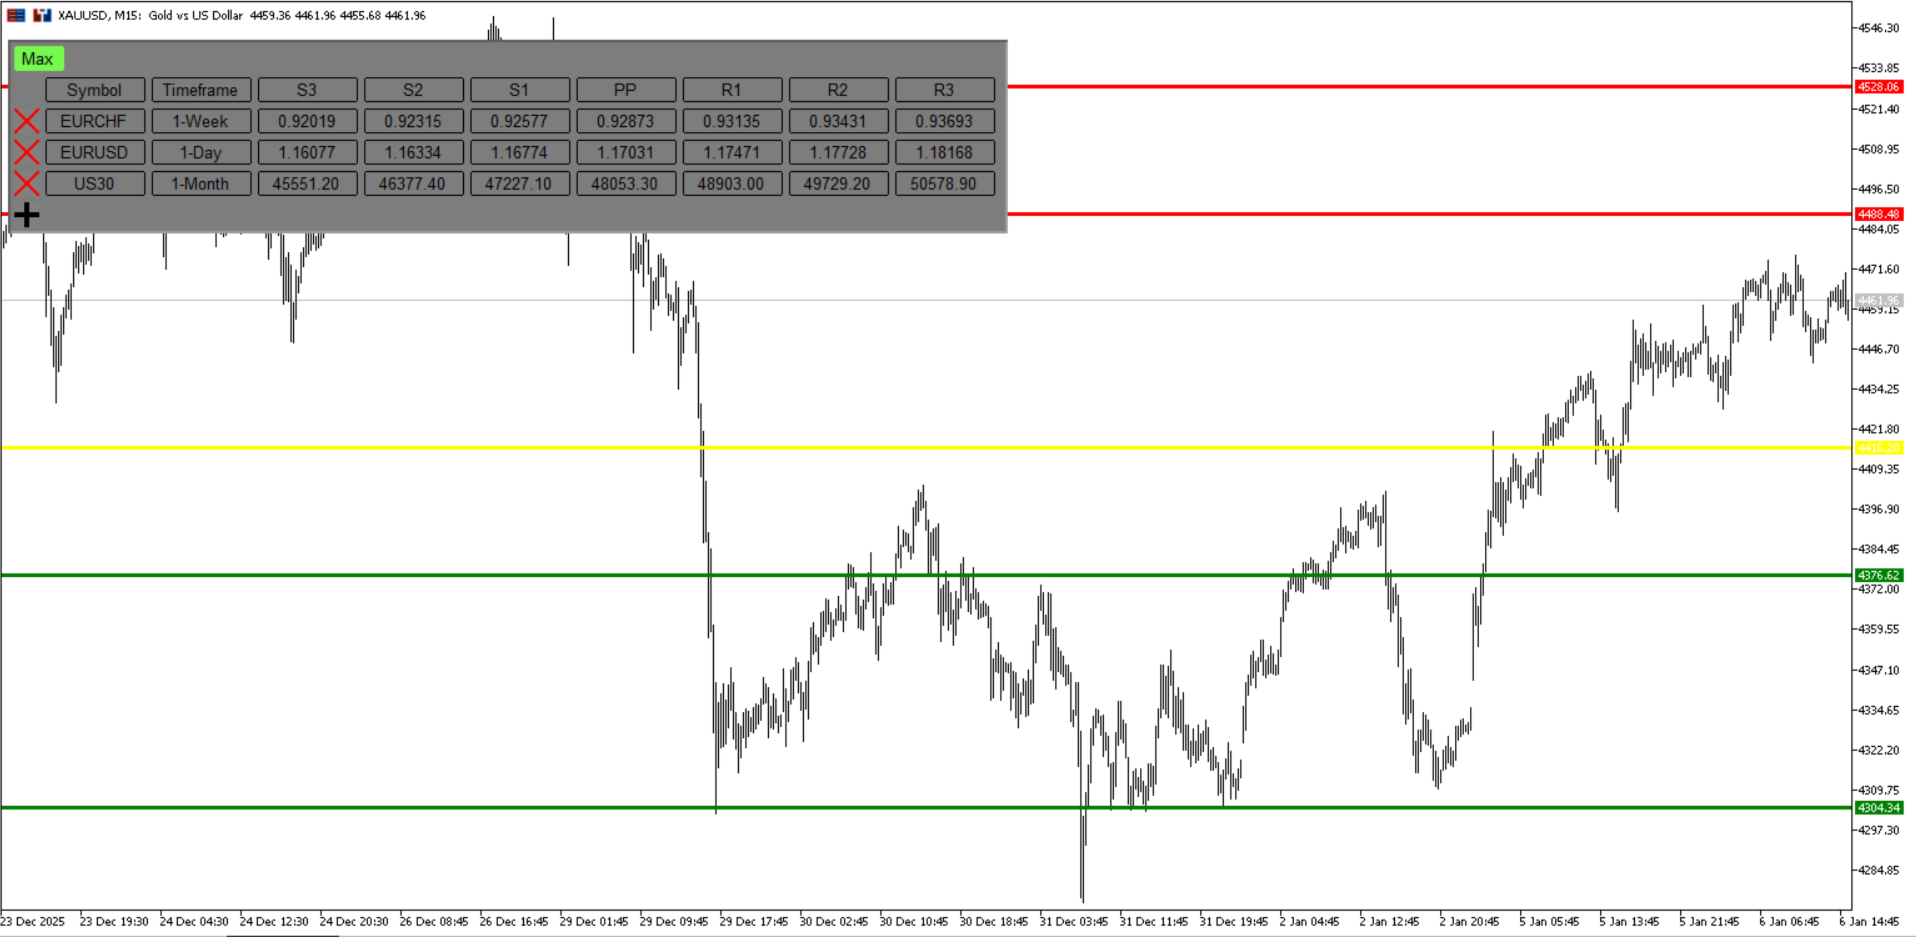
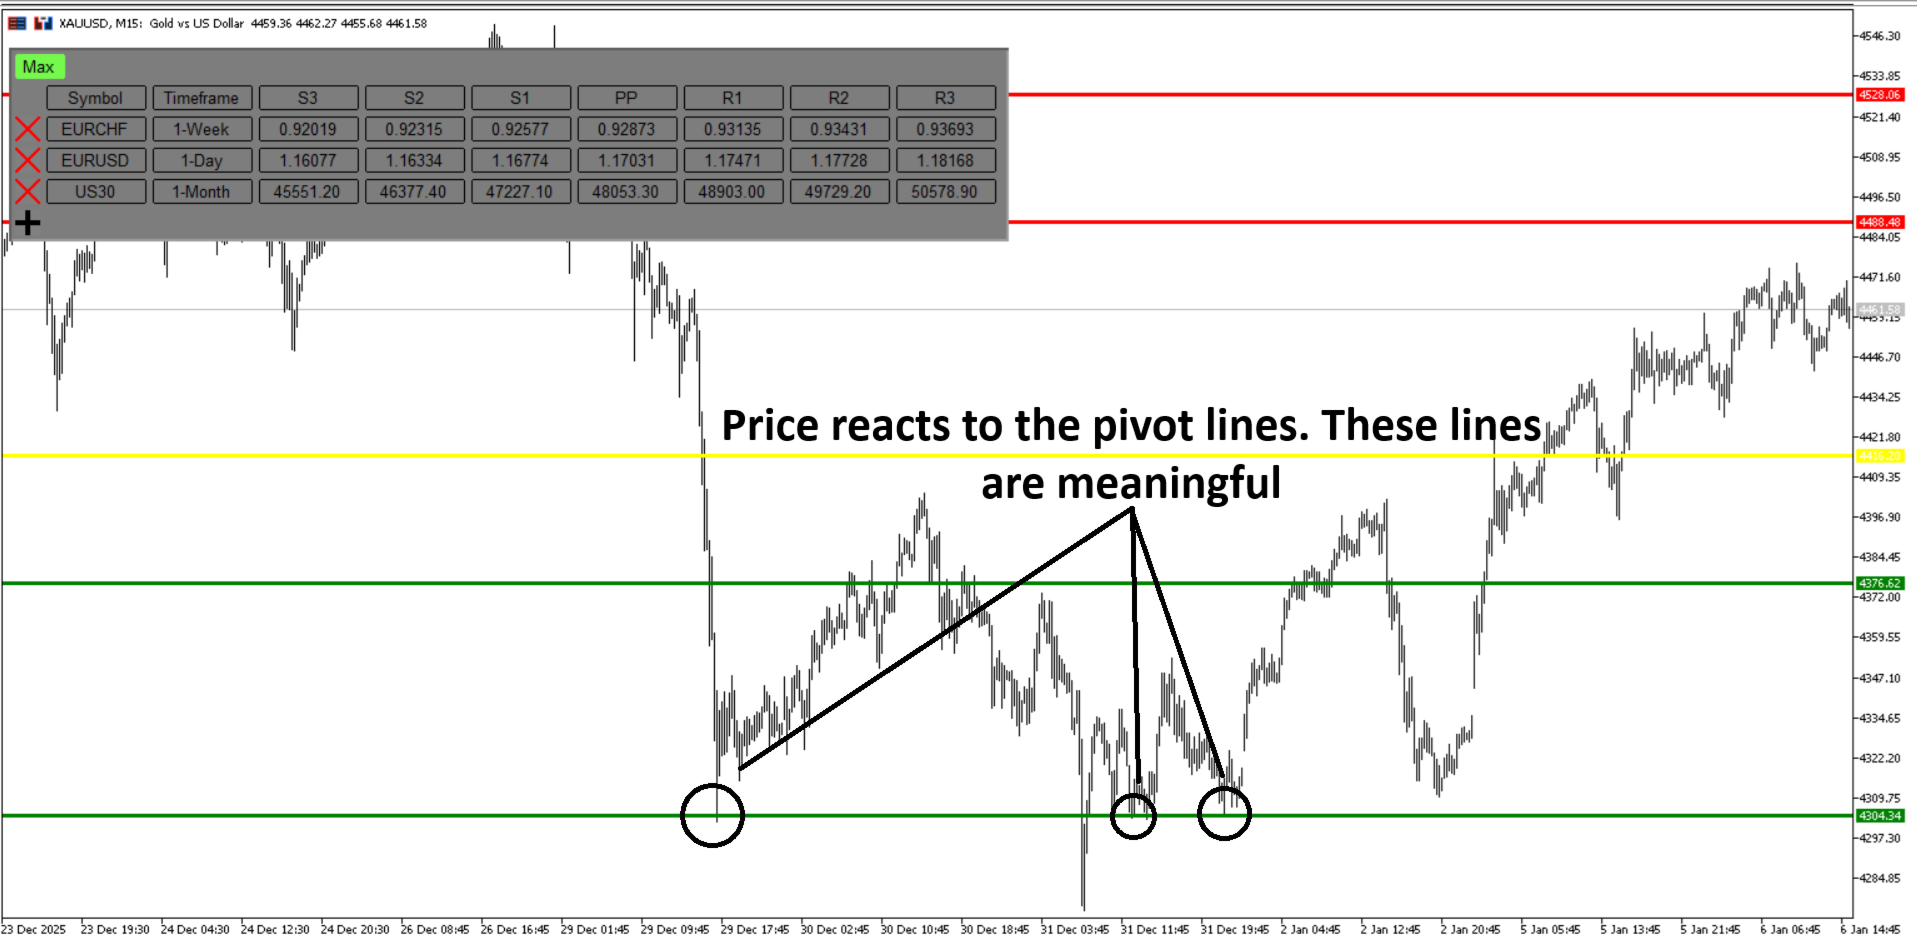
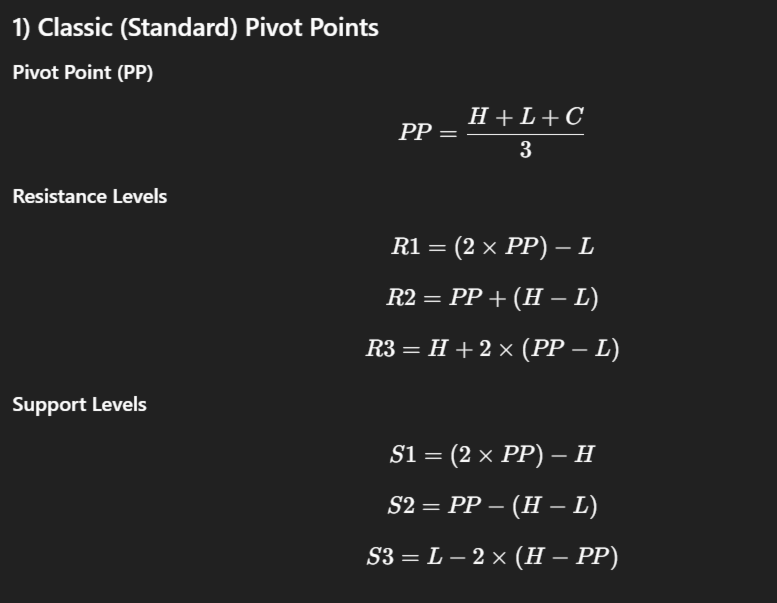
This Classic Pivot Point Indicator accurately calculates and displays 7 essential pivot levels, including the Pivot Point, 3 Support levels (S1–S3), and 3 Resistance levels (R1–R3) based on the standard classic pivot formula. Designed for Forex, indices, commodities, and crypto trading, it supports multi-currency and multi-timeframe analysis in a clean, professional dashboard interface. With the built-in interactive dashboard, traders can easily add new instruments by clicking the plus (+) button, then entering the desired symbol and timeframe to instantly view pivot levels. This indicator helps traders identify key support and resistance zones, improve entry and exit precision, and enhance intraday and swing trading strategies. Ideal for traders seeking a reliable pivot point tool, market structure confirmation, and high-probability trading decisions in MetaTrader. Setting of this indicator
Show Dashboard: A parameter to show the dashboard on the left side of the screen.
Chart Time Frame: The timeframe to show the calculations based on it.