MRA Index
- インディケータ
- バージョン: 2.1
- アップデート済み: 20 7月 2023
- アクティベーション: 5

MRA Index インジケーター概要
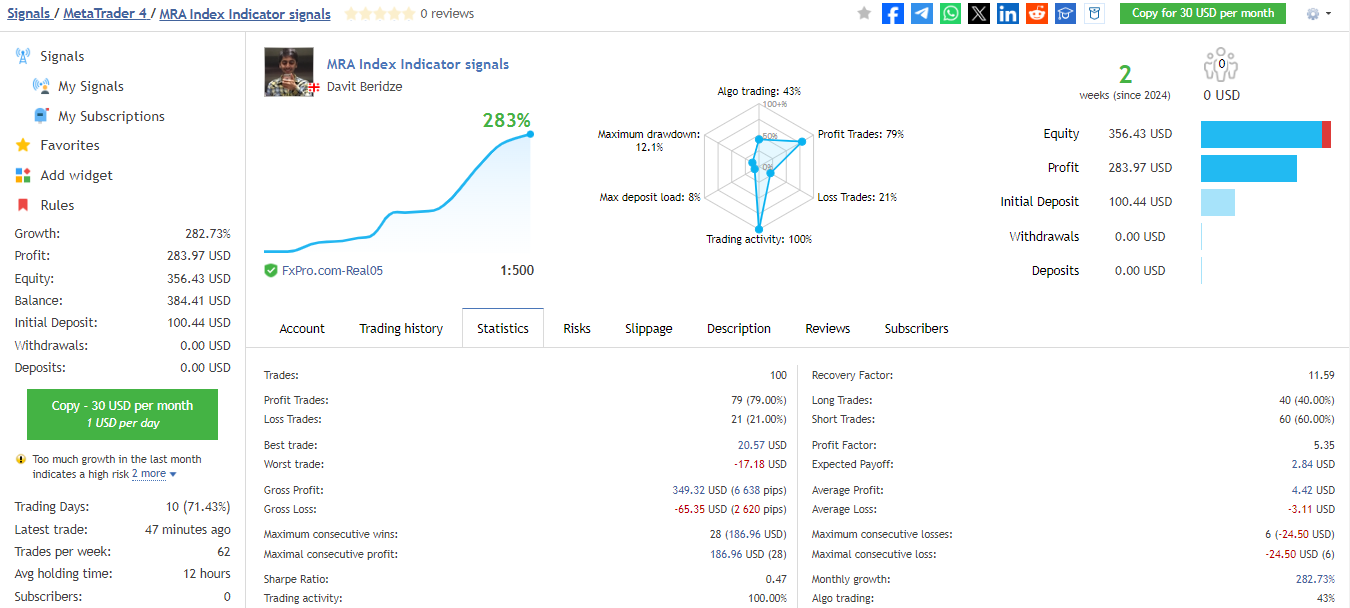
ボーナス特典: インジケーターを購入すると、「MRA Index EA」を無料で入手できます。
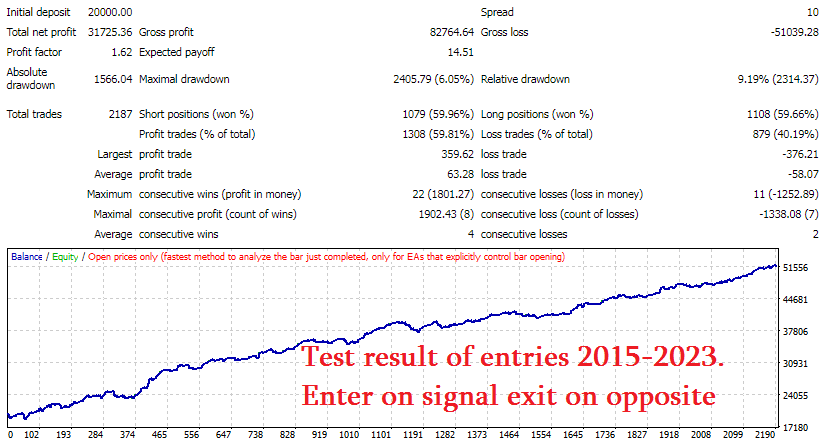
最適化戦略: スキャルピングでは、過去12か月間のデータを基に設定を最適化し、次の1か月間使用します。この方法は非常に効果的であることが証明されています。
重要な注意点: デフォルト設定は視覚化のみを目的としており、収益性のために最適化されていません。適切な最適化手順は購入者のみに提供されます。
「MRA Index」インジケーターについて:
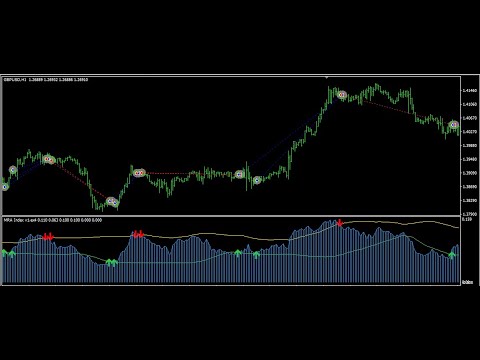
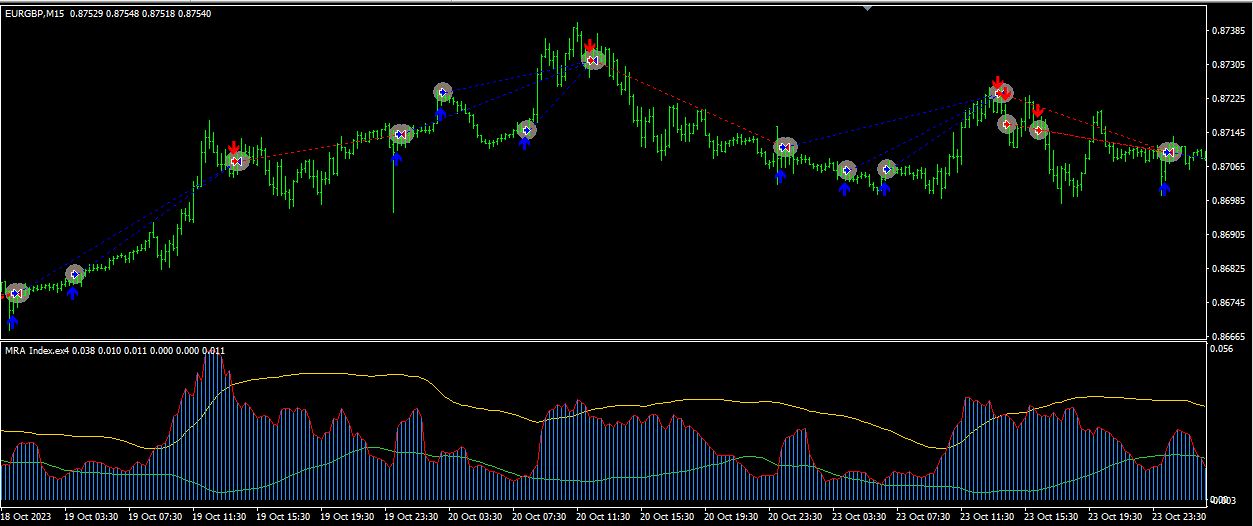
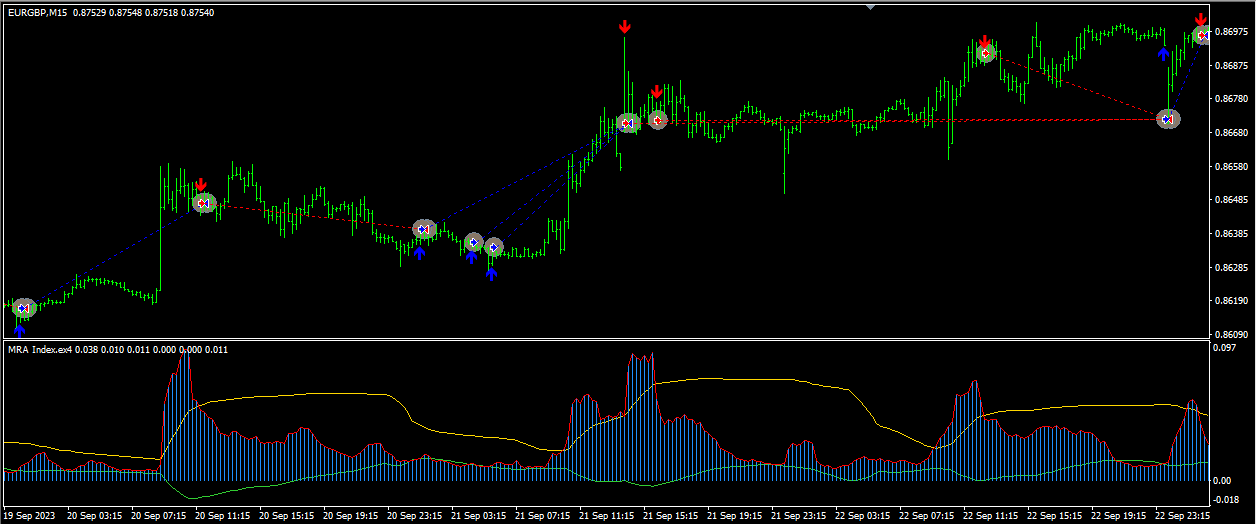
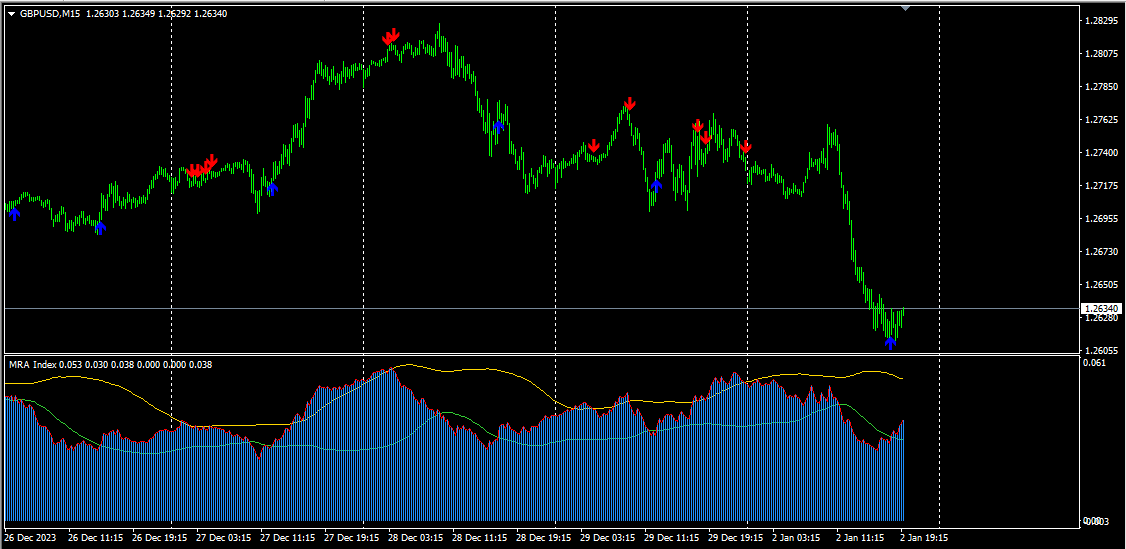
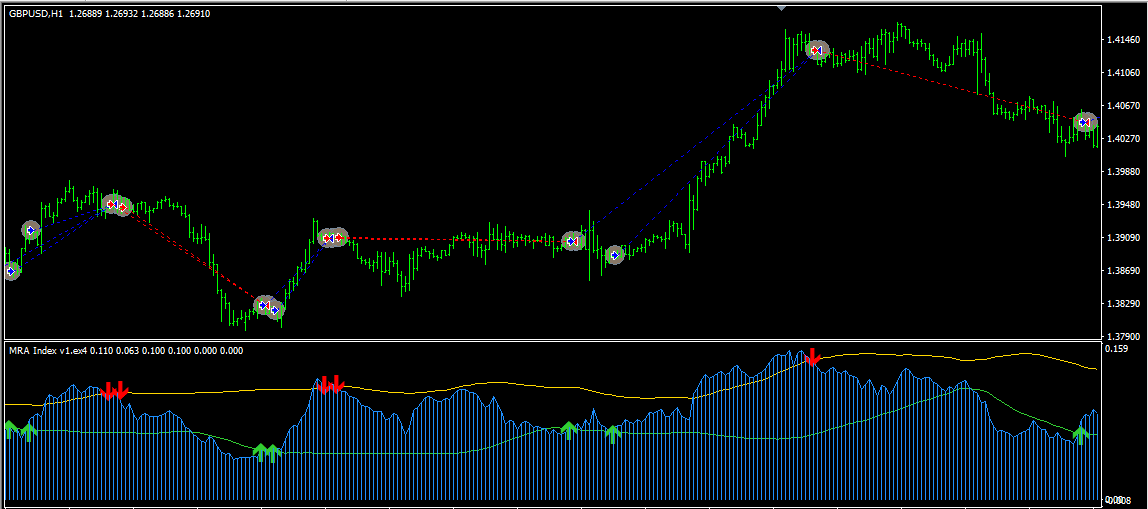
「MRA Index」は、多様な市場動向とエントリーポイントを特定するのに役立つ多機能なFXインジケーターです。専門的なチャネルと、その中を移動する動的なハイブリッドラインを備えており、売買シグナルを生成します。
主な特徴:
-
動的ハイブリッドライン: チャネル内を移動し、取引シグナルの基盤となります。
-
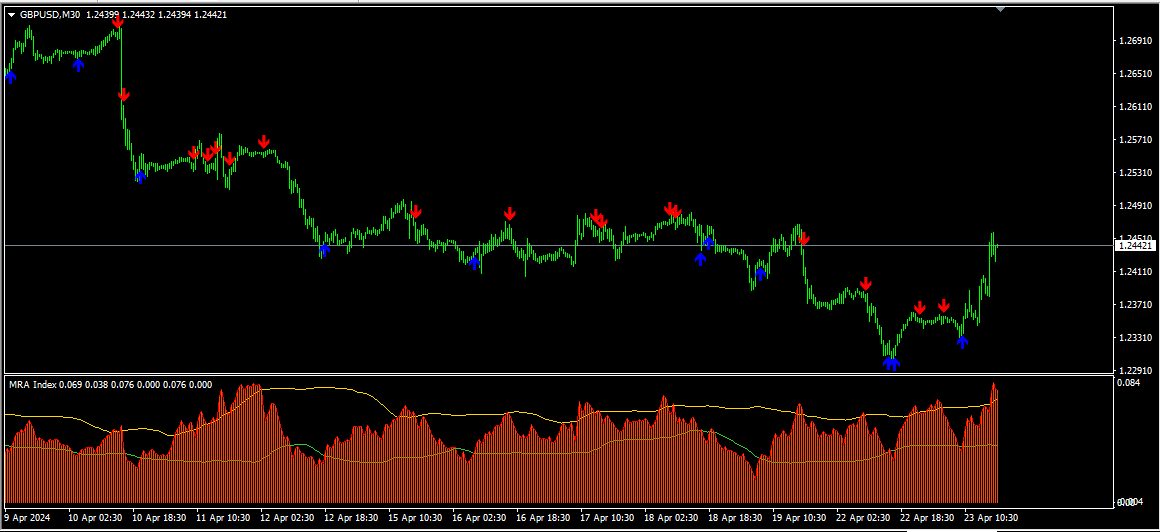
買い・売りシグナル: ハイブリッドラインとチャネルの特定の相互作用に基づいて生成され、市場の反転の可能性を示します。
-
カスタマイズ: さまざまな入力パラメーターを調整して、トレーダーの戦略に適応できます。
-
オプションのフィルター:
-
ATR(平均真の範囲): 感度を調整するために有効または無効にできます。
-
ボリンジャーバンド(BB): 価格アクションに基づいたシグナルのフィルタリングを支援します。
-
FTRフィルター: 色分けされた市場状況の視覚的な識別を提供します。
-
カスタマイズオプション: インジケーターは、ATR、MFI、RSI、ボリンジャーバンド、および標準偏差の設定を含む複数の入力パラメーターを提供します。さらに、ポップアップメッセージ、プッシュ通知、サウンド、メールを通じてアラートを有効または無効にすることができます。
リスク免責事項: いかなるインジケーターも利益を保証するものではありません。効果的なリスク管理と「MRA Index」を他の分析手法と組み合わせることが、適切な取引判断を行うために不可欠です。
入力パラメーターの概要:
-
インジケーターの動作:
-
UseATR: ATRの計算を有効/無効にします。
-
Std_Period: チャネルの標準偏差期間。
-
TimeFrame: チャートの時間枠を設定。
-
History: 計算するバーの数。
-
-
フィルター:
-
UseBB: ボリンジャーバンドフィルターの有効/無効。
-
periodFTR: FTRフィルターによる市場状況の視覚化を制御。
-
-
アラート:
-
alertsOn: アラートの有効/無効。
-
alertsPush, alertsSound, alertsEmail: 通知の設定。
-
これらの設定をカスタマイズすることで、トレーダーはインジケーターを自身の取引スタイルや目的に合わせることができます。


very helpfull seller, results looks good, looking forward, thank you