MRA Index
- 지표
- 버전: 2.1
- 업데이트됨: 20 7월 2023
- 활성화: 5

MRA Index 지표 개요
보너스 혜택: 지표를 구매하면 "MRA Index EA"를 무료로 받을 수 있습니다.
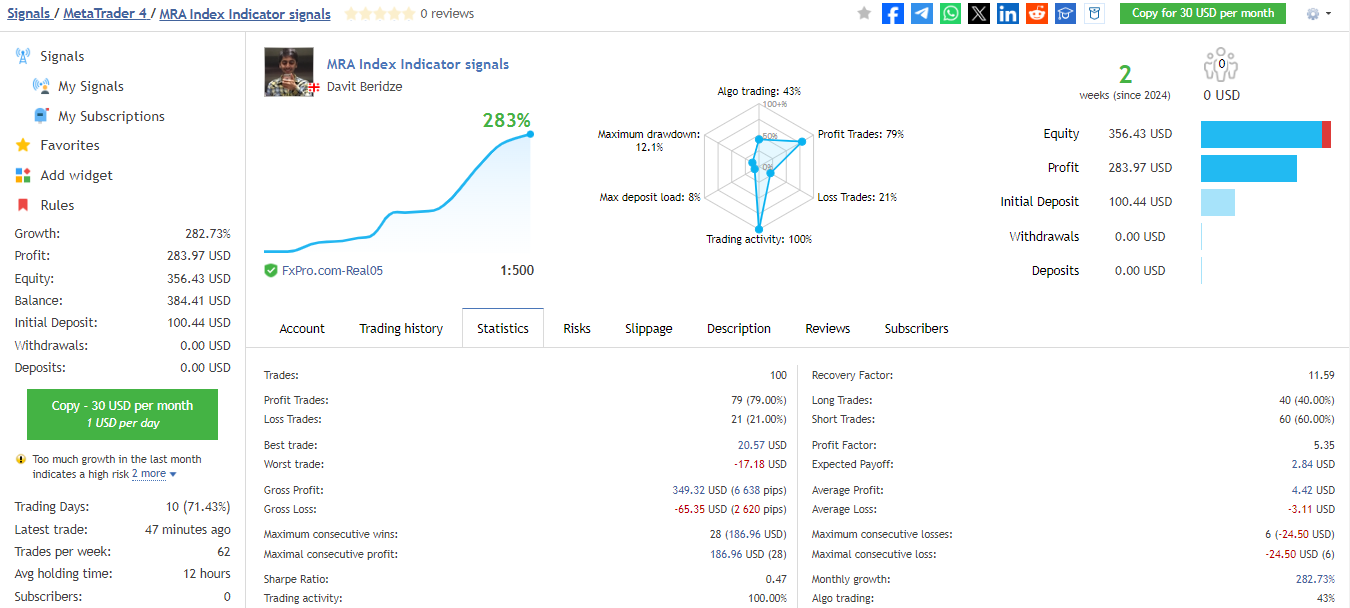
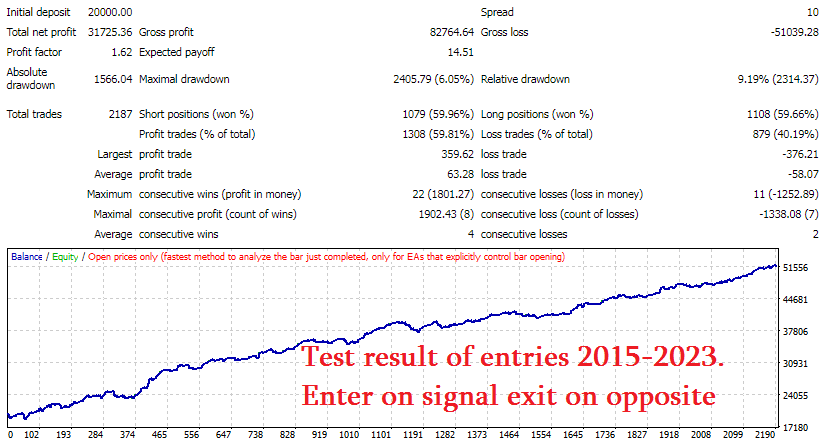
최적화 전략: 스캘핑을 위해 지난 12개월 동안의 데이터를 기반으로 설정을 최적화하고 다음 1개월 동안 사용합니다. 이 방법은 매우 효과적인 것으로 입증되었습니다.
중요한 참고사항: 기본 설정은 시각화용일 뿐이며 수익성을 위해 최적화되지 않았습니다. 올바른 최적화 지침은 구매자에게만 제공됩니다.
"MRA Index" 지표 소개:
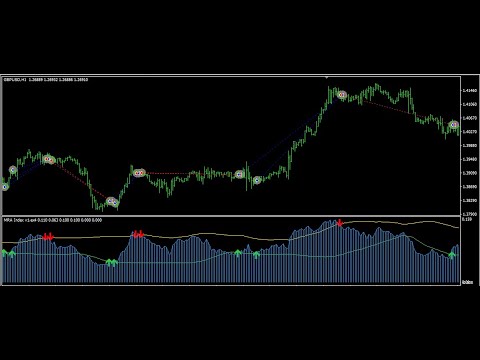
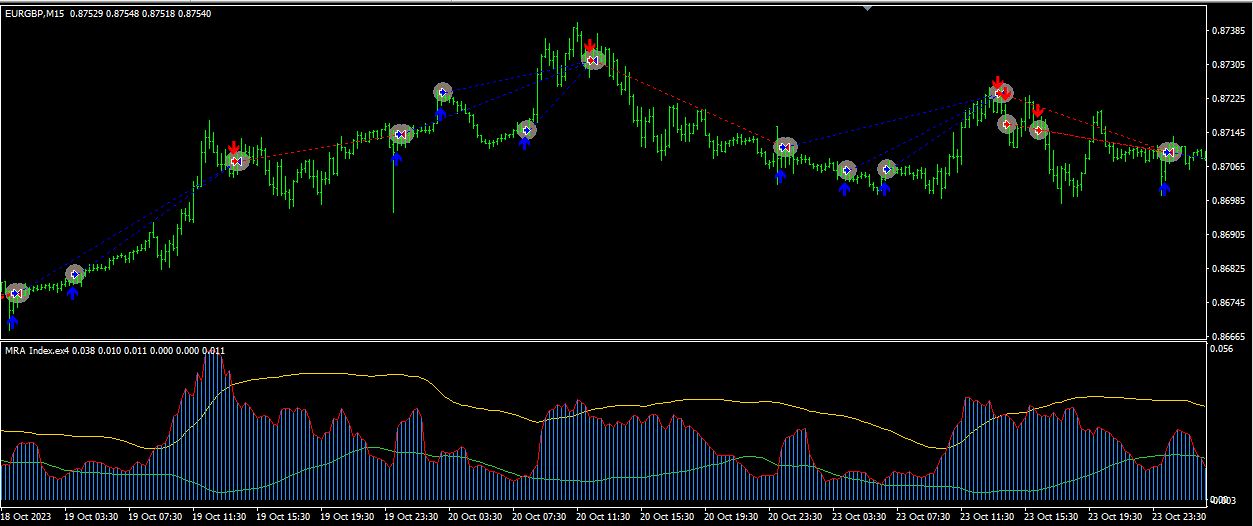
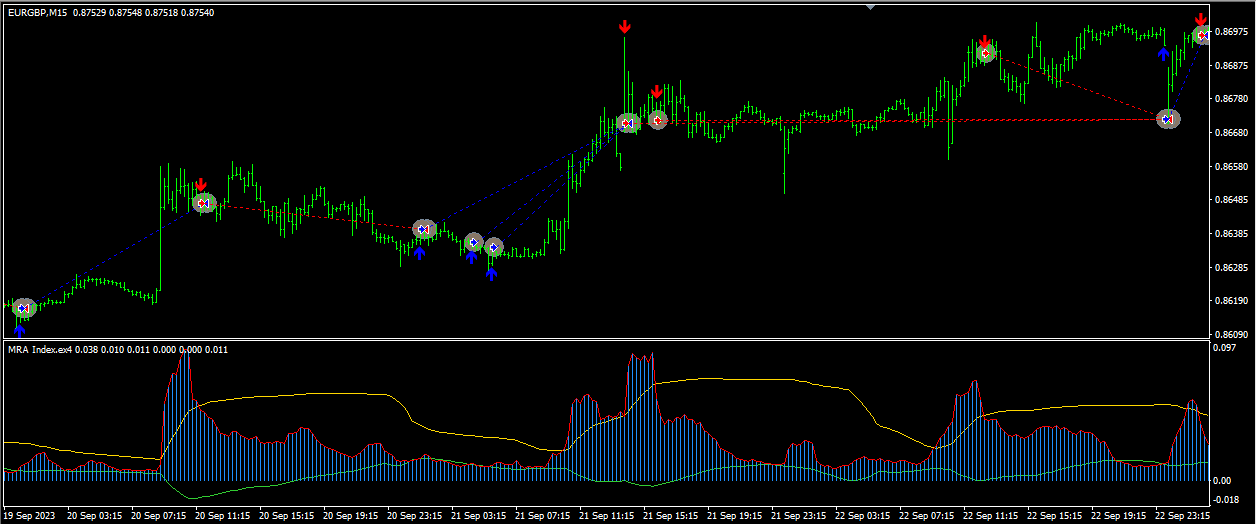
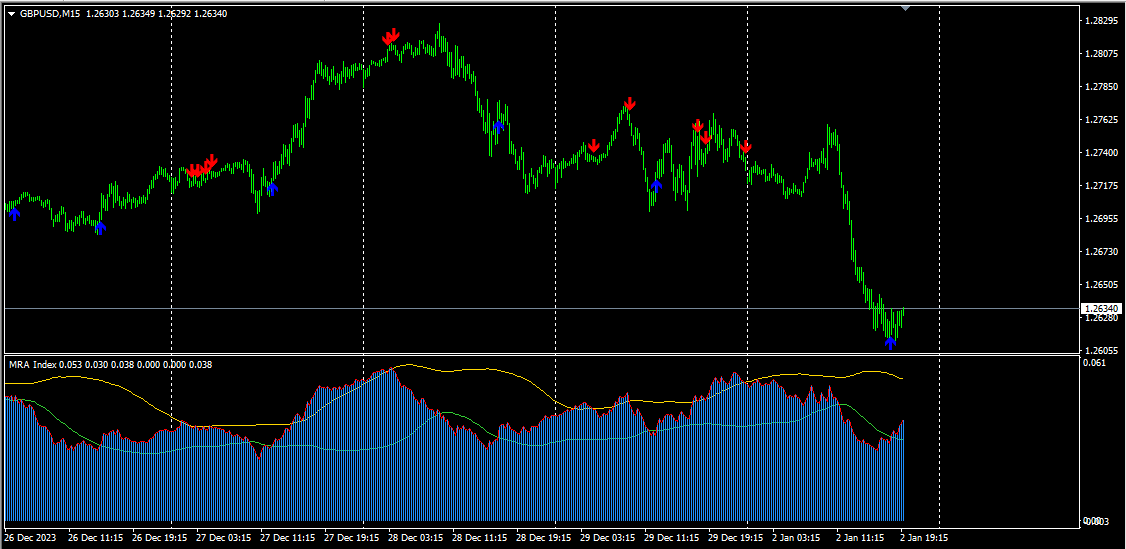
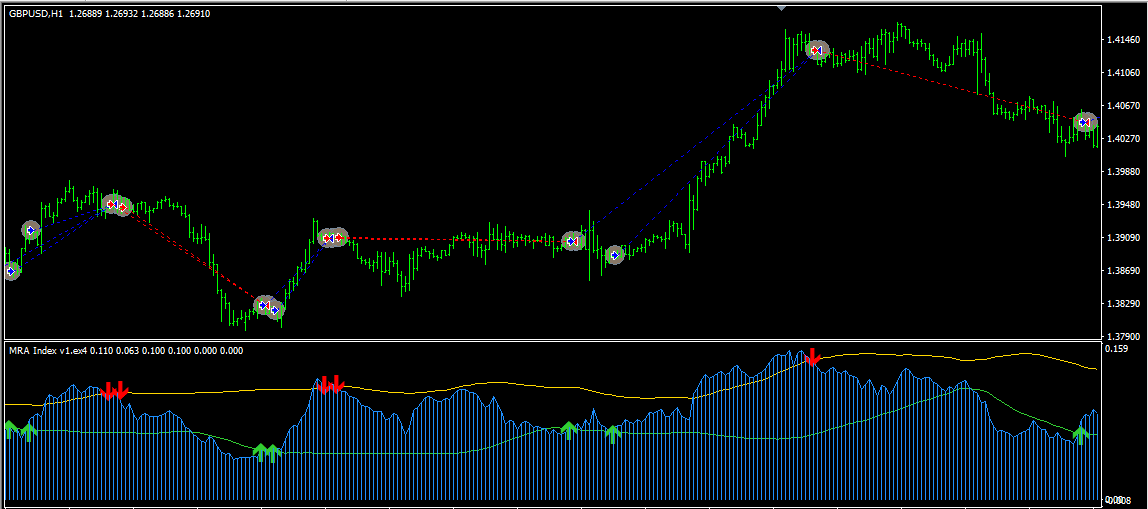
"MRA Index"는 트레이더가 잠재적인 시장 트렌드와 진입점을 식별하는 데 도움을 주는 다기능 외환 지표입니다. 이 지표는 특수 채널과 해당 채널 내에서 이동하는 동적 하이브리드 라인을 특징으로 하며, 이를 통해 매수 및 매도 신호를 생성합니다.
주요 특징:
-
동적 하이브리드 라인: 채널 내에서 이동하며 거래 신호 생성을 위한 기반이 됩니다.
-
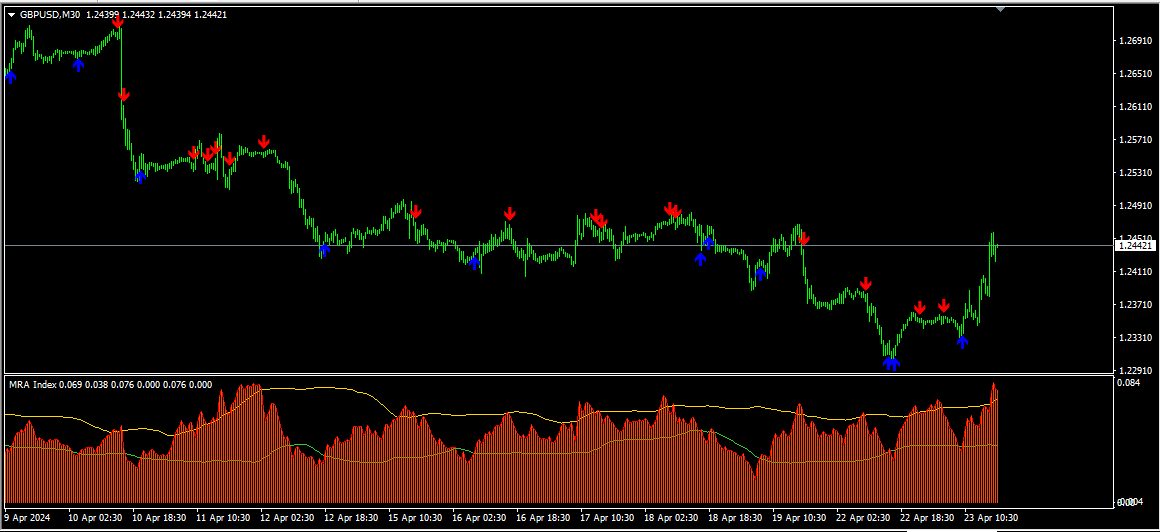
매수 및 매도 화살표: 하이브리드 라인과 채널 간 특정 상호작용을 기반으로 생성되며, 잠재적인 시장 반전을 나타냅니다.
-
맞춤 설정: 다양한 입력 매개변수를 조정하여 트레이더의 전략에 맞게 조정할 수 있습니다.
-
옵션 필터:
-
ATR(평균 실제 범위): 감도를 조정하기 위해 활성화하거나 비활성화할 수 있습니다.
-
볼린저 밴드(BB): 가격 움직임을 기반으로 신호를 필터링하는 데 도움을 줍니다.
-
FTR 필터: 색상 코드화된 시장 상태를 통해 시각적 트렌드 식별을 제공합니다.
-
맞춤 설정 옵션: 이 지표는 ATR, MFI, RSI, 볼린저 밴드 및 표준 편차 설정을 포함한 여러 입력 매개변수를 제공합니다. 또한, 트레이더는 팝업 메시지, 푸시 알림, 소리 및 이메일을 통해 알림을 활성화하거나 비활성화할 수 있습니다.
리스크 면책 조항: 어떤 지표도 수익성 있는 거래를 보장하지 않습니다. 효과적인 리스크 관리와 "MRA Index"를 다른 분석 기법과 결합하는 것이 정보에 입각한 거래 결정을 내리는 데 필수적입니다.
입력 매개변수 개요:
-
지표 동작:
-
UseATR: ATR 계산 활성화/비활성화.
-
Std_Period: 채널의 표준 편차 기간.
-
TimeFrame: 차트의 시간 프레임을 정의.
-
History: 계산할 바의 수.
-
-
필터:
-
UseBB: 볼린저 밴드 필터 활성화/비활성화.
-
periodFTR: FTR 필터를 통한 시장 상태 시각화를 제어.
-
-
알림:
-
alertsOn: 알림 활성화/비활성화.
-
alertsPush, alertsSound, alertsEmail: 알림 설정.
-
이러한 설정을 조정함으로써 트레이더는 자신의 거래 스타일과 목표에 맞게 지표를 조정할 수 있습니다.


very helpfull seller, results looks good, looking forward, thank you