Chart Patterns All in One

4.47

Chart Patterns All in One」をデモモードでお試しいただき、ボーナスを獲得してください。デモモードで試した後、メッセージを送っていただければボーナスをお渡しします。

購入後にコメントを残すと、高品質なインジケーター8つをボーナスとして受け取れます。

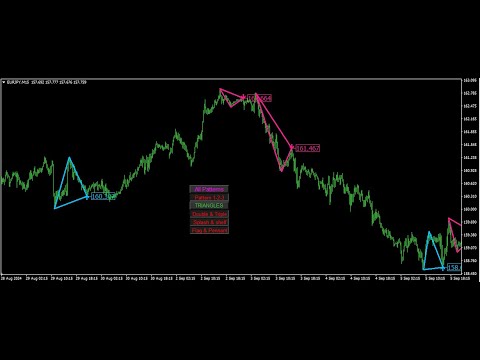
Chart Patterns All-in-One インジケーターは、トレーダーがテクニカル分析で一般的に使用されるさまざまなチャートパターンを視覚化するのに役立ちます。このインジケーターは市場の潜在的な動きを特定するのに役立ちますが、収益性を保証するものではありません。購入前にデモモードでテストすることをお勧めします。

現在のオファー: 「Chart Patterns All in One」インジケーターが50%割引。

含まれるパターン:

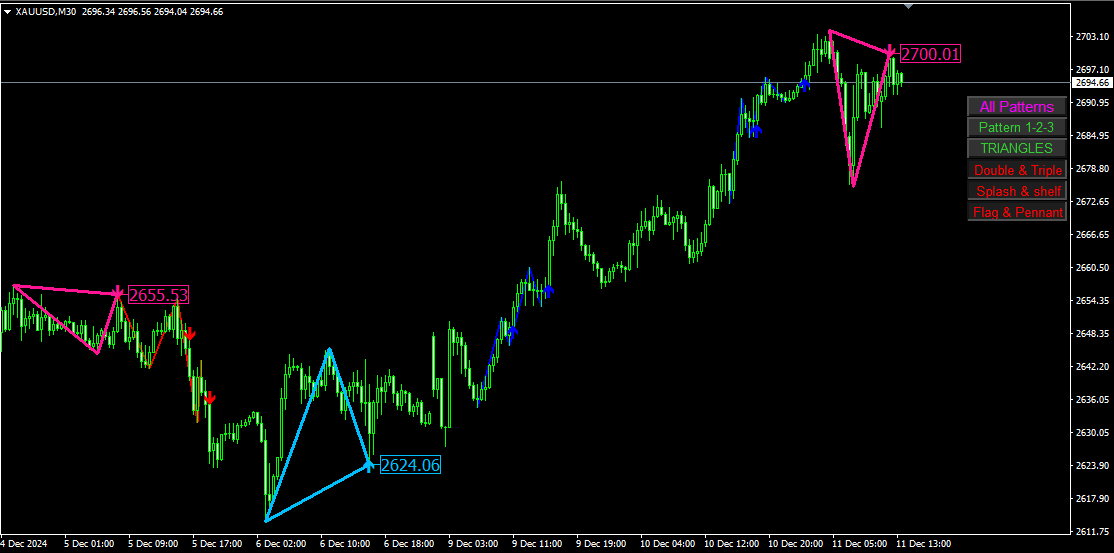
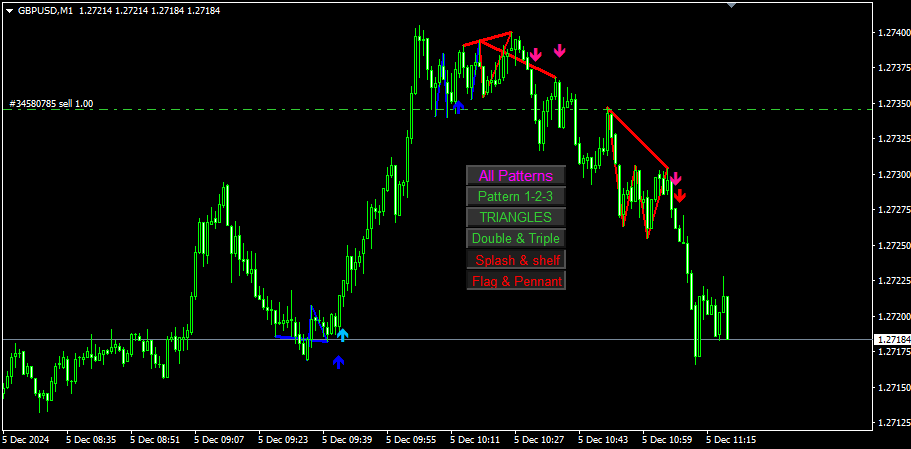
  • 1-2-3 パターン: 3つの主要なポイント(高値または安値)を使用して市場の反転を検出します。

    • 買い: 2つの連続する安値の後に、前の高値よりも低い高値が出現。
    • 売り: 2つの連続する高値の後に、前の安値よりも高い安値が出現。
    • 可視化: 特定されたポイントを線と矢印で接続。
  • ダブルトップとダブルボトム: 価格がほぼ同じ2つの連続した高値(ダブルトップ)または安値(ダブルボトム)を形成したときに、反転の可能性を示します。

    • ダブルトップ: ベアリッシュな反転。
    • ダブルボトム: ブルリッシュな反転。
    • 可視化: ピークまたは谷を線で接続し、矢印が反転ポイントを示します。
  • トリプルトップとトリプルボトム: ダブルトップ/ボトムと似ていますが、3つの連続した高値または安値を伴い、より強力な反転信号を示します。

    • トリプルトップ: ベアリッシュな反転。
    • トリプルボトム: ブルリッシュな反転。
    • 可視化: パターンを線と矢印でマーク。
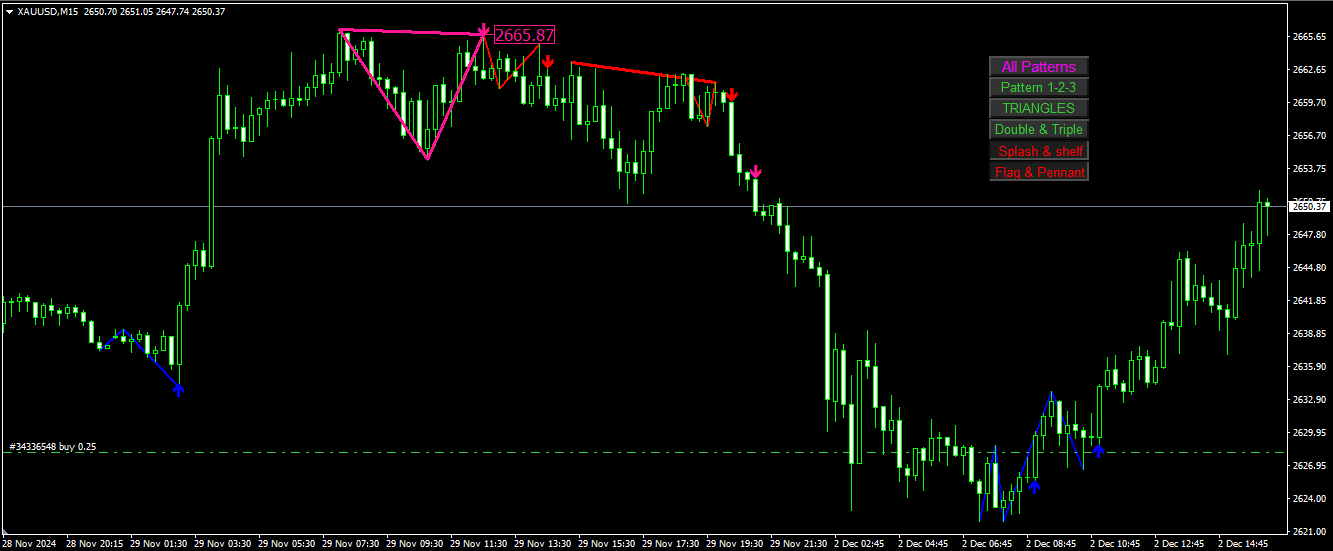
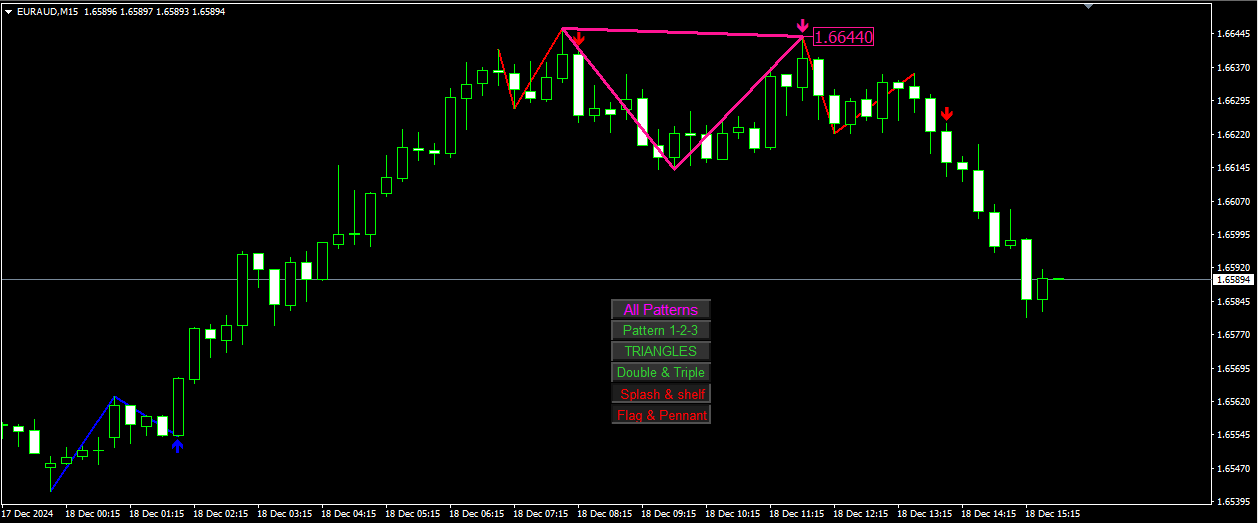
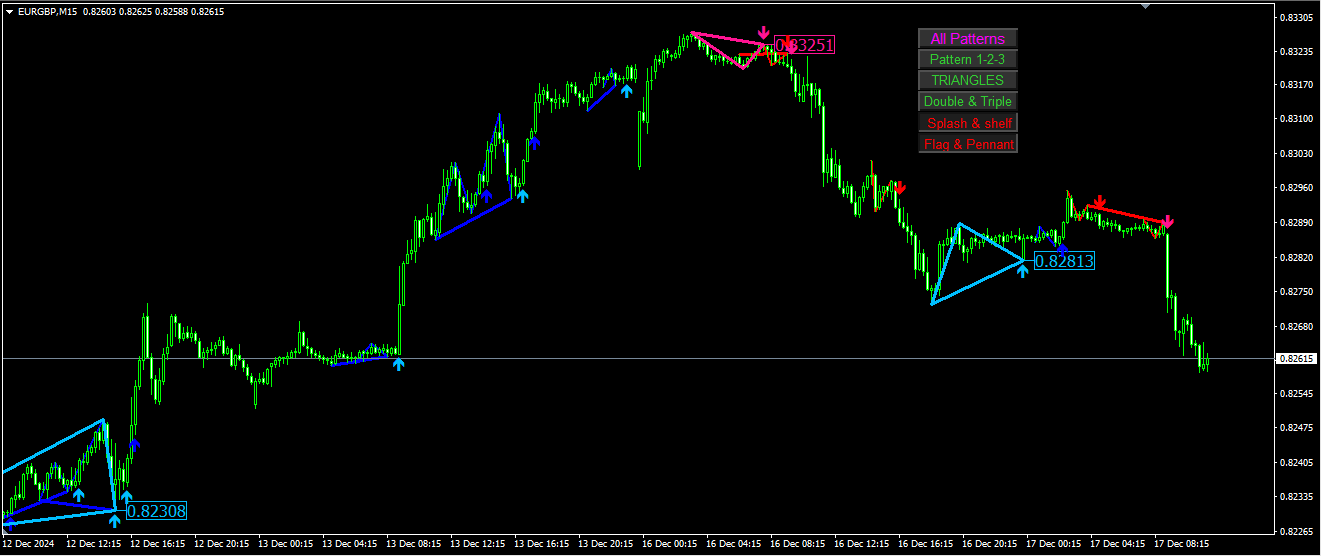
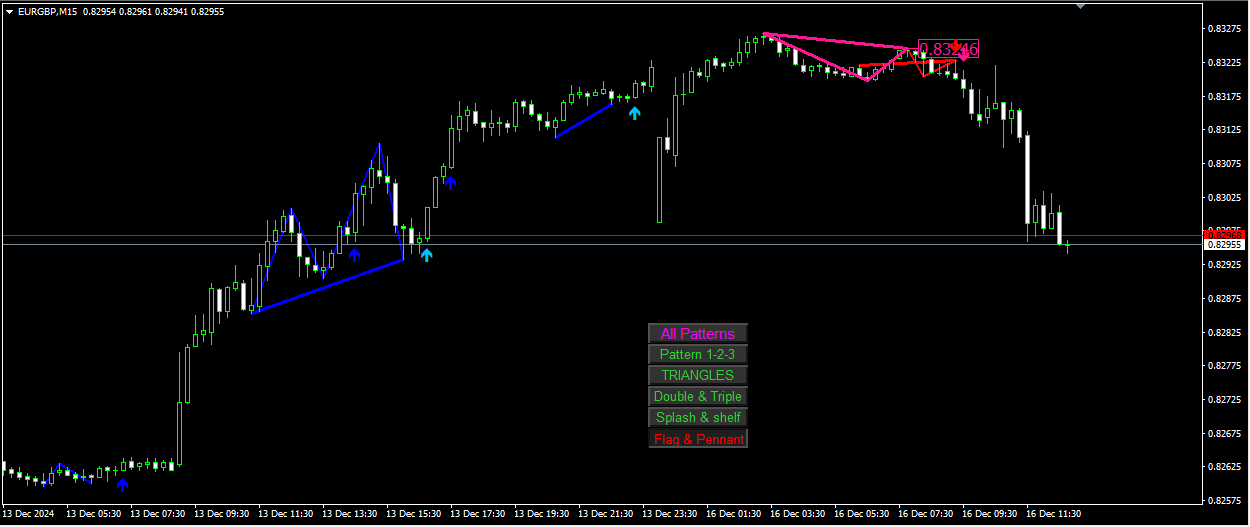
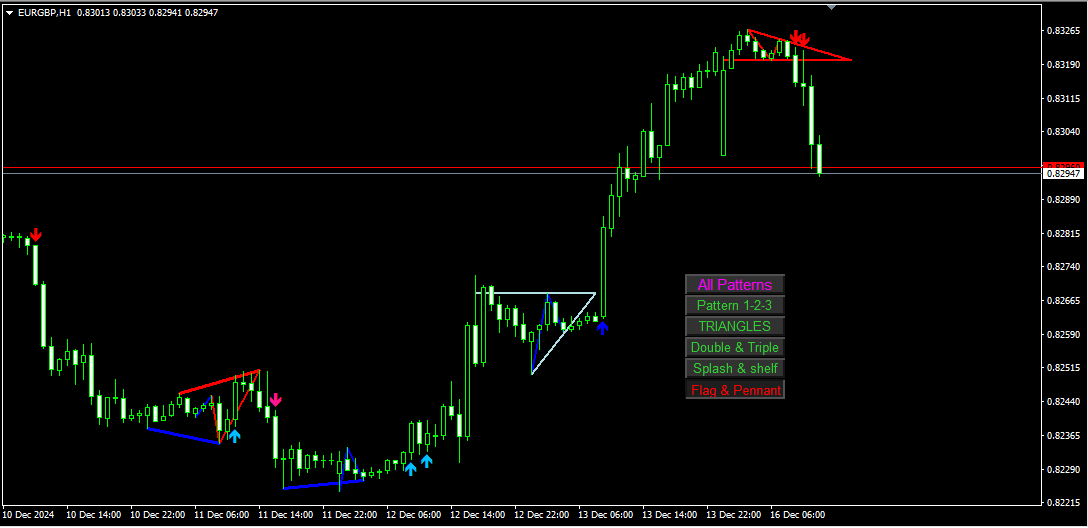
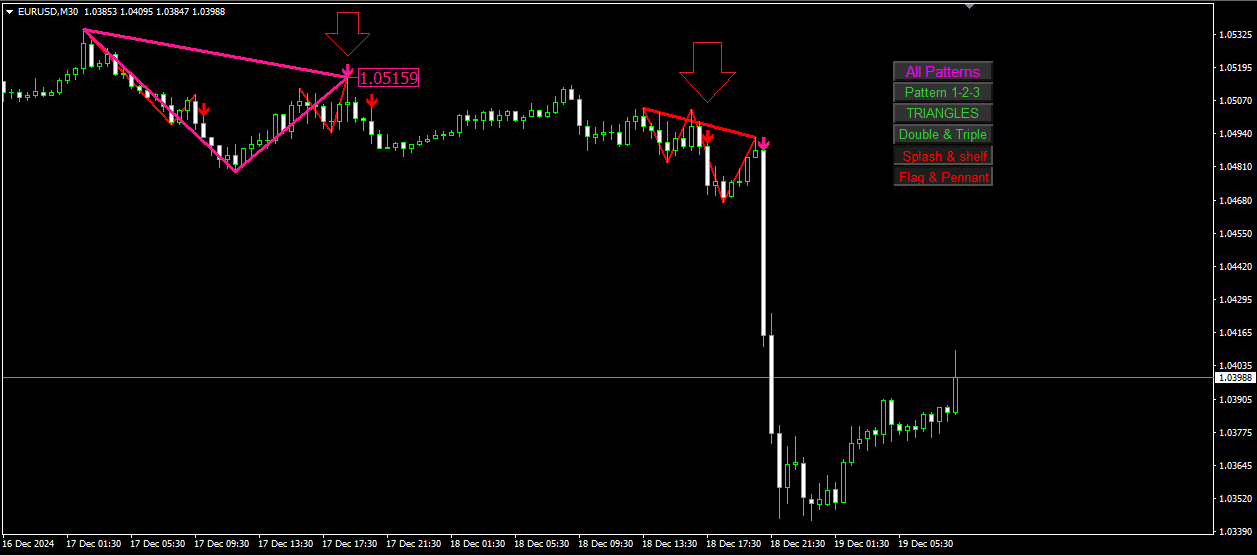
  • トライアングル: トレンド継続前の統合期間を特定します(Zig-Zag に基づいており、遅れて表示されたり、時折消えることがあります)。

    • 上昇トライアングル: ブルリッシュな継続。
    • 下降トライアングル: ベアリッシュな継続。
    • 可視化: 突破点を示す矢印付きのトライアングルをチャートに描画。
    • Zig-Zag の影響による遅延や消失があるものの、このパターンは依然として効果的です。詳細はビデオをご覧ください。
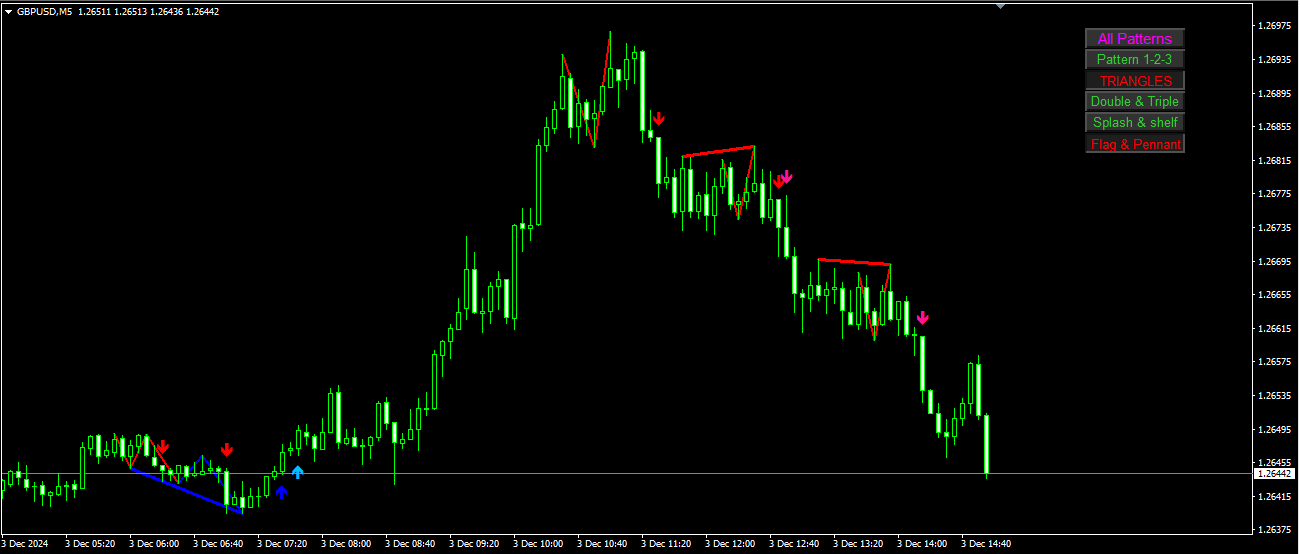
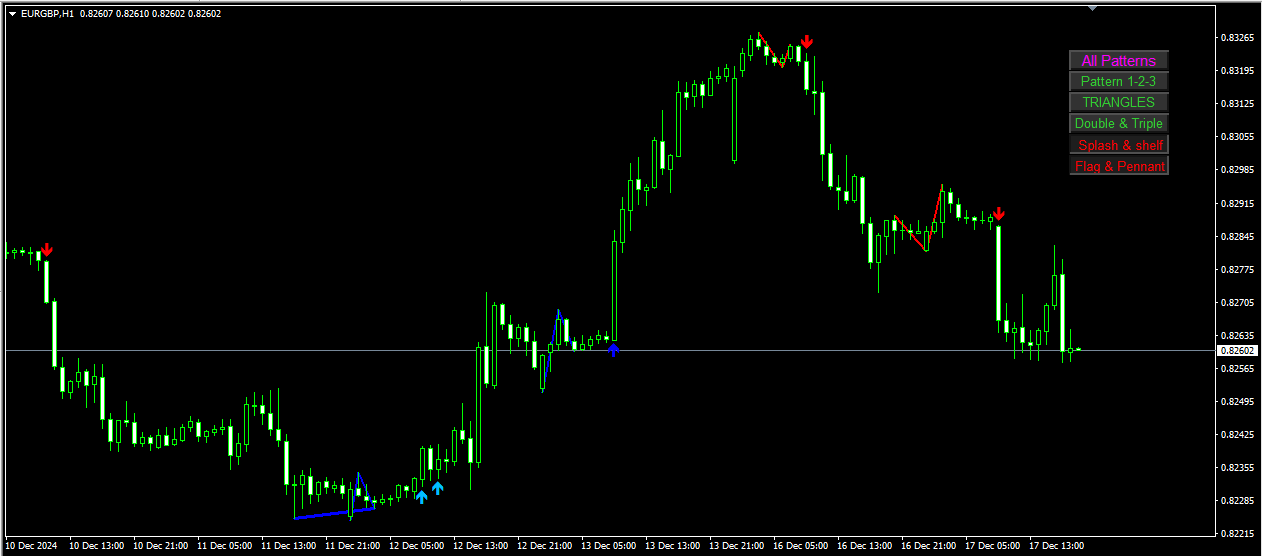
  • スプラッシュとシェルフ: 急激な価格変動(スプラッシュ)の後に統合フェーズ(シェルフ)が続き、ブレイクアウトの可能性を示します。

    • スプラッシュ: 急激な動き。
    • シェルフ: スプラッシュ後の統合。
    • 可視化: スプラッシュとシェルフパターンにトレンドラインを描画。
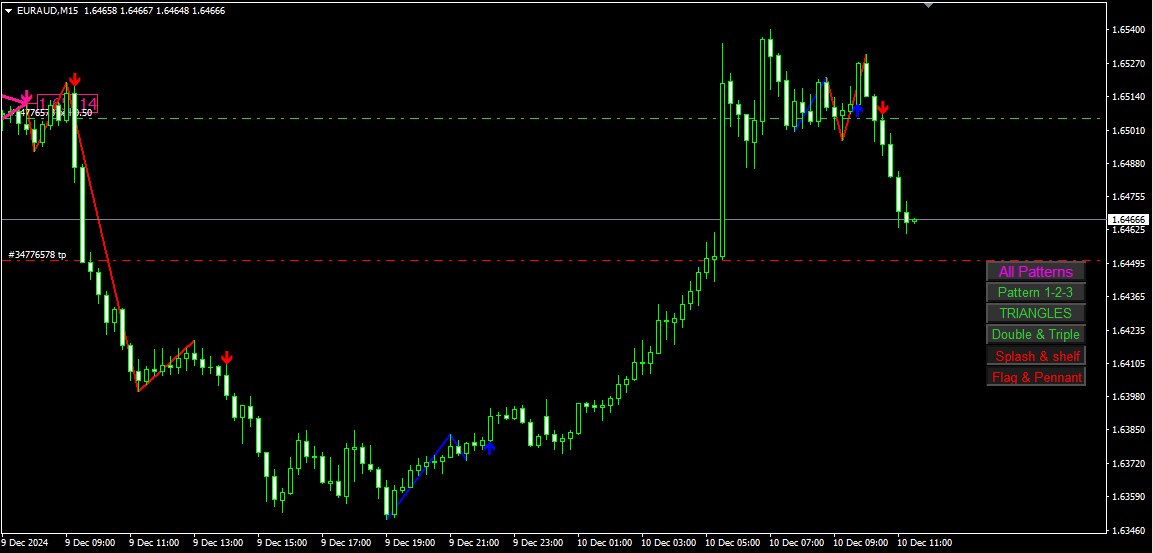
  • フラッグとペナント: トレンドが再開する前に短期間の一時停止を示す継続パターン。

    • ブルリッシュフラッグ: 上昇トレンドの継続。
    • ベアリッシュフラッグ: 下降トレンドの継続。
    • ペナント: 小さな対称三角形を形成する継続パターン。
    • 可視化: パターンと突破点を示す形状と矢印。

機能:

  • パターンのオン/オフ切り替え: チャート上のボタンで特定のパターンを簡単に有効または無効にできます。
  • カスタマイズ可能な設定: 色、線の幅、パターン固有の設定を調整できます。
  • アラートと通知: パターンが検出された際にアラートを設定できます。

可視化:

  • 線と矢印: パターンを明確に視覚化します。
  • インタラクティブボタン: チャート上でパターンの可視性を切り替えることができます。

このオールインワンインジケーターは、複数のチャートパターンの分析を簡略化し、MT4 ユーザーに柔軟でカスタマイズ可能なツールを提供します。

レビュー 23
Lasse Michael Holm
1604
Lasse Michael Holm 2025.02.16 12:10 
 

It is a very accurate indicator. I really love it!!

Erwin Fonke
499
Erwin Fonke 2025.02.11 12:25 
 

i am only using the triangle signals of this indicator which are 90% accurate and are always winners. After my rent is over i will buy it

optioneer7
154
optioneer7 2025.01.10 15:57 
 

I dont like writing Reviews , this Time I HAVE to = During NFP when 99% of all fukkin indicators FAIL - - - NOT this ONE ! I made mucho2 $$$ + Davit ist da Best = https://www.forexfactory.com/attachment/image/4876627?d=1736694710

________ da NFP + FOMC [ google it ] ist da Most Feared Economics events , FEARED by REAL Time FX_Traders 4sure !

https://www.mql5.com/en/market/product/120552?source=Site+Profile#!tab=comments&comment=55655536&page=6

おすすめのプロダクト
「Auto FIBO Pro」Crypto_Forex インジケーターは、取引の補助ツールとして最適です。 - インジケーターは、フィボナッチ レベルとローカル トレンド ライン (赤色) を自動的に計算してチャート上に配置します。 - フィボナッチ レベルは、価格が反転する可能性のある重要な領域を示します。 - 最も重要なレベルは、23.6%、38.2%、50%、61.8% です。 - リバーサル スキャルピングやゾーン グリッド取引に使用できます。 - Auto FIBO Pro インジケーターを使用して、現在のシステムを改善する機会も多数あります。 - Info Spread Swap Display があり、接続されている外国為替ペアの現在のスプレッドとスワップを表示します。 - ディスプレイには、アカウントの残高、エクイティ、マージンも表示されます。 - Info Spread Swap Display は、チャートのどのコーナーにも配置できます。 0 - 左上コーナー、1 - 右上、2 - 左下、3 - 右下。 高品質のトレーディングロボットとインジケーターをご覧にな
Super Reversal Pattern Indicator Unlock the power of advanced pattern recognition with our Super Reversal Pattern Indicator. Designed for traders seeking precision and reliability, this indicator identifies one of the most effective reversal patterns in technical analysis, offering a significant edge in your trading strategy. Key Features: Non-Repainting Accuracy: Enjoy the confidence of non-repainting technology. Once a Super Reversal Pattern is detected, it remains static, providing consiste
This is a trend indicator without redrawing Developed instead of the binary options strategy (by the color of the Martingale candlestick) Also works well in forex trading When to open trades (binary options) A signal will appear in the place with a candle signaling the current candle It is recommended to open a deal for one candle of the current timeframe M1 and M5 When a blue dot appears, open a deal up When a red dot appears, open a trade down. How to open trades on Forex. When a signal is rec
これは、キャンドルの終値を予測する指標です。 このインジケータは、主にD1チャートでの使用を目的としていますが. この指標は、従来の外国為替取引とバイナリオプション取引の両方に適しています。 インジケーターは、スタンドアロンのトレーディングシステムとして使用することも、既存のトレーディングシステムへの追加として機能させることもできます。 このインジケーターは、現在のキャンドルを分析し、キャンドル自体の内部の特定の強度係数と、前のキャンドルのパラメーターを計算します。 したがって、この指標は、市場の動きのさらなる方向性と現在のキャンドルの終値を予測します。 この方法のおかげで、この指標は、短期の日中取引だけでなく、中期および長期の取引にも適しています。 インジケーターを使用すると、市場の状況の分析中にインジケーターが生成する潜在的な信号の数を設定できます。 インジケーターの設定には、このための特別なパラメーターがあります。 また、インジケーターは、チャート上のメッセージの形式で、電子メールで、およびPUSH通知の形式で、新しい信号について通知することができます。 購入後は必ず私に書いて
VR Cub
Vladimir Pastushak
VR Cub は、質の高いエントリーポイントを獲得するためのインジケーターです。このインジケーターは、数学的計算を容易にし、ポジションへのエントリーポイントの検索を簡素化するために開発されました。このインジケーターが作成されたトレーディング戦略は、長年にわたってその有効性が証明されてきました。取引戦略のシンプルさはその大きな利点であり、初心者のトレーダーでもうまく取引することができます。 VR Cub はポジション開始ポイントとテイクプロフィットとストップロスのターゲットレベルを計算し、効率と使いやすさを大幅に向上させます。取引の簡単なルールを理解するには、以下の戦略を使用した取引のスクリーンショットを見てください。 設定、設定ファイル、デモ版、説明書、問題解決方法は、以下から入手できます。 [ブログ] レビューを読んだり書いたりすることができます。 [リンク] のバージョン [MetaTrader 5] エントリーポイントの計算ルール ポジションをオープンする エントリーポイントを計算するには、VR Cub ツールを最後の高値から最後の安値までストレッチする必要があります。 最初
Binary Options Support Resistance Indicator This indicator is designed for binary options trading and effectively shows retracements from support and resistance levels. Signals appear on the current candle. A red arrow pointing downwards indicates a potential selling opportunity, while a blue arrow pointing upwards suggests buying opportunities. All that needs adjustment is the color of the signal arrows. It is recommended to use it on the M1-M5 timeframes as signals are frequent on these timef
Alpha Trend signは私たちの取引システムを検証し、取引信号を明確に提示し、信号がドリフトすることはありません。 主な機能: •市場が活況を示している地域に応じて、指標に基づいて現在の相場がトレンド相場に属しているか、それとも揺れ相場に属しているかを直感的に判断することができる。 そして、指標の指示矢印に基づいて市場に切り込み、緑の矢印は購入を提示し、赤の矢印は販売を提示する。 •小周期変動による頻繁な取引信号の発生を回避するために、5分以上の時間周期で取引を行うことを推奨します。 •最適な取引タイミングを逃さないために、シグナルプロンプトをオンにすることもできます。 •本指標はトレンド相場をよく予測するだけでなく、幅広振動相場でも利益を得ることができる。 •本指標は大道至簡の原則に基づいており、異なる段階のトレーダーが使用するのに適している。 注意事項: •Alpha Trend signには明確な入退場信号があり、損失を与えないように逆位相操作を提案しない。 •Alpha Trend signは特に成熟した指標であり、デルのチー
トレンドオシレーターは、高度なカスタム Crypto_Forex インジケーター、効率的な取引ツールです! - 高度な新しい計算方法を使用 - パラメーター「計算価格」のオプションは 20 種類。 - これまで開発された中で最もスムーズなオシレーター。 - 上昇トレンドの場合は緑色、下降トレンドの場合は赤色。 - 売られすぎの値: 5 未満、買われすぎの値: 95 以上。 - このインジケーターを使用すると、標準戦略をアップグレードする機会が十分にあります。 - PC およびモバイルアラート付き。 高品質のトレーディングロボットとインジケーターをご覧になるにはここをクリックしてください! これは、この MQL5 Web サイトでのみ提供されるオリジナル製品です。
"Impulses and Corrections 4" is created to help traders navigate the market situation. The indicator shows multi-time frame upward and downward "Impulses" of price movements. These impulses are the basis for determining the "Base" , which is composed of zones of corrections of price movements, as well as "Potential" zones for possible scenarios of price movement. Up and down impulses are determined based on a modified formula of Bill Williams' "Fractals" indicator. The last impulse is always "U
Rainbow Price Visualizer v1.21 See where the market really breathes. Turns your MT4 chart into an ultra-precise heatmap that highlights price zones favored by big players. Why it matters 300 price levels at 0.2‑pip resolution — microscopic detail. 8 visual themes (Rainbow, Fire, Ocean…) for instant readibility. Smart opacity: low noise fades, real zones pop. Lightweight rendering with automatic cleanup. Fully customizable: saturation, opacity, resolution, history depth. Bands project into the f
Crypto_Forex MT4用インジケーター「 RSI SPEED 」は、優れた予測ツールで、リペイント機能はありません。 - このインジケーターの計算は物理学の方程式に基づいています。RSI SPEEDはRSI自体の1次導関数です。 - RSI SPEEDは、主要トレンドの方向にスキャルピングエントリーするのに適しています。 - 適切なトレンドインジケーター(例えばHTF MA(画像参照)など)と組み合わせて使用​​してください。 - RSI SPEEDインジケーターは、R​​SI自体がどれだけ速く方向転換するかを示します。非常に敏感です。 - モメンタムトレード戦略にはRSI SPEEDインジケーターの使用をお勧めします。RSI SPEEDインジケーターの値が0未満の場合は価格モメンタムが下降し、RSI SPEEDインジケーターの値が0を超える場合は価格モメンタムが上昇します。 - インジケーターにはモバイルとPCのアラートが組み込まれています。 高品質のトレーディングロボットとインジケーターをご覧になるにはここをクリックしてください! これは、このMQL5ウェブサイトで
Crypto_Forex MT4 用インジケーター「モーニング スター パターン」 - インジケーター「モーニング スター パターン」は、プライス アクション トレーディングに非常に強力なインジケーターです。再描画なし、遅延なし。 - インジケーターは、チャート上で強気のモーニング スター パターンを検出します。チャート上の青い矢印信号 (画像を参照)。 - PC、モバイル、および電子メール アラート付き。 - また、その兄弟である弱気の「イブニング スター パターン」インジケーターも利用できます (以下のリンクに従ってください)。 - インジケーター「モーニング スター パターン」は、サポート/レジスタンス レベルと組み合わせるのに最適です。 高品質のトレーディングロボットとインジケーターをご覧になるにはここをクリックしてください! これは、この MQL5 Web サイトでのみ提供されるオリジナル製品です。
Price Magnet — Price Density and Attraction Levels Indicator Price Magnet is a professional analytical tool designed to identify key support and resistance levels based on statistical Price Density. The indicator analyzes a specified historical period and detects price levels where the market spent the most time. These zones act as “magnets,” attracting price action or forming a structural base for potential reversals. Unlike traditional Volume Profile tools, Price Magnet focuses on price-time d
[ZhiBiCCI]インディケータは全てのサイクル使用に適しており、そして全ての市場品種にも適しています。 [ZhiBiCCI]緑色の実線は強気の発散の逆転です。緑色の点線は古典的な強気の発散です。 [ZhiBiCCI]赤への実線は逆弱気の発散である。赤い点線は古典的な弱気の発散です。 [ZhiBiCCI]はパラメータ(アラート、メール送信、通知送信)で設定でき、(true)に設定するとインスタント信号をアラームウィンドウに送信し、Eメール、インスタントメッセージを送信できます。 パラメータ設定の説明 [displayAlert]:これはアラームスイッチで、trueに設定され、矢印が表示されればプロンプトに自動的に警告され、falseに設定されれば警告されません。 [sendmail_NO_OFF]:これはメールを送信するためのスイッチで、trueに設定します。矢印が表示されていればMT4で設定したメールボックスにメールを送信し、falseに設定されていればメールを送信しません。 [sendnotification_NO_OFF]:これはインスタントメッセージを送信するた
まず第一に、この取引インジケーターは再描画されず、再描画されず、遅延しないことを強調する価値があります。これにより、手動取引とロボット取引の両方に理想的なものになります。 ユーザーマニュアル:設定、入力、戦略。 アトミックアナリストは、価格の強さとモメンタムを利用して市場でより良いエッジを見つけるためのPA価格アクションインジケーターです。ノイズや誤ったシグナルを除去し、取引ポテンシャルを高めるための高度なフィルターを備えています。複雑なインジケーターの複数のレイヤーを使用して、アトミックアナリストはチャートをスキャンし、複雑な数学的計算をシンプルなシグナルと色に変換します。これにより、どのような初心者トレーダーでも理解して使用し、一貫した取引の決定を行うことができます。 「アトミックアナリスト」は、新規および経験豊富なトレーダー向けにカスタマイズされた包括的な取引ソリューションです。プレミアムインジケーターとトップノッチの機能を1つの取引戦略に組み合わせ、すべてのタイプのトレーダーにとって汎用性のある選択肢にします。 デイリートレーディングとスキャルピング戦略:高速で正確な
The indicator displays the data of the Stochastic oscillator from a higher timeframe on the chart. The main and signal lines are displayed in a separate window. The stepped response is not smoothed. The indicator is useful for practicing "manual" forex trading strategies, which use the data from several screens with different timeframes of a single symbol. The indicator uses the settings that are identical to the standard ones, and a drop-down list for selecting the timeframe. Indicator Paramet
Chart Patterns Detect 15 patterns (Ascending Triangle, Descending Triangle, Rising Wedge, Falling Wedge, Bullish Flag, Bearish Flag, Bullish Rectangle, Bearish Rectangle Symmetrical triangle, Head and Shoulders, Inverted Head and Shoulders, Triple top, Triple Bottom, Double Top, Double Bottom) Use historical data to calculate the probability of each pattern to succeed (possibility to filter notification according to the chance of success) gives graphic indication about the invalidation level and
SMC Venom Model BPR インジケーターは、スマート マネー (SMC) コンセプトで取引するトレーダー向けのプロフェッショナル ツールです。価格チャート上の 2 つの主要なパターンを自動的に識別します。 FVG   (フェアバリューギャップ) は、3 本のローソク足の組み合わせで、最初のローソク足と 3 番目のローソク足の間にギャップがあります。ボリュームサポートのないレベル間のゾーンを形成し、価格修正につながることがよくあります。 BPR   (バランス価格範囲) は、2 つの FVG パターンの組み合わせで、「ブリッジ」を形成します。これは、価格がボリュームアクティビティの少ない動きで動くときに、ブレイクアウトしてレベルに戻るゾーンで、ローソク足の間にギャップを作成します。 これらのパターンは、大規模な市場プレーヤーと一般参加者の相互作用が発生するチャート上のボリュームと価格動向の分析に基づいて、トレーダーが主要なサポート/レジスタンス レベル、ブレイクアウト ゾーン、エントリ ポイントを識別するのに役立ちます。 インジケーターは、長方形と矢印の形でパターンを視
The perfect tool for Scalng in the Forex markets You can trade both from signal to signal and using take profit  The algorithm does not use Zigzag!  No redrawing!  This is a channel instrument that uses a moving average as a filter. Moving Average  There are 2 parameters for the settings Ma Period = 5 period Moving Average  Channel 1.0 distance of channel lines from the chart Price Signal Filter - calculation of signal opening and filter There is a complete set of Alert There is a multi-timefram
フィボナッチリトレースと拡張ラインツール DiNapoliポイント取引方法とゴールデンセクション取引を使用するトレーダーにとって理想的なMT4プラットフォームのフィボナッチリトレースと拡張ラインツール 主な特長: あなたはフィボナッチリトレースメントの複数のセットを直接描くことができ、重要なリターンポイント間の関係は一目瞭然です。 2.フィボナッチ拡張を描画することができます。 3.フィボナッチフォールドバックとラインの延長は、簡単な観察と数値表示のために左右に動かすことができます。 4.チャートは非常に爽やかな 5.数字キーでサイクルを切り替えることができます。 ファンクションキー: 1。 [戻るを押す、要求に応じて描画する、最大8つのグループにする 2。拡張]を描くには[押す] 3。 \を押すと、現在のサイクルの下にあるすべての拡張機能と折り畳みが削除されます 4。フォールドバックを移動して削除して展開する (1)最初のフォールドバックセットのF5行をクリックします。 一度クリックすると(黄色に変わります)、キーボードのDeleteキーを押すと、フォーカ
Trend Bilio - an arrow indicator without redrawing shows potential market entry points in the form of arrows of the corresponding color: upward red arrows suggest opening a buy, green down arrows - selling. The entrance is supposed to be at the next bar after the pointer. The arrow indicator Trend Bilio visually "unloads" the price chart and saves time for analysis: no signal - no deal, if an opposite signal appears, then the current deal should be closed. It is Trend Bilio that is considered
MT5 Version   Wave Trend MT4 Wave Trend is an oscillator, which helps identifing in a extremely accurate manner market reversals. The Oscillator being obove the overbought level and a cross down of the fast into the slow MA usually indicates a good SELL signal. If the oscillators is below the oversold level and the fast MA crosses over the slower MA usually highlights a good BUY signal. The Wave Trend indicator can be also used when divergences appear against the price, indicating the current mo
The Th3Eng PipFinite indicator is based on a very excellent analysis of the right trend direction with perfect custom algorithms. It show the true direction and the best point to start trading. With StopLoss point and Three Take Profit points. Also it show the right pivot of the price and small points to order to replace the dynamic support and resistance channel, Which surrounds the price. And Finally it draws a very helpful Box on the left side on the chart includes (take profits and Stop loss
"The trend is your friend" is one of the best known sayings in investing, because capturing large trendy price movements can be extremely profitable. However, trading with the trend is often easier said than done, because many indicators are based on price reversals not trends. These aren't very effective at identifying trendy periods, or predicting whether trends will continue. We developed the Trendiness Index to help address this problem by indicating the strength and direction of price trend
Insider Scalper Binary This tool is designed to trade binary options. for short temporary spends. to make a deal is worth the moment of receiving the signal and only 1 candle if it is m1 then only for a minute and so in accordance with the timeframe. for better results, you need to select well-volatile charts.... recommended currency pairs eur | usd, usd | jpy .... the indicator is already configured, you just have to add it to the chart and trade .... The indicator signals the next candle.
Noize Absorption Index - is the manual trading system that measures the difference of pressure between bears forces and bulls forces. Green line - is a noize free index that showing curent situation. Zero value of index shows totally choppy/flat market.Values above zero level shows how powerfull bullish wave is and values below zero measures bearish forces.Up arrow appears on bearish market when it's ready to reverse, dn arrow appears on weak bullish market, as a result of reverse expectation. S
「ダイナミック・スキャルピング・オシレーター」は、MT4向けの高度なカスタムCrypto_Forexインジケーターです。効率的な取引ツールです! - 新世代のオシレーター - 使い方は画像をご覧ください。 - ダイナミック・スキャルピング・オシレーターは、適応型の売られ過ぎ/買われ過ぎゾーンを備えています。 - オシレーターは、動的な売られ過ぎ/買われ過ぎエリアから正確なエントリーポイントを見つけるための補助ツールです。 - 売られ過ぎ値:グリーンラインより下、買われ過ぎ値:オレンジラインより上。 - このインジケーターは、プライスアクションパターンと組み合わせるのに最適です。 - 標準的なオシレーターよりもはるかに正確です。対応時間枠:M30、H1、H4、D1、W1。 - PCとモバイルの両方でアラート機能付き。 高品質のトレーディングロボットとインジケーターをご覧になるにはここをクリックしてください! これは、このMQL5ウェブサイトでのみ提供されるオリジナル製品です。
発見が困難で頻度が少ないため、分岐は最も信頼できる取引シナリオの1つです。このインジケーターは、お気に入りのオシレーターを使用して、通常の隠れた分岐点を自動的に見つけてスキャンします。 [ インストールガイド | 更新ガイド | トラブルシューティング | よくある質問 | すべての製品 ] 取引が簡単 通常の隠れた発散を見つけます 多くのよく知られている発振器をサポート ブレイクアウトに基づいて取引シグナルを実装します 適切なストップロスおよび利益レベルを表示します 設定可能なオシレーターパラメーター カスタマイズ可能な色とサイズ バー単位でサイズ別に分岐をフィルタリング パフォーマンス統計を実装します 電子メール/音声/視覚アラートを実装します 幅広い市場の見通しを提供するために、異なるオシレーターを使用して、干渉なしで同じチャートにインジケーターを何度もロードできます。このインジケーターは、次のオシレーターをサポートしています。 RSI CCI MACD オスマ 確率的 勢い 素晴らしい発振器 加速器発振器 ウィリアムズパーセントレンジ 相対活力指数 特に外国為替市場では、
Gvs Undefeated Trend   indicator is designed for trend and signal trading. This indicator generates trend signals.  It uses many algorithms and indicators to generate this signal. It tries to generate a signal from the points with the highest trend potential. This indicator is a complete trading product. This indicator does not need any additional indicators.  You can only trade with this indicator. The generated signals are displayed on the graphical screen.  Thanks to the alert features you ca
Power Renko is an indicator which plots Renko bricks underneath the chart using a histogram. You can select the brick size and the timeframe of the Renko bricks as well as whether or not to use the close price or the high/low price of the candles. Renko bricks are based on price alone, not time, therefor the Renko bricks will not be aligned with the chart's time. They are extremely useful for trend trading and many different strategies can be formed from them. Buffers are provided allowing you t
このプロダクトを購入した人は以下も購入しています
An exclusive indicator that utilizes an innovative algorithm to swiftly and accurately determine the market trend. The indicator automatically calculates opening, closing, and profit levels, providing detailed trading statistics. With these features, you can choose the most appropriate trading instrument for the current market conditions. Additionally, you can easily integrate your own arrow indicators into Scalper Inside Pro to quickly evaluate their statistics and profitability. Scalper Inside
「 Dynamic Scalper System 」インジケーターは、トレンド波の中でスキャルピング取引を行う手法のために設計されています。 主要通貨ペアと金でテスト済みで、他の取引商品との互換性があります。 トレンドに沿った短期的なポジションオープンのシグナルを提供し、追加の価格変動サポートも提供します。 インジケーターの原理 大きな矢印はトレンドの方向を決定します。 トレンド波の中では、小さな矢印の形でスキャルピングシグナルを生成するアルゴリズムが機能します。 赤い矢印は強気方向、青い矢印は弱気方向です。 トレンドの方向には敏感な価格変動ラインが描かれ、小さな矢印のシグナルと連動します。 シグナルは次のように機能します。適切なタイミングでラインが現れるとエントリーシグナルが形成され、ラインが開いている間はポジションが保持され、完了すると取引が終了します。 推奨される動作時間枠はM1~H4です。 矢印は現在のローソク足に形成され、次のローソク足が開いている場合は、前のローソク足の矢印は再描画されません。 入力パラメータ Trend Wave Period - トレンド方向
トレンドラインプロ   市場の真の方向転換点を理解するのに役立ちます。この指標は、真のトレンド反転と主要プレーヤーが再び参入するポイントを示します。 分かりますか     BOSライン   複雑な設定や不要なノイズなしに、より長い時間足でのトレンドの変化と重要なレベルを把握できます。シグナルは再描画されず、バーが閉じた後もチャート上に残ります。 VERSION MT 5     -     RFI LEVELS PRO インジケーター と組み合わせることで、その潜在能力を最大限に発揮します。 インジケーターが示す内容: 本当の変化   トレンド(BOSライン) 一度シグナルが現れたら、それは有効です!これは、リペイント機能を持つインジケーターとの重要な違いです。リペイント機能を持つインジケーターは、シグナルを発した後、それを変更し、資金の損失につながる可能性があります。これにより、より高い確率と精度で市場に参入できます。また、矢印が現れた後、目標値(利益確定)に達するか、反転シグナルが現れるまで、ローソク足の色を変更する機能もあります。 繰り返しエントリ       主要プレーヤーの
Volatility Trend System - a trading system that gives signals for entries. The volatility system gives linear and point signals in the direction of the trend, as well as signals to exit it, without redrawing and delays. The trend indicator monitors the direction of the medium-term trend, shows the direction and its change. The signal indicator is based on changes in volatility and shows market entries. The indicator is equipped with several types of alerts. Can be applied to various trading ins
Trend indicator AI
Ramil Minniakhmetov
4.49 (84)
Trend Ai indicatorは、トレンドの識別と実用的なエントリポイントと反転アラートを組み合わせることで、トレーダーの市場分析を強化する優れたツールです。 この指標は、ユーザーが自信と正確さで外国為替市場の複雑さをナビゲートすることを可能にします トレンドAiインジケーターは、主要なシグナル以外にも、プルバックやリトレースメント中に発生するセカンダリエントリポイントを識別し、トレーダーが確立されたトレンド内の価格修正を活用できるようにします。 重要な利点: *MT4およびMT5の仕事 *明確な買いまたは売りシグナル *再描画しません ·すべての資産で動作します 私はeaやセットをtelegram it詐欺で販売しないように注意してください。 すべての設定はここでブログで無料です。  重要! 指示とボーナスを得るために購入後すぐに私に連絡してください! 私の他のプロダクトと同様、実質操作の監視はここに見つけることができます: https://www.mql5.com/en/users/mechanic/seller&nbsp ; 設定および入力: すべての
まず第一に、この取引ツールはノンリペイント、ノンリドロー、ノンラグの指標であり、プロの取引に理想的ですことを強調する価値があります。 オンラインコース、ユーザーマニュアル、デモ。 スマートプライスアクションコンセプトインジケーターは、新米から経験豊富なトレーダーまで、非常 に強力なツールです。Inner Circle Trader AnalysisやSmart Money Concepts Trading Strategiesなど、20以上の有用な指標を1つに組み合わせています。このインジケーターはスマートマネーコンセプトに焦点を当て、大手機関の取引方法を提供し、彼らの動きを予測するのに役立ちます。 特に、流動性分析に優れており、機関がどのように取引しているかを理解しやすくしています。市場のトレンドを予測し、価格の動きを慎重に分析するのに優れています。機関の戦略とトレードを合わせることで、市場の動向についてより正確な予測ができます。このインジケーターは多目的であり、市場構造を分析し、重要な注文ブロックを特定し、さまざまなパターンを認識するのに優れています。 このインジケーターは
チャートを構成し、周期的な価格変動を識別するテクニカル指標。 どのチャートでも動作します。 いくつかの種類の通知。 グラフ自体に追加の矢印があります。 履歴を再描画せずに、キャンドルのクローズに取り組みます。 M5以上のTFを推奨します。 パラメータの使用と設定が簡単です。 異なるパラメータを持つ 2 つのインジケーターを使用する場合、他のインジケーターなしで使用できます。 入力パラメータは2つあります 周期性と信号持続時間 これら 2 つのパラメータは、チャート構造の処理を扱います。 Cyclicity - 反転サイクルが変化する頻度を調整し、サイクルを滑らかにします。 Signal duration - 最小数では価格変動の衝動を検出し、最大数では長期的なトレンドの動きを検出します。
このインジケーターは、反転ポイントと価格戻りゾーンを正確に表示します。     主要プレーヤー 。新たなトレンドが形成される場所を把握し、最大限の精度で意思決定を行い、すべての取引をコントロールします。 TREND LINES PRO インジケーターと組み合わせることで、その潜在能力を最大限に発揮します。 VERSION MT5 インジケーターが示す内容: 新しいトレンドの始まりに活性化する反転構造と反転レベル。 リスクと報酬の比率を最小限に抑えた利益 確定 と 損失停止の レベルの表示     RR 1:2   。 インテリジェントな削減ロジックによるストップロス。 指定されたインジケーターから 2 つのトレンド タイプの反転パターンを表示します。 指標: トレンドを追う   TREND LINES PRO   (世界的なトレンドの変化) TREND PRO   (クイックトレンド変更) シンプルで効果的   スキャナー   リアルタイムトレンド(新機能)。 マルチタイムフレームのインストゥルメント フィルタリング。 画面   利益     LOGIC AI信号の後。 当日プラス方
現在20%OFF! 初心者やエキスパートトレーダーに最適なソリューションです。 このインディケータは、エキゾチックペア・コモディティ・インデックス・先物など、あらゆるシンボルの通貨の強さを表示することに特化したインディケータです。金、銀、原油、DAX、US30、MXN、TRY、CNHなどの通貨の強さを表示するために、9行目にどのシンボルでも追加することができます。独自の機能を多数搭載し、新しい計算式を採用したため、ユニークで高品質、かつ手頃な価格のトレーディングツールとなっています。新しいトレンドやスキャルピングチャンスのトリガーポイントを正確に把握することができるため、あなたのトレードがどのように改善されるか想像してみてください。 ユーザーマニュアル:ここをクリック   https://www.mql5.com/en/blogs/post/708876 すべての時間枠に対応します。あなたはすぐにトレンドを見ることができるようになります! 新しいアルゴリズムに基づいて設計されているため、潜在的な取引の特定と確認がより簡単になります。これは、8つの主要通貨と1つのシンボルの強弱
Dynamic Forex28 Navigator - 次世代の Forex 取引ツール。 現在 49% オフ。 Dynamic Forex28 Navigator は、長年人気のインジケーターを進化させたもので、3 つの機能を 1 つにまとめています。 Advanced Currency Strength28 インジケーター (レビュー 695 件)  + Advanced Currency IMPULSE with ALERT (レビュー 520 件) + CS28 コンボ シグナル (ボーナス)。 インジケーターの詳細 https://www.mql5.com/en/blogs/post/758844 次世代の Strength インジケーターが提供するもの  オリジナルで気に入っていたすべての機能が、新機能と精度の向上によって強化されました。 主な機能: 独自の通貨強度計算式。 すべての時間枠でスムーズかつ正確な強度ライン。 トレンドの特定と正確なエントリーに最適です。 ダイナミックマーケットフィボナッチレベル (マーケットフィボナッチ)。 このインジケーターに固有
Advanced Supply Demand
Bernhard Schweigert
4.91 (299)
現在40%オフ 初心者にもエキスパートトレーダーにも最適なソリューション このインジケーターは独自の機能と新しい公式を多数内蔵しており、ユニークで高品質かつ手頃な取引ツールです。このアップデートでは、2つの時間枠ゾーンを表示できるようになります。より長いTFだけでなく、チャートTFとより長いTF(ネストゾーンを表示)の両方を表示できます。すべてのSupply Demandトレーダーの皆さんのお気に召すはずです。:) 重要情報の公開 Advanced Supply Demandの可能性を最大化するには、 https://www.mql5.com/ja/blogs/post/720245 にアクセスしてください。   エントリーまたはターゲットの正確なトリガーポイントを正確に特定できれば取引がどのように改善されるか想像してみてください。新しい基盤となるアルゴリズムに基づいて構築されているため、買い手と売り手の間の潜在的な不均衡をさらに簡単に特定できます。これは、最も強い需要と供給のゾーンと、過去のパフォーマンス(古いゾーンを表示)がグラフィカルに表現されるためです。これらの機能は、最適な
このインジケーターを購入すると、プロ仕様のトレードマネージャーを無料で差し上げます。 まず第一に、このトレーディングシステムがノンリペイント、ノンリドロー、ノンラグのインジケーターであることを強調する価値がある。これにより、手動取引とロボット取引の両方に理想的なものになっています。 オンラインコース、マニュアル、プリセットのダウンロード。 「スマートトレンドトレーディングシステム MT5」は、新規および経験豊富なトレーダー向けにカスタマイズされた包括的なトレーディングソリューションです。10以上のプレミアムインジケーターを組み合わせ、7つ以上の堅実なトレーディング戦略を備えており、多様な市場状況に対応する多目的な選択肢となっています。 トレンドフォロー戦略:トレンドを効果的に乗り越えるための正確なエントリーとストップロス管理を提供します。 リバーサル戦略:潜在的なトレンドの反転を特定し、トレーダーがレンジ相場を活用できるようにします。 スキャルピング戦略:高速で正確なデイトレードおよび短期取引のために設計されています。 安定性:すべてのインジケーターはノンリペイント、ノンリドロー、ノ
Super Reversal Indicator with Alert 概要 Super Reversal Indicator with Alert は、マルチタイムフレーム分析を用いて高確率の相場反転ポイントを特定するためのトレーディングツールです。ストキャスティクスのモメンタム、需給ゾーン、そして価格のリジェクションシグナルを組み合わせて分析を行います。 本インジケーターは、明確な視覚シグナルとリアルタイムアラートにより、トレーダーが市場の転換点を見極めるのをサポートします。 主な機能 マルチタイムフレーム ストキャスティクス分析 上位時間足のストキャスティクスを使用(ユーザー設定可能) モメンタムの変化やクロスシグナルを検出 エントリー精度を高めるための買われ過ぎ・売られ過ぎレベルを表示 反転リジェクションシグナル 重要な価格帯での強いリジェクションローソク足を検出 以下のポイントでの反転を識別 日足高値での売り反転 日足安値での買い反転 視認性を高めるため、チャート上に矢印を表示 需給ゾーン(Supply and Demand) H4およびD1の上位時間足から重要なゾーンを自動
The Super Arrow Indicator provides non-repainting buy and sell signals with exceptional accuracy. Key Features No repainting – confirmed signals remain fixed Clear visual arrows: green for buy, red for sell Real-time alerts via pop-up, sound, and optional email Clean chart view with no unnecessary clutter Works on all markets: Forex, gold, oil, indices, crypto Adjustable Parameters TimeFrame Default: "current time frame" Function: Sets the time frame for indicator calculation Options: Can be set
通貨強さウィザードは、取引を成功させるためのオールインワン ソリューションを提供する非常に強力な指標です。このインジケーターは、複数の時間枠のすべての通貨のデータを使用して、このまたはその外国為替ペアのパワーを計算します。このデータは、使いやすい通貨インデックスと通貨パワーラインの形式で表され、特定の通貨のパワーを確認するために使用できます。 必要なのは、取引したいチャートにインジケーターを接続することだけです。インジケーターは、取引する通貨の実際の強さを示します。このインジケーターは、トレンドに合わせて取引するときに有利に利用できる売買高の圧力の極値も示します。このインジケーターには、フィボナッチに基づく可能なターゲットも表示されます。 このインジケーターは、PUSH 通知を含むあらゆるタイプのアラートを提供します。 購入後ご連絡下さい。私の取引のヒントをあなたと共有し、素晴らしいボーナスインジケーターを無料で提供します! 幸せで有益な取引をお祈りします。
CRT Multi-Timeframe Market Structure & Liquidity Sweep Indicator Non-Repainting | Multi-Asset | MT5 Version Available MT5 Version:   https://www.mql5.com/en/market/product/162075 Full User Guide — explains what each feature does and why:   https://www.mql5.com/en/blogs/post/767525 Quick Start User Guide  — explains how to configure and in what order:  https://www.mql5.com/en/blogs/post/767540 Indicator Overview CRT Ghost Candle HTF Fractal is a complete institutional-grade market structure too
Scalping Entry Points - is a manual trading system that can adjust to price movements and give signals to open trades without redrawing. The indicator determines the direction of the trend by the central level of support and resistance. The dot indicator provides signals for entries and exits.  Suitable for manual intraday trading, scalping and binary options. Works on all time frames and trading instruments. The indicator gives several types of alerts. How to use the product The blue line det
説明書(ロシア語)  /  説明書 (英語)  /  バージョン MT5 主な機能: 売り手と買い手のアクティブなゾーンを表示します。 このインジケーターは、買いと売りの適切な最初のインパルスレベル/ゾーンをすべて表示します。これらのレベル/ゾーンがアクティブになると、エントリーポイントの探索が始まり、レベルの色が変わり、特定の色で塗りつぶされます。状況をより直感的に把握できるように、矢印も表示されます。 LOGIC AI - テンプレートをアクティブ化するときにエントリポイントを検索するためのゾーン(円)の表示 視認性を向上させるため、人工知能を用いて進入ポイントを探索したゾーンを表示する機能が追加されました。 より高い時間枠からのレベル/ゾーンの表示(MTFモード) より長い時間間隔でレベル/ゾーンを表示する機能を追加しました。また、インジケーターに自動トレンド検出機能(   TPSproTREND PRO   )を実装しました。 取引のための個別の専門的なステップバイステップのアルゴリズム このアルゴリズムは、トレンドの方向と逆方向の両方でデイトレードを行うために設計されていま
BTMM State Engine Pro is a MetaTrader 4 indicator for traders who use the Beat The Market Maker approach: Asian session context, kill zone timing, level progression, peak formation detection, and a multi-pair scanner from a single chart. It combines cycle state logic with a built-in scanner dashboard so you do not need the same tool on many charts at once. What it does Draws the Asian session range; session times can follow broker server offset or be set in inputs. Tracks level progression (L
Looking for a powerful yet lightweight swing detector that accurately identifies market structure turning points? Want clear, reliable buy and sell signals that work across any timeframe and any instrument? Buy Sell Arrow MT Swing is built exactly for that — precision swing detection made simple and effective. This indicator identifies Higher Highs (HH) , Higher Lows (HL) , Lower Highs (LH) , and Lower Lows (LL) with remarkable clarity. It is designed to help traders easily visualize market stru
Meravith
Ivan Stefanov
5 (3)
マーケットメーカーのためのツール。 Meravith は次の機能を提供します: すべての時間足を分析し、現在有効なトレンドを表示します。 強気と弱気の出来高が等しくなる流動性ゾーン(出来高均衡)を強調表示します。 異なる時間足のすべての流動性レベルをチャート上に直接表示します。 テキスト形式の市場分析を生成し、参考情報として表示します。 現在のトレンドに基づいて目標値、サポートレベル、ストップロスを計算します。 取引のリスクリワード比を算出します。 口座残高に基づいてポジションサイズを計算し、潜在的な利益を推定します。 また、市場に大きな変化があった場合には警告を表示します。 インジケーターの主要ライン: 強気/弱気の出来高エグゾーストライン ― 目標値として機能します。 市場のトレンドを示すライン。市場が強気か弱気かによって色が変わり、トレンドのサポートとして機能します。主にその色が市場センチメントを示します。 出来高均衡ライン(Eq)。Eq(Volume Equilibrium)ラインはシステムの中核です。これは買い手と売り手の出来高のバランスポイントを表します。市場の流動性を示し
現在40%OFF! 初心者やエキスパートトレーダーのためのベストソリューション! このダッシュボードソフトウェアは、28の通貨ペアで動作しています。それは私達の主要な指標(高度な通貨の強さ28と高度な通貨インパルス)の2に基づいています。それは全体の外国為替市場の大きい概観を与えます。それは、すべての(9)時間枠で28の外国為替ペアのための高度な通貨の強さの値、通貨の動きの速度と信号を示しています。チャート上で1つのインディケータを使用して市場全体を観察し、トレンドやスキャルピングの機会をピンポイントで見つけることができたら、あなたのトレードがどのように改善されるか想像してみてください。 このインディケータには、強い通貨と弱い通貨の識別、潜在的な取引の識別と確認がより簡単になるような機能が搭載されています。このインディケータは、通貨の強さや弱さが増加しているか減少しているか、また、すべての時間枠でどのように機能しているかをグラフィカルに表示します。 新機能として、現在の市場環境の変化に適応するダイナミックなマーケットフィボナッチレベルが追加され、すでに当社のAdvanced
Advanced version of CyberZingFx Volume Plus, the ultimate MT4 indicator for traders seeking highly accurate buy and sell signals. With an additional strategy and price action dot signals that enhances its effectiveness, this indicator offers a superior trading experience for professionals and beginners alike. The CyberZingFx Volume Plus Advanced version combines the power of volume analysis and historical price data with an additional strategy, resulting in even more precise and reliable signals
Matrix Arrow Indicator MT4
Juvenille Emperor Limited
5 (3)
マトリックスアローインジケーターMT4は、すべてのシンボル/商品(外国為替、商品、暗号通貨、インデックス、株式)で使用できる100%再描画されていないマルチタイムフレームインジケーターに続くユニークな10in1トレンドです。マトリックスアローインジケーターMT4は、初期段階で現在のトレンドを判断し、最大10の標準インジケーターから情報とデータを収集します。 平均方向移動指数(ADX) 商品チャネルインデックス(CCI) クラシック平研アシキャンドル 移動平均 移動平均収束発散(MACD) 相対活力指数(RVI) 相対力指数(RSI) 放物線SAR ストキャスティクス ウィリアムズのパーセント範囲 すべてのインジケーターが有効な買いまたは売りシグナルを与えると、対応する矢印がチャートに印刷され、次のろうそく/バーの開始時に強い上昇トレンド/下降トレンドを示します。ユーザーは、使用するインジケーターを選択し、各インジケーターのパラメーターを個別に調整できます。マトリックスアローインジケーターMT4は選択されたインディケーターからのみ情報を収集し、それらのデータのみに基づいてアローを印刷
GOLD Impulse with Alert
Bernhard Schweigert
4.67 (12)
このインディケータは、当社の2つの製品 Advanced Currency IMPULSE with ALERT  +   Currency Strength Exotics . のスーパーコンビネーションです。 このインジケーターは全ての時間枠で作動し、8つの主要通貨と1つのシンボルの強弱のインパルスをグラフで表示します。 このインジケータは、金、エキゾチックペア、商品、インデックス、先物など、あらゆるシンボルの通貨強度の加速度を表示することに特化されています。金、銀、原油、DAX、US30、MXN、TRY、CNHなどの通貨強度の加速度(インパルスまたは速度)を表示するために、任意のシンボルを9行目に追加できる、この種の最初のものです。 新しいアルゴリズムに基づいて構築され、潜在的な取引の特定と確認がさらに容易になりました。これは、通貨の強さや弱さが加速しているかどうかをグラフィカルに表示し、その加速の速度を測定するためです。加速すると物事は明らかに速く進みますが、これはFX市場でも同じです。つまり、反対方向に加速している通貨をペアリングすれば、潜在的に利益を生む取引を特定
FX Power: 通貨の強弱を分析して、より賢い取引を実現 概要 FX Power は主要通貨と金の実際の強弱をあらゆる市場状況で理解するための必須ツールです。強い通貨を買い、弱い通貨を売ることで、 FX Power は取引の意思決定を簡素化し、高い確率の取引機会を見出します。トレンドを追従する場合でも、極端なデルタ値を使用して反転を予測する場合でも、このツールはあなたの取引スタイルに完全に適応します。ただ取引するだけではなく、 FX Power で賢く取引をしましょう。 1. なぜ FX Power がトレーダーにとって非常に有益なのか 通貨と金のリアルタイム強弱分析 • FX Power は主要通貨と金の相対的な強弱を計算し、マーケットダイナミクスに関する明確な洞察を提供します。 • どの資産がリードしているか、または後れを取っているかを監視して、取引するペアを賢く選びましょう。 マルチタイムフレームの包括的なビュー • 短期、中期、長期のタイムフレームで通貨と金の強弱を追跡し、マーケットトレンドに基づいて取引戦略を調整できます。 • スキャルピングからスイングトレード
Cumulative Delta Pro is a professional indicator that takes market order flow analysis to a fundamentally new level. Cumulative Delta is the difference between buying and selling volumes, presented as a continuous cumulative sum over a specific period of time starting from the initial calculation point. This metric allows traders to see in real time who controls the market: if the positive delta increases, it indicates the dominance of active buyers; if the negative delta decreases, sellers are
現在40%オフ 初心者やエキスパートトレーダーに最適なソリューション! このインジケーターは、独自の機能と新しい計算式を取り入れた、ユニークで高品質、かつ手頃な価格のトレーディングツールです。たった1枚のチャートで28の為替ペアの通貨強度を読み取ることができます。新しいトレンドやスキャルピングチャンスの引き金となるポイントを正確に特定することができるので、あなたのトレードがどのように改善されるか想像してみてください。 ユーザーマニュアルはこちら  https://www.mql5.com/en/blogs/post/697384 これが最初の1本、オリジナルだ! 価値のないクローンを買わないでください。 特別な サブウィンドウの矢印で強い通貨の勢いを表示 GAPがあなたのトレードを導く! 基準通貨や気配値が売られすぎ・買われすぎのゾーン(外相フィボナッチレベル)にあるとき、個別チャートのメインウィンドウに警告表示。 通貨がレンジの外側から反落した場合、プルバック/リバーサルのアラート。 クロスパターンの特別なアラート 複数の時間枠を選択可能で、トレンドを素早く確認できます
Trend Screener
STE S.S.COMPANY
4.79 (95)
トレンドインジケーター、1つのツールに組み込まれたすべての重要なトレンド機能を備えたトレンドトレーディングとフィルタリングのための画期的なユニークなソリューション! これは、すべてのシンボル/商品(外国為替、商品、暗号通貨、インデックス、株式)で使用できる100%再描画されていないマルチタイムフレームおよびマルチ通貨インジケーターです。 期間限定オファー: サポートおよびレジスタンス スクリーナー インジケーターは、たった 50 ドルで永久的にご利用いただけます。(元の価格 250 ドル) (オファー延長) トレンドスクリーナーは、チャート内のドットで矢印トレンドシグナルを提供するインジケーターに続く効率的なインジケーターです。 トレンド分析インジケーターで使用できる機能: 1.トレンドスキャナー。 2.最大利益分析を備えたトレンドライン。 3.トレンド通貨強度メーター。 4.アラート付きのトレンド反転ドット。 5.アラート付きの強いトレンドドット。 6.トレンド矢印 毎日の分析例、毎日のシグナルパフォーマンス...など、トレンドスクリーナーインジケーターを使用して、ここで見つけること
「 Wave Cycle Channel 」インジケーターは、サイクリック・オシレーターとサポート・レジスタンス・チャネルを用いて価格の方向性を計算します。 価格変動の転換点を見つけ出し、反転の可能性のあるポイントを特定することで、市場がどちらの方向に動いているかを示します。 反転ポイントの特定やエントリーシグナルの検出に使用できます。 インジケーターの仕組み オシレーターの波動線は価格変動に合わせて調整され、市場のボラティリティと入力パラメータで指定された「 Oscillator Period 」に基づいて構築されます。 チャネルはオシレーターの周囲を移動し、オシレーターの値を平滑化します。 オシレーターがチャネルの上限または下限に触れると、サポート/レジスタンスの動きが強まり、価格反転の可能性も高まります。 大きな矢印が描画され、赤い矢印は上昇反転のシグナル、緑の矢印は下降反転のシグナルです。 反転中にオシレーターがチャネルに触れなかった場合、以前に設定されたシグナルの動きが継続されます。小さな矢印が描画されます。 すべてのシグナル矢印が表示された後、シグナルアクションポイントが
作者のその他のプロダクト
Auto Optimized Parabolic RSI: 高度な3Dモメンタムエンジン ほとんどのリテール向けインジケーターは、市場のボラティリティが変化した瞬間に破綻する静的な入力値に依存しているため、失敗に終わります。Auto Optimized Parabolic RSIは、自らの数学的優位性を継続的に再計算することで「インジケーターの陳腐化」問題を解決し、機関投資家レベルの定量的適応力をMT5ターミナルに直接もたらします。 最大の強み: カスタムインメモリ3D最適化 標準的な自動最適化ツールは、インジケーターの呼び出しで端末に過負荷をかけるため、頻繁にMT5プラットフォームをフリーズさせます。本ツールは、このボトルネックを完全に回避しています。RAMベースのカスタムネイティブ計算機を内蔵した内部エンジンは、チャートを読み込んだりタイムフレームを変更したりするたびに、超高速の3Dグリッド探索を実行します。RSI期間(頻度)、SARステップ(加速度)、SAR最大値(制限速度)を同時にスイープし、プラットフォームを遅延させることなく、数万通りものパラメーターの組み合わせを絶対的なミ
Bazooka EA
Davit Beridze
5 (3)
Bazooka EA ― MT4用トレンド&モメンタム型エキスパートアドバイザー MT5:  https://www.mql5.com/en/market/product/163078 【重要】コメント欄にて更新済みのセット(.set)ファイルを定期的に公開しています。現在の相場環境で最適なパフォーマンスを発揮できるよう、バックテストや実運用を行う際は必ず最新のファイルを使用してください。 Bazooka EA は、 MetaTrader 4 向けの完全自動売買エキスパートアドバイザーで、 トレンド確認 と モメンタムフィルター を組み合わせることで、方向性のある市場の動きを取引するよう設計されています。 本EAは、制御されたエントリーと規律ある決済に重点を置き、過度な取引や高リスクなポジション管理手法を使用しません。 Bazooka EA は、明確なルールに基づいた戦略と、調整可能なリスク管理を重視するトレーダーに適しています。 戦略概要 Bazooka EA は、以下のテクニカル要素を組み合わせて市場を分析します。 移動平均線(Moving Average) によるトレンド方向の判
Bazooka EA ― MT5用トレンド&モメンタム型エキスパートアドバイザー 【重要】コメント欄にて更新済みのセット(.set)ファイルを定期的に公開しています。現在の相場環境で最適なパフォーマンスを発揮できるよう、バックテストや実運用を行う際は必ず最新のファイルを使用してください。 Bazooka EA   は、 MetaTrader 5   向けの完全自動売買エキスパートアドバイザーで、 トレンド確認 と モメンタムフィルター を組み合わせることで、方向性のある市場の動きを取引するよう設計されています。 本EAは、制御されたエントリーと規律ある決済に重点を置き、過度な取引や高リスクなポジション管理手法を使用しません。 Bazooka EA は、明確なルールに基づいた戦略と、調整可能なリスク管理を重視するトレーダーに適しています。 戦略概要 Bazooka EA は、以下のテクニカル要素を組み合わせて市場を分析します。 移動平均線(Moving Average)   によるトレンド方向の判定 RSI   を用いたモメンタム確認 注文実行前の厳格な取引条件チェック トレンドとモメン
2024年以降のゴールド (Gold M15) テストのデフォルト設定 Kaufman Smart Regime EA: 適応型市場インテリジェンス 特別先行オファー: Smart Regime EA の能力は、その真の価値のほんの一部で提供されています。価格が最終評価額の $500 に向けて段階的に上昇し始める前に、今すぐライセンスを $50 で確保してください。これは比類なき市場ロジックへの投資です。 適応型アルゴリズム取引の力を解き放ちます。Kaufman Smart Regime EA は単なる戦略ではありません。ノイズと真の勢いを区別するために設計された、市場感知エンジンです。 コア哲学:「スマート・レジーム」検出 ほとんどのアルゴリズムは、動的な市場に静的なロジックを適用するため失敗します。 Kaufman Smart Regime EA は、Perry Kaufman の伝説的な効率比ロジックを独自に改良したものを利用し、市場の「レジーム(体制)」を決定します。混沌としたレンジ相場では休止し、真の方向性流動性が市場に参入したときにのみ、精密に攻撃します。 上位時間軸マ
Speed Trend Matrix Ultimate (バージョン 5.10) Speed Trend Matrix (STM) は、単一のインジケーターに組み込まれた包括的なトレーディングシステムです。買われすぎや売られすぎの状態を示すだけの標準的なオシレーターとは異なり、STM は市場のボラティリティ (ATR) に対する価格の「速度」を分析します。トレンドの方向性だけでなく、その動きの背後にある強さも特定し、トレーダーが騙しに遭いやすい勢いの低い「横ばい」期間をフィルタリングします。 このツールは、すべての取引に対して完全なロードマップを必要とするトレーダー向けに設計されています。単なるエントリーシグナルを提供するだけでなく、選択したトレーディングスタイルに基づいて推奨される ストップロス (Stop Loss) と テイクプロフィット (Take Profit) の水準を自動的に計算し、チャート上に直接表示します。 基本理念 インジケーターは、価格の速度に基づいて市場の行動を 3 つの異なるゾーンに分類します。 UpZone (緑): 強い上昇の勢いがある状態。 DownZo
Auto Optimized MFI は、自動で最適なMFIの買い・売りレベルを調整するインジケーターです。過去のデータに基づいて実際のトレードシミュレーションを行い、あなたの市場や時間足に合わせて最も効果的なエントリーポイントを見つけ出します。従来の80/20といった固定的なMFI基準ではなく、実際の価格と出来高の動きに適応するのが特徴です。 動作の仕組み 指定した範囲の過去のローソク足を分析し、MFIシグナルに基づくエントリーとエグジットをシミュレーションします。勝率、ドローダウン、TP/SL(利益確定/損切り)などの成績を記録し、これらの結果から最適なMFIレベルを毎日、毎週、または毎月自動で更新します。 主な機能 設定可能なMFI期間(デフォルト:14) 最適化するローソク足の範囲を指定可能 買い/売りレベルの範囲をカスタマイズ可能 細かい調整が可能なステップサイズ設定 最小利益ターゲットの設定で弱い戦略を排除 MFIラインとシグナル矢印のスタイル設定が可能 このツールは、市場の変化に柔軟に対応したいトレーダーに最適で、固定ルールに頼らず常に市場に適応する戦略を実現します。
Auto Optimized Bollinger Bands – 実際の市場に対応する適応型ボラティリティツール Auto Optimized Bollinger Bandsは、従来のボリンジャーバンドを強化したMT4用の高度なインジケーターで、過去のトレードシミュレーションに基づいて最適な期間と偏差の値を自動で選択します。 固定された設定に依存するのではなく、市場の実際の動きに基づいてリアルタイムで最適化を行い、ボラティリティや価格構造の変化に動的に対応できるバンドを生成します。手動での調整は不要です。 主な機能: 過去のパフォーマンスに基づいたボリンジャーバンドパラメーターの自動最適化 重要な反転ポイントでの矢印による売買シグナルを表示 アラート内蔵:サウンド、ポップアップウィンドウ、プッシュ通知 最適化の深さ、表示方法、シグナルなどのカスタマイズが可能 FX、ゴールド、株価指数、暗号通貨など様々な市場で使用可能 本ツールはデイトレードやスイングトレードに最適で、固定パラメーターの従来型インジケーターよりも、よりスマートなボラティリティ取引アプローチを提供します。
Auto Optimized RSI   は、正確な売買シグナルを提供するために設計された、使いやすいスマートな矢印インジケーターです。過去のデータを使ったトレードシミュレーションに基づき、各通貨ペアや時間足に最適なRSIの買い/売りレベルを自動で見つけ出します。 このインジケーターは、独立したトレードシステムとしても、既存の戦略の一部としても使用できます。特に短期トレーダーにとって便利なツールです。 従来のRSI(70/30など)の固定レベルとは異なり、 Auto Optimized RSI   はリアルな価格の動きとバックテスト結果に基づき、ダイナミックにレベルを調整します。勝率、ドローダウン、平均利益/損失といった重要な統計をモニターし、現在の市場に適応して、本当に機能するシグナルを提供します。 RSIが最適化されたレベルをクロスすると、チャート上に買い・売りの矢印が表示され、成功率の高いエントリーポイントを見つけるのに役立ちます。 ご購入後にご連絡いただければ、追加のツールや特別なトレードのヒントを無料でお渡しいたします! 皆様のトレードが成功しますように!
RSI Entry Points is the upgrade of the standard RSI indicator to avoid lagging. Indicator draws the clouds and the arrows to have clear picture where price is and what to wait for. Why standard RSI is lagging? because mostly we do not use it correctly and it is with very weak visual flexibility, less informative. With my current upgrade I tried to Fix both problems same time and I got much better results and more exact entries than standard RSI has. I Made RSI line Dynamic, it gets more flexible
RSI Entry Points is the upgrade of the standard RSI indicator to avoid lagging. Indicator draws the clouds and the arrows to have clear picture where price is and what to wait for. Why standard RSI is lagging? because mostly we do not use it correctly and it is with very weak visual flexibility, less informativity. With my current upgrade I tried to Fix both problems same time and I got much better results and more exact entries than standard RSI has. To make yourself sure check out the screens
Auto Optimized RSI:プロフェッショナルのための市場適応型システム 多くのトレーダーが失敗する理由は、動的な相場に対して静的なツールを使用しているからです。 すべてのチャートで 70/30 といった固定された RSI レベルを使用することは、数学的な誤りです。もしあなたが論理的な根拠のない「魔法の矢印」を探しているなら、このインジケーターはあなたには向いていません。 このツールは、「最適化こそがトレードで生き残るための唯一の鍵である」と理解しているプロフェッショナルのために設計されています。  一般的なインジケーターは、取引する通貨ペアや時間足を考慮しません。 Auto Optimized RSI は異なります。過去のデータに基づいて内部シミュレーションを行い、直近の相場で実際に価格が反転した正確なレベルを算出します。予測ではなく、計算に基づいています。 技術的優位性: 自己適応型ロジック: 現在の市場のボラティリティに基づいて、買い/売りゾーンを自動的に再計算します。 数学的根拠: 勝率 (Win Rate)、ドローダウン、平均損益などのパフォーマンス指標をチャート上
Dashboard for Ma Speedometer:  https://www.mql5.com/en/market/product/116784 Non standard attitude to the standard moving average indicator. The essence of the indicator is to determine the strength and speed of the price direction by determining the tilt angle of the moving average. A point is taken on the fifteenth MA candle and a point on the last closed MA candle, a straight line is drawn between them, it is movable and on a hemisphere shows an angle of inclination from 90 degrees to -90. a
Check my p a id tools they   work  perfect please r ate Here is an Upgraded version with Bonus Ea in case of purchase it costs 30$ only and you get Ea as Bonus:  https://www.mql5.com/en/market/product/96835 This indicator is experimetal, it shows TMA channel arrows with Volatility filter built in to avoid lagging. Try to experiment with it, search for better conditions of use. It is possible to adjust different timeframes for TMA and for Volatility filter Same time on the current chart, so it ma
FREE
Check my p a id tools they   work  perfect! "Period Cross RSI" Is a New indicator idea that shows crosses of two RSI lines with different periods which creates ascending and descending zones for confirmation of long and short trading. This indicator is brend new and will be upgraded further, for now I recommend to use it as a confirmation, filter indicator for determination of long/short trading zones, not as a signaler indicator for now. Further upgrades can make it as a signaler indicator as w
FREE
Check my p a id tools they   work  perfect please r ate Adjustable PIN BAR indicator is usefull tool alowing to search for pin bars you wish to find on the price chart, it has 2 parameters to filter out what type of pin bars you wish to search for: 1) MinTailProc 75% (default) which means to show pin bars that has minimum size of the Nose (Tail) as 75% of full candle size. If Upper Nose (Tail) size of the candle is minimum 75% of the candle size fully than candle is painted in RED. If Lower Nose
FREE
Check my paid tools they work great and I share Ea's based on them for free please r ate The Dual Timeframe RSI (Relative Strength Index) indicator is a novel trading tool that allows traders to monitor RSI readings from two different timeframes on a single chart. This dual perspective enables traders to identify potential trend confirmations and divergences more effectively. For instance, a trader might use a 1-hour RSI alongside a daily RSI to ensure that short-term trades align with the broa
FREE
Indicator shows buy/sell arrows depending on volatility factor. Indicator does not repaint! It works on any pair and any timeframe. It is well tested through strategy builders and shows quite interesting results as a good filter indicator and as independent signaler as well (check the screenshots). It is possible to search for a lot of interesting parameters for profitable trading, some of which are shown on the screenshots. There are next inputs in indicator settings: N-volatility period; Level
Steady Ranger EA – スマートで安全なチャネル取引 バックテスト: 提供された set ファイル(コメント欄)を使用し、「始値のみ」モードでテストしてください。 動画: 字幕付きのビデオを視聴して、詳細を理解してください。 なぜ Steady Ranger EA を選ぶのか? 長期的な安定性とリスク管理を重視した取引システムであり、非現実的な利益を追求するものではありません。 多層ストップ保護: 各取引のストップロスと「損失合計制限」の両方を使用し、ドローダウンを管理。 チャネルベースの取引戦略: 価格チャネルの極端なレベルで取引を行い、適切なシグナルで決済。 適応型ロット調整: リスクを制御しながら、ロットサイズを動的に調整。 マルチタイムフレームフィルター: 一方向の強いトレンド中のエントリーを回避。 信頼性のある戦略: 長期的な安定性を実現し、フォワードテストを通過。 仕組み EA は価格チャネルに沿ってエントリーし、シグナルやストップロス、リスク管理の仕組みに基づいて決済します。過剰なポジションを防ぐため、ロットサイズを制御し、最大ロットに達すると新規ポジション
This EA is Created just for RSI Entry points Indicator ( https://www.mql5.com/en/market/product/67581 Test, to show indicators profitable parameters and to give potential buyers possibility to backtest indicator Entries. EA opens Buy orders on Buy Arrows and Sell orders on Sell Arrows of the indicator, orders are closed on opposite signals. EA is not created for Live automated trading, thats not the goal to sell EA, but any ways if you like it and need it, you can rent. Default settings are fo
MFI Modern PRO
Davit Beridze
4.92 (39)
Def ault settings   are just for visu alis ation, it c an not be profit able with it.  Get a Free EA as a Bonus when you Purchase the Indicator! Plus, Receive 4 Interesting Additional Indicators. Recommended set files for backtesting the indicator on recommended pairs are available in the comments section (last page). Please note that this product is exclusively sold on the MQL5 market. Any other sources offering it are scams, and the author bears no responsibility. To receive the bonus gifts,
Re ad First Before Testing. This Ea goes as a Bonus to  MFI Modern PRO indicator users only. Set files generated  after upgrade you can check in comments section. This Expert advisor is based on MFI Modern PRO indicator   https://www.mql5.com/en/market/product/80765 just to  give possibility to indicator users for fastly test the indicator Before buying. In comments section recommended set files are uploaded by which you can prove yourself that backtest data from indicator overview are real. Thi
MA Revolution is upgraded version of standard Moving   A verage. With the current upgrade moving average line got more sensitive with different market conditions. It gets more flexible by decreasing default period step by step while market is sharp and incrasing period back to default period step by step while market is normal again. testing of the ide a shows th at this upgr aded version gives much more acur acy for detecting m arket direction, ch anges in direction are shown much e arly th an
In case you get Laguerre S crat indicator, you will get Laguerre Scrat Ea as a Gift. To get Ea  and det a iled m anu al PDF contact me PM. Default settings are for usd/cad H4 For St able Long term Profits Laguerre Scrat is a trading system based on 4 indicator combinations in the shape of one indicator. Laguerre indicator (upgraded), CCI, Bollinger bands and market volatility factor. It generates arrows in the indicator window and nuts on the price chart, doubling arrows for a better view where
Fiter
Davit Beridze
5 (2)
インジケーターの購入者には、FiterインジケーターをベースにしたEAがボーナスとして無料で提供されます。(EAの動作を見るには、ビデオをご覧ください。)EAを受け取るにはコメントしてください。 Fiter は、ATRで調整されたRSIライン(黄色)を含む指数移動平均線(EMA)と、従来の移動平均線(赤色)を組み合わせたハイブリッドインジケーターです。この2つのラインのクロスオーバーにより、2本の単純移動平均線を使用する従来の手法よりも、はるかにスムーズで信頼性の高いトレードシグナルが生成されます。 バックテストでは、この手法の有効性が証明されており、単純移動平均線のクロスオーバーと比較して優れたパフォーマンスが確認されています。過去のデータは、Fiterがさまざまな市場環境に適応し、実際の手動トレードで主要なトレンドを特定するための貴重なツールであることを示しています。 違いを体験するには、スクリーンショットを確認するか、ストラテジーテスターでインジケーターを実行してみてください。 トレードシグナルの通知を行うアラートも含まれています。
after getting indic ator cont act me for Bonus E a. Non Repaint TMA channel with special conditioned arrows on price cross of channel lines plus market Volatility factor, which makes product much more accurate than any usual tma channel indicators.  It is proven to be profitable with Ea built based on it which you will get as a BONUS in case of indicator purchase. Good luck.
MRA Index インジケーター概要 ボーナス特典: インジケーターを購入すると、「MRA Index EA」を無料で入手できます。 最適化戦略: スキャルピングでは、過去12か月間のデータを基に設定を最適化し、次の1か月間使用します。この方法は非常に効果的であることが証明されています。 重要な注意点: デフォルト設定は視覚化のみを目的としており、収益性のために最適化されていません。適切な最適化手順は購入者のみに提供されます。 「MRA Index」インジケーターについて: 「MRA Index」は、多様な市場動向とエントリーポイントを特定するのに役立つ多機能なFXインジケーターです。専門的なチャネルと、その中を移動する動的なハイブリッドラインを備えており、売買シグナルを生成します。 主な特徴: 動的ハイブリッドライン: チャネル内を移動し、取引シグナルの基盤となります。 買い・売りシグナル: ハイブリッドラインとチャネルの特定の相互作用に基づいて生成され、市場の反転の可能性を示します。 カスタマイズ: さまざまな入力パラメーターを調整して、トレーダーの戦略に適応できます。 オプショ
デモバージョンは役に立ちません。点滅する数字を見ても何も理解できません。これはダッシュボードです。コンセプトを理解しようとし、残りは私がすべてお手伝いします。 シンボルはカンマ(,)で区切り、ブローカーが表示する形式に正確に従ってパラメータに入力する必要があります。これにより、ダッシュボードで認識されるようになります。これらのシンボルはインジケーターによる分析に使用されます。 ワンクリックで、ダッシュボードから任意の通貨ペアやタイムフレームを直接開くことができます。 MA Speedometer Dashboard は、MetaTrader 4 (MT4) 向けに設計された非常に機能的なインジケーターで、動的な市場分析を通じてトレード戦略を強化します。このダッシュボードは、市場トレンドを特定し、レンジ相場で取引し、フラットな市場状況からの退出を支援する強力な機能を提供します。さらに、特別ボーナスとして、MA Speedometerインジケーターの特別バージョンが提供され、MA Speedometer Dashboardの基盤として機能します。 主な特徴: トレンド分析:ダッ
MetaTrader 4 (MT4)のローソク足パターンインジケーター このカスタマイズ可能なインジケーターは、主要な強気および弱気のローソク足パターンを特定し、トレーダーのテクニカル分析と意思決定をサポートします。 主な機能: パターン検出 : 強気 : ハンマー、強気の包み足、モーニングスター、三兵、強気のハラミ、逆ハンマー。 弱気 : 流れ星、弱気の包み足、イブニングスター、三羽ガラス、弱気のハラミ、首吊り線。 カスタマイズ : 戦略に応じて特定のパターンを有効または無効にできます。矢印でパターンを表示(強気は青、弱気は赤)、サイズや間隔も調整可能です。 移動平均線の統合 : 任意で移動平均線をチャートに表示できます(期間、方法、時間枠、適用価格の設定が可能)。 アラートシステム : 検出されたパターンに対して、画面メッセージ、音声、プッシュ通知、メールアラートを提供します。 複数パターン検出: 収束 : 1つのローソク足に複数のパターンを表示し、強力なシグナルを示します。 強気の収束 : 複数の青い矢印は、上昇トレンドの強化を示します。 弱気の収束 : 複数の赤い矢印は、下降ト
「Candle Info」インジケーターは、MetaTrader 4 (MT4) で直接チャート上にローソク足の重要なフォーメーションを分析し、可視化するためのツールです。高値更新 (HH)、安値更新 (LL)、高値切り上げ (HL)、安値切り下げ (LH) といったフォーメーションを検出し、相場のトレンドや価格変動の洞察を提供します。     主な機能: - **ローソク足フォーメーション:** HH、LL、HL、LH のフォーメーションを検出し、ラベル表示。また、HH & HL(上昇トレンド)や LL & LH(下降トレンド)などの組み合わせも識別します。 - **セッションフィルター:** 主要な取引セッション(東京、ロンドン、ニューヨーク、シドニー)に基づいてフォーメーションをフィルタリングし、市場の重要な時間帯に集中できます。 - **アラート機能:** 新しいフォーメーションを通知するため、画面上のアラート、プッシュ通知、メール通知、音声アラートを設定可能です。 - **カスタマイズ:** テキストの色やサイズを調整し、表示するセッションやフォーメーションを選択できま
このインジケーターはテスターではなく、ライブチャート用です。 PRO Trend Divergence インジケーターは、 トレンド継続のダイバージェンス を検出するための高度なテクニカル分析ツールです。これは、現在のトレンドが今後も続く可能性を示すシグナルです。一般的なインジケーターがトレンドの反転に焦点を当てるのに対し、このツールは、一時的な押し目や調整中であってもトレンドが依然として強いままである市場状況を特定するのに役立ちます。 トレンド継続のダイバージェンス は、価格がトレンドに沿って動く(上昇トレンドでは安値が高く、下降トレンドでは高値が低くなる)一方で、選択されたインジケーターが逆方向に動くことで確認されます。これにより、トレンドが今後も続くことが示されます。 PRO Trend Divergence インジケーターは、トレーダーが自信を持ってトレンドを追い、早すぎる退出を避けるのに役立ちます。 特徴とメリット 複数のインジケーターに対応 MACD、RSI、Stochastic、CCI、Momentum、OBV、VW-MACD、CMF、MFI に対応。 チャート上の視覚
フィルタ:
Leonardo Andriulli
268
Leonardo Andriulli 2025.05.12 16:07 
 

Bad indicator, constantly delayed or against trend signals, the seller keeps saying that he uses it and it's fine, but don't trust it's not like that at all. It's just a huge scam. Stay away

Davit Beridze
11675
開発者からの返信 Davit Beridze 2025.05.15 15:52
First of all this user Revied this product after 1 day usage yesterday without contacting me after purchase to get Manual, Bonuses and my suggestions about correct usage. Than when I replied him here and mentioned his behavior He wrote me to send Bonuses and Manual and he would "Remove Review" which I did not ask for, as I knew that he is just gambling instead of trading and I Knew that after a day he would anyways write negative review back which is not so special for me as we have quite enough users on MQL5 market just junking the thread without trying before purchase, reading overview where it's mentioned that "Profitability is NOT guaranteed" as it is impossible to guarantee anything on Forex and that's logical. Also he denied my suggestion about continuous help and finally all this happened in 2 days. :) one more for buyers again. Chart Patterns Theory; triangles, double-triple tops-bottoms etc. are not created by me, these Theories exist a long time, I just developed and gathered most effective ones by my way and suggest to users who like such patterns to use. Guys Money Making Machine can't be in shape of indicator, if you like patterns just use them, first you should learn trading to know how to use any tool with sense, or at least you should Follow the Rules. If you are searching for something that provides "Arrow" and you buy or sell there and get profitable directly, Trading does not work that way. Thanks.
Lasse Michael Holm
1604
Lasse Michael Holm 2025.02.16 12:10 
 

It is a very accurate indicator. I really love it!!

Davit Beridze
11675
開発者からの返信 Davit Beridze 2025.02.16 12:19
hello, thank you!
Erwin Fonke
499
Erwin Fonke 2025.02.11 12:25 
 

i am only using the triangle signals of this indicator which are 90% accurate and are always winners. After my rent is over i will buy it

Davit Beridze
11675
開発者からの返信 Davit Beridze 2025.02.11 12:28
thanks Erwin! I am happy that you like it!
optioneer7
154
optioneer7 2025.01.10 15:57 
 

I dont like writing Reviews , this Time I HAVE to = During NFP when 99% of all fukkin indicators FAIL - - - NOT this ONE ! I made mucho2 $$$ + Davit ist da Best = https://www.forexfactory.com/attachment/image/4876627?d=1736694710

________ da NFP + FOMC [ google it ] ist da Most Feared Economics events , FEARED by REAL Time FX_Traders 4sure !

https://www.mql5.com/en/market/product/120552?source=Site+Profile#!tab=comments&comment=55655536&page=6

Davit Beridze
11675
開発者からの返信 Davit Beridze 2025.01.10 18:42
Thank you for your review! You have a reputation for being a critical evaluator, which can be intimidating for developers. I'm glad you found my tool worth trying!
Thuận Vũ
86
Thuận Vũ 2025.01.10 07:41 
 

Very good as now!! Great indicator

Davit Beridze
11675
開発者からの返信 Davit Beridze 2025.01.10 08:39
thanks! it is great to get review after few months of purchasing!
Robert W.
61
Robert W. 2024.12.28 12:14 
 

I recently purchased the Chart Pattern Indicator. Before sharing my thoughts on it, I wanted to thoroughly test it to see if it lives up to the claims made by its developer, Davit. Now, after using it for some time, I can confidently say that this is a superb indicator. It has met my expectations and has become an invaluable part of my trading plan. I understand that we all have different approaches to the markets; however, this indicator seems versatile enough to support a wide variety of trading strategies. For me, the most beneficial feature has been the multi-timeframe confirmation. Davit is both supportive and easy to communicate with, making the overall experience even better. This indicator is solid, well-designed, and effective. Further, the cost is entirely reasonable for the value it provides.

Davit Beridze
11675
開発者からの返信 Davit Beridze 2024.12.28 12:16
thanks Robert
KT-Daisangen
193
KT-Daisangen 2024.12.18 09:05 
 

It is often the first sign of a trend reversal. It seems that you can enter the pullback of the higher time frame with this sign. If you're interested, check it out in the demo and you'll see that it's great.

Davit Beridze
11675
開発者からの返信 Davit Beridze 2024.12.18 10:24
thanks for rating my product
mila
266
mila 2024.12.09 18:28 
 

Great work by the developer.I use this indicator on the 1 and 4 hour TF. The indicator gives very accurate signals.Thank you Davit.

Davit Beridze
11675
開発者からの返信 Davit Beridze 2024.12.09 18:55
thanks mila
Ravi Chandiran
748
Ravi Chandiran 2024.12.02 10:22 
 

Excellent Indicator!

Davit Beridze
11675
開発者からの返信 Davit Beridze 2024.12.02 11:08
Thanks Ravi
luvico972
200
luvico972 2024.11.19 03:53 
 

Hi Davit ! It's done ! PRO Trend Divergence + Chart Patterns All in One. I need your HELP now ! WHAOUH DAVIT !! 2000 $ in 1 Hour !! on GOLD

Maintenant il faut que j'en comprenne vraiment le fonctionnement

5000 $ On GOLD ! now !

Davit Beridze
11675
開発者からの返信 Davit Beridze 2024.12.02 11:08
Thank you Luvico :)
Elrick Harris Jr
125
Elrick Harris Jr 2024.11.14 21:54 
 

Great indicator that I use to scalp gold and other pairs. Very reliable, once you get the hang of it profits will come 😊

Davit Beridze
11675
開発者からの返信 Davit Beridze 2024.12.02 11:07
thanks Elrick!
stucan
417
stucan 2024.10.27 16:07 
 

I'm more of a fan of automated trading. However, this indicator is definitely unbeatable when it comes to the price/performance ratio. I can definitely recommend this indicator.

Davit Beridze
11675
開発者からの返信 Davit Beridze 2024.10.27 18:55
thanks
leo-leo13
19
leo-leo13 2024.09.20 08:45 
 

ユーザーは評価に対して何もコメントを残しませんでした

Davit Beridze
11675
開発者からの返信 Davit Beridze 2024.10.13 12:36
thanks
babaxa
19
babaxa 2024.09.20 08:02 
 

ユーザーは評価に対して何もコメントを残しませんでした

Davit Beridze
11675
開発者からの返信 Davit Beridze 2024.10.13 12:36
thanks
JoaoSilva7
37
JoaoSilva7 2024.09.19 12:44 
 

Mostly i liked the triangles and pennant patterns, i have enabled them into my charts and they are a good tool for market analysis.

Davit Beridze
11675
開発者からの返信 Davit Beridze 2024.10.13 12:36
thanks
Mikeladze Roland
33
Mikeladze Roland 2024.09.17 10:55 
 

ユーザーは評価に対して何もコメントを残しませんでした

Davit Beridze
11675
開発者からの返信 Davit Beridze 2024.10.13 12:36
thanks
NN
1034
NN 2024.09.16 00:46 
 

The 'Chart Patterns All in One' indicator repaints! SCAM!!!!! In the comments section, I can prove to you that it repaints by comparing screenshots of the same chart. When I added the indicator on a different day, it repainted. It even went back in time (from 23:40 back to 22:55). First, there was the BLUE triangle for BUY, and then the PINK triangle for SELL. Maybe $50 isn't much to you, but for some people living in less developed countries, it’s tough to lose such an amount on a product that doesn't work. What he is doing isn't right. I even tried contacting him, but instead some other person contacted me telling me that the Developer cannot communicate on MQL, and I need to contact him in Telegram. Ever heard such nonsense? If you study the comments section of this indicator, you’ll notice that only the developer (Davit Beridze) uploaded posts and praised the performance of his own indicator. You won’t find a single user praising it. I really doubt this developer is honest or that his other products work well. So be aware!

Davit Beridze
11675
開発者からの返信 Davit Beridze 2024.12.02 18:05
this is working indicator, it is not scam according users feedback. :) your review is something like description of CRIME not a technical indicator. Chart Patterns All in One contains collection of 8 patterns from which Triangles are just 1 part out of 8 and it can sometimes disappear or be late of few bars (This is Mentioned in Overview). But despite of this Zig-Zag based characteristic it still shows profit if use independently or with confirmation of signal on higher timeframe. It is shown in video as well that it can show profit independently. All other 7 patterns has NO such moment and they work well. there are hundreds of variations for using combinations of all patterns together. I don't know if you search for the Grail (it does not exist) but if you search for good indicator here it is, if you are not lazy to research and use it. It is not honest to write such review and say anything about other indicators of mine even without trying them. Also I had technical problem with MQL5 to send message, So my users contacted you to contact me through mail or telegram but you did not contact me to solve your problem you just write this illogical review.
George Heck
512
George Heck 2024.09.12 07:01 
 

Davit is a fantastic guy to talk with. We chatted for a few days about different strategies and indicators he would recommend. This indicator is quite confusing and rather hard to use. BE AWARE THIS INDICATOR WILL REPAINT. A signal may be there on the chart for a buy triangle one moment, but switch over to a sell triangle if the buy is broken. Not saying it's bad, just saying you should know of the repainting.

Davit Beridze
11675
開発者からの返信 Davit Beridze 2024.12.31 15:11
thanks George. Yes triangles have such character as it is based on Zig-Zag and it is mentioned in Overview. All other Patterns have no such Problem. But even Triangles with its repaint character can be profitable independently or with confirmation on higher timeframes. I am showing this possibility with EA that works based on Triangles only. Thanks again!
You Fang Kou
212
You Fang Kou 2024.09.07 19:21 
 

I personally think that triangles are very useful as a tool for determining direction. As long as you are not greedy, weekly profits are more lucrative than working. The author is very meticulous, and the user manual covers languages from various countries. The overall experience is great.

Davit Beridze
11675
開発者からの返信 Davit Beridze 2024.09.08 10:17
Thanks
Junichi Isono
1069
Junichi Isono 2024.08.27 01:40 
 

It is a very accurate indicator. I'm waiting for a sign on the 4-hour timeframe and looking for an entry point on the 15-minute timeframe, and both signs are valid.

Davit Beridze
11675
開発者からの返信 Davit Beridze 2024.09.08 10:17
thanks
12
レビューに返信