YouTubeにあるマーケットチュートリアルビデオをご覧ください
ロボットや指標を購入する
仮想ホスティングで
EAを実行
EAを実行
ロボットや指標を購入前にテストする
マーケットで収入を得る
販売のためにプロダクトをプレゼンテーションする方法
MetaTrader 5用取引ユーティリティ - 17

Dynamic ATR TP Ratio The ATR Take Profit Manager Expert Advisor (EA) automatically calculates and adjusts the take profit (TP) level for your open trades, based on market volatility. This EA uses the Average True Range (ATR) indicator, which measures market volatility, to set your TP level, ensuring it adapts to the current market conditions. What is ATR? The Average True Range (ATR) is a technical indicator that shows the volatility of an asset over a specific period. It measures how much the
FREE

Упростите свой технический анализ. Инструмент помогает быстро и точно определять на графике блоки заказов и размечать ликвидность. Превратите хаос ценовых движений в четкую торговую схему для более точных решений. Экономьте время на анализе, сосредоточьтесь на принятии решений. Инструмент заточен под торговую систему "Алхимия трейдинг", с его представлением о блоках заказа.
FREE

All-in-One MT5 Trading Panel EA Take full control of your trades directly from the chart using this intuitive and efficient MetaTrader 5 Expert Advisor. Built for precision, speed, and simplicity, this EA provides a fully integrated trading panel to manage your positions without navigating multiple menus. Key Features Instant Order Execution
Place trades instantly with six predefined buttons: BUY 0.5 – Open a buy position with 0.5 lot BUY 1.0 – Open a buy position with 1.0 lot BUY 2.0 – Open a
FREE

Introducing our cutting-edge Trade Copier Expert Advisor for MetaTrader 5 (MT5) – the ultimate solution for seamless trade replication across multiple accounts on the same server or computer. Elevate your trading experience and take control of your investment strategy like never before with our professional-grade Trade Copier. Key Features: Effortless Trade Replication: Our Trade Copier effortlessly duplicates trades from a master account to multiple slave accounts, ensuring that you never miss
FREE

CopyStar – File-based Trade Copier (MT5 Master/Slave, MT4-compatible) Short description
CopyStar mirrors changes to your open net positions from the master to any slaves – quickly, robustly, and without network configuration. Communication runs via common files (shared file folder), enabling CopyStar to support MT5↔MT5, MT5→MT4, MT4→MT4, and MT4→MT5. Supports symbol mapping, lot multiplication, optional SL/TP copying, magic/comment filters, and a clear chart status display including heartbeat.
FREE

Tele Notify can help you send notifications for opened & closed trades to a Telegram channel or your personal Telegram. (see Master Notify for full options of notifications/alerts: indicator data, price, news, etc. Get more EAs here )
Update: Now you can check your account info anytime from your Telegram by simple command: /check. This option is only valid when you use your Telegram User ID on EA inputs *******************************************************************************************
FREE

Demo version of the Virtual SL TP Trailing product for testing all functions https://www.mql5.com/ru/market/product/75210
ВНИМАНИЕ: ТОЛЬКО ДЛЯ ДЕМО-СЧЕТОВ !!!
Make Trailing Stop, Take Profit, Breakeven, Stop Loss levels invisible to the broker!
HIDDEN MODE (STEALTH MODE) Virtual Trailing Stop (Virtual Trailing Stop) Virtual Take Profit (Virtual Take Profit) Virtual Breakeven (Virtual Breakeven) Virtual Stop Loss (Virtual Stop Loss) Виртуальный 2-уровневый Трейлинг-стоп Virtual Tr
FREE

US 30 BOT This is a simple quantitative model that trades US30 Index from NASDAQ top 30 American stocks It uses volatility contraction and expansion as a basic theory. Place it on US30 chart ,any timeframe. Hedging accounts are advised. NB: Standard accounts are preferred and well regulated brokers eg ICMarkets are advised to avoid unnecessary losses eg slippage ones, commissions and large spreads. Minimum account balance ADVISED : USD 100 set activate to true in inputs section NB: These a
FREE

説明: VPS ヘルス チェック EA は、ブローカーへの接続を監視し、接続の状態に関する通知をタイムリーに提供するように設計された MetaTrader 5 ユーティリティです。このツールにより、接続の問題がすぐに通知され、取引活動の安定性と信頼性が維持されます。 特徴: 接続チェック モード: 新しいキャンドルごとに接続をチェックするか、特定の時刻に接続をチェックするかを選択します。 カスタマイズ可能な時間: スケジュールされた接続チェックの正確な時間と分 (24 時間形式) を設定します。 リアルタイム通知: MetaTrader 5 アプリ経由で接続ステータスに関する即時通知を受け取ります。 情報表示: 最後の通知時間とメッセージをチャート上に直接表示して簡単に参照できます。 入力: モード: 接続チェックのモードを選択します Check_On_Each_Candle - チャートに新しいローソク足が表示されたときに通知をトリガーします。 Check_At_Particular_Time - 指定されたブローカー時間 (デフォルトでは 14:00) に毎日チェ
FREE

Less is more. Find the strongest trends! This expert scans ALL currency pairs for a strong trend combined with a breakout.
Requirements for a trend report: 1. Up-trend or down-trend must be found in all of the following timeframes (D, H4, H1, M30) 2. Breakout in the daily timeframe (the upper or lower band of the Bollinger band must be broken)
The correctness of the trend is confirmed to 90%
FREE
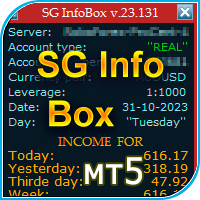
The "InfoBox" utility is designed to display the presence of open orders, the number of lots, current profit and much more in one window. The version for the MT4 platform is here . You've probably encountered a situation where you have an advisor that works on a currency pair, but information about its operation: - orders and their number, the size of the spread for the instrument, the volume of lots on the market, drawdown and much more - are scattered in different places of the terminal an
FREE

チャート下に表示されるテキストボックスから、Slackに投稿するツールです。 w/Imgのボタンからは、チャート画像も送ることができます。
チャートに線やマーク、コメントなどを書いても、その画像が投稿されます。
使い方は簡単。 メッセージを入力し、SENDボタンでメッセージの投稿、w/IMGボタンでメッセージ+画像の投稿を行うことができます。 どんな使い方ができるか、人それぞれですが、Slackでコミュニケーションをされている方であれば、チャート画像を一発送信できるので便利だと思います。
*Slack API"のTOKENをパラメタに設定しますので、取得する必要があります。
ストラテジーテスターでも動作を確認できます。
FREE
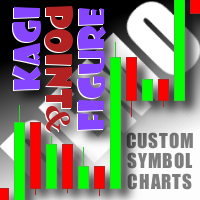
This non-trading expert utilizes so called custom symbols feature to build custom charts based on history of real ticks of selected standard symbol. New charts imitate one of well-known graphic structures: Point-And-Figure (PnF) or Kagi. The result is not exactly PnF's X/O columns or rectangular waves of Kagi. Instead it consists of bars, calculated from and denoting stable unidirectional price moves (as multiples of the box size), which is equivalent to XO columns or polygonal lines. These Poi
FREE

PositionsLimiter EA: Enforcing Trade Discipline with Position Limits The PositionsLimiter EA is a powerful risk management tool designed to help traders control the number of open positions at any given time. By allowing traders to set a maximum limit on simultaneous trades, this EA ensures that no additional trades exceed the specified threshold. If a trader or another automated system attempts to open a new position beyond the set limit, the EA will automatically close the excess trade, ensur
FREE

Ultimate Trading Journal & Analytics Dashboard This tool is not just a trade logger; it is a complete Psychology and Performance Center . It completely takes over your chart to provide a distraction-free environment focused entirely on your trading statistics, discipline, and daily habits. Key Features 1. Total Immersion UI (The "Blackout") Chart Masking: Upon loading, the tool turns the background, grid, and candles pitch black. This hides the noise of the market ticks, allowing you to foc
FREE

Smart Flow Pro - Trading Dashboard Core Features Dual Trading Modes Manual-Assisted Trading : Instant BUY/SELL buttons with configurable interval trading Time-Based Automation : Schedule trades at specific times with GMT offset adjustment Smart Time Management Real-time GMT Clock with adjustable timezone offset Visual Countdown Timer showing hours:minutes:seconds to next trade Automatic Daily Reset with session management Color-coded countdown (White > Yellow > Red as time approa
FREE

Overview The script displays information about the trade account: Information about the trade account: Account - account number and type (Real, Contest or Demo); Name - name of the account owner; Company - name of a company that provide the access to trading; Server - trade server name; Connection State - connection state; Trade Allowed - shows whether trading is allowed on the account at the moment; Experts Allowed - shows whether it is allowed to trade using Expert Advisors; Balance - account
FREE
Close all open orders, delete all pending orders, and clear the entire account's orders. Please use caution! After clicking the button, the account order will be 0! Help us quickly clear account orders! As it is a free version, only the function of closing all orders is available. If other functions are needed, customization is required! The paid version has more features!
FREE
如果产品有任何问题或者您需要在此产品上添加功能,请联系我 Contact/message me if you encounter any issue using the product or need extra feature to add on the base version.
Session TakeProfit StopLoss is basically helping to set the take profit and stop loss in dollar for the total open orders (session). Once the total profit is greater than session_tp or less than session_sl, the EA will help to close all open orders acting similarly to a take profit/stop loss for a single order.
Inputs session_tp: session take profit ses
FREE

Descrição do Indicador ATR (Average True Range) O indicador Average True Range (ATR) mede a volatilidade do mercado, calculando o tamanho médio das últimas barras, não considerando os gaps diários como o indicador nativo do MT5. Ajuste suas saídas com base na volatilidade. Principais Características: Ajuda a determinar níveis adequados de Stop Loss e Take Profit, baseados na volatilidade do ativo.
FREE

Background
This product is a practical tool to check the market based on the cycle theory . When you need to use multi cycle charts to analyze a symbol , manually adding charts with different cycles and applying templates is a very large cost. This product can help you quickly add multi cycle charts of one or more symbols, and uniformly apply the same template . After adding, you can drag the charts to the sub screen, which is suitable for multi screen analysis. Usage Method Apply this script to
FREE

Position Closer is advisor used to close all orders when the profit will cross specified value either above or below. You can close all orders with one button click.
On panel on chart you have options: Deactivate after close - If Deactivate after close is checked the advisor will disable Close above profit and Close below profit options after orders are closed either on crossing the profit or on hitting the CLOSE ALL button. Close above profit - If Close above profit is checked, the advisor wil
FREE

Smart TP by Risk Ratio MT5 Script – Take Profit Calculation Based on Stop Loss Overview Smart TP by Risk Ratio is a script for MetaTrader 5 that calculates Take Profit levels using the distance between the Open Price and Stop Loss, multiplied by a user-defined ratio (R-Multiple). The script can be applied once per execution to the current chart symbol or to all open positions.
It does not open trades and requires a Stop Loss to be set for the calculation. Functionality TP Calculation: Take Prof
FREE

Instructions for Using Reverse Copier EA Attach EA to Charts Open MetaTrader and attach the EA to any chart on both accounts (master & slave). Make sure AutoTrading is enabled. Master Account (Signal Sender) Set Mode = Master in EA settings. This account will send trade signals. Slave Account (Signal Receiver) Set Mode = Slave in EA settings. This account will receive trades in reverse (opposite direction). Lot Multiplier In Slave EA settings, set Multiplier to control lot size. Example: 1.0

If you can not create a background image for yourself (photo size and format must be changed), let me know. I make your photo for free. Otherwise, you can read the help file . A tool for chart management You can change the background image You can change the background color Change the color of the candles Volume colors, line charts and everything else You can also enable and disable some items Read the help file for more information
Settings:
Save Changes After Remove Tool
Back Ground Phot
FREE

This EA generates custom Line Break charts on a separate symbol using the following input settings: 1. LineBreak input int LineBreak = 3; Use: Defines the number of lines required for a reversal (e.g., 3-line break chart). Set to 1: For 1-line break charts (more responsive). Higher values: Create smoother, trend-following charts. 2. StartDate input datetime StartDate = D'2025.03.01';s Use: Specifies the date from which historical data should be loaded and processed. 3. LineBreakTime input bool L
FREE

Get Economic Calendar History Script is an economic calendar data downloader. The time of the Economic Calendar is based on your broker's time, so if you are going to use the same calendar history file on different brokers, make sure their times are the same. The economic calendar history is organized as follows:
Time: Date and time of the news.
Importance: Degree of Possible impact of the news on the market.
Currency: Currency.
Country: Country.
Description: Description of the news.
Peri
FREE

RiskPilot nima? RiskPilot – bu MetaTrader 5 platformasi uchun maxsus ishlab chiqilgan, savdo jarayonini soddalashtirish, risklarni samarali boshqarish va savdo qarorlarini tezlashtirishga yordam beruvchi ko'p funksiyali boshqaruv paneli. Ushbu ekspert maslahatchi (EA) sizga lot hajmini avtomatik hisoblash, interaktiv narx chiziqlarini ishlatish, pozitsiyalarni bir nechta tugma orqali boshqarish va muhim bozor ma'lumotlarini kuzatib borish imkonini beradi. Eng muhimi, panel interfeysi to'liq o'zb
FREE

Orders Manager is a simple and indispensable assistant for managing all your orders. Inputs: Magic = 999; // Magic TakeProfit = 1000; // Take Profit. If = 0 the level is not setts. StopLoss = 0; // Stop Loss. If = 0 the level is not setts. Slippage = 10; // Slippage GeneralProfit = false; // Closing all orders based on total profit. If false the function is disabled and works according to TakePr
FREE

CloseAllChartsExceptCurrent — MetaTrader 5 智能スクリプト 説明:
MT5ターミナルで多数のチャートを手動で閉じるのに疲れてませんか? CloseAllChartsExceptCurrent が代わりにやってくれます!このスクリプトは、起動したチャート以外を即時閉じます。秩序とスピードを重視するトレーダーに最適です。 主な特徴:
ルーティンの自動化 — 不要なチャートをワンクリックで閉じます。
時間節約 — タブ切り替えが不要に。
集中力維持 — 必要なチャートだけを残します。 インストール方法: スクリプトファイル CloseAllChartsExceptCurrent.mq5 をコピーします。 フォルダに貼り付けます:
MetaTrader 5ターミナルの MQL5/Scripts 内。 ターミナルを再起動(またはツールバーからスクリプトリストを更新)。 使い方: MT5で任意のチャートを開きます。 ナビゲーターからスクリプトをドラッグアンドドロップ。 他のすべてのチャートが即時閉じられます。 注意:
FREE

Brekaut, a powerful and intuitive trading indicator designed to take your trading experience to the next level. Built to simplify market analysis and provide timely insights, Brekaut offers traders a reliable way to identify key breakout opportunities across various asset classes, including stocks, forex, and cryptocurrencies.
Brekaut cuts through the noise by highlighting potential breakout points where the market is poised for strong movement. This allows traders to make informed decisions a
FREE

Maximize your trading efficiency with this Breakeven and Trailing Stop Manager, an Expert Advisor (EA) for MetaTrader 5 designed to enhance your risk management by automating breakeven and trailing stop strategies. This EA ensures that you lock in profits and minimize potential losses without constant manual input, giving you more time to focus on market analysis and decision-making.
### Key Features:
- **Automatic Breakeven Adjustment:** The EA automatically moves the Stop Loss to the bre
FREE
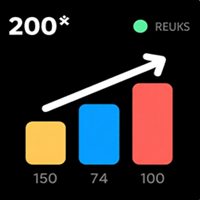
Core Positioning Advanced analytical tool designed specifically for MT5, providing in-depth analysis of trading history, uncovering data insights, optimizing strategies, and enhancing profitability. Core Usage Strategy Performance Evaluation: Analyzes profitability, stability, and risk to provide an objective rating from A+ to D.
Trading Pattern Discovery: Identifies high-quality assets, time periods, and profit-making habits suited to different market conditions.
Risk Management Optimization: C
FREE

Upon launching the script, you will need to specify three parameters: the desired Take Profit, an acceptable Loss level, and a Magic number. Following this, a panel with five buttons is generated: Close all trades - regardless of profit or loss. Close only BUY trades. Close only SELL trades. Close trades with profits greater than Take Profit. Close trades with losses exceeding Loss. All closures are performed ONLY based on the specified Magic number. The panel can be moved within the chart windo
FREE

Guardian Shield EA - Risk & Profit Protection System ️ Ultimate Account Protection Guardian Shield is a specialized utility Expert Advisor designed to provide comprehensive risk management and profit protection for your trading account. It monitors all running positions in real-time and takes immediate action when predefined profit or loss thresholds are reached. Key Features Advanced Risk & Profit Guardian Real-time Monitoring : Continuously tracks total P&L across all positions Du
FREE

Скрипт для быстрого закрытия рыночных и отложенных ордеров. Этот зацикленный скрипт гарантированно закроет все выбранные ордера. Он будет работать, пока не закроет все выбранные позиции и удалится когда сделает свою работу. Если у Вас много открытых позиций этот скрипт поможет вам. Интуитивно понятный интерфейс 1) Просто бросьте его на график. 2) Выберите ордера, которые надо закрыть. По умолчанию выбраны все! 3) нажмите кнопку "Close". Если вы забыли включить Авто торговлю, будет выдано сообщен
FREE

Introduction Welcome to the world of Forex trading, where every tick of the market can be influenced by news events. Introducing our expert advisor for MetaTrader, your ultimate tool for navigating the complexities of news trading. This innovative advisor is specifically designed to automate your trading strategy during key macroeconomic releases, ensuring you never miss an opportunity. When important indicators are announced, volatility often spikes, creating potential for profit. Our expert
FREE

HeatMap – Volume & Pips Change Analyzer for MT5 The HeatMap indicator for MetaTrader 5 is a powerful and interactive tool designed to help traders identify the most active and volatile trading hours across the last 14 days. By default, the indicator starts as a simple floating button labeled "HeatMap" in the top corner of your chart.
With just one click, it opens a compact, easy-to-read panel showing historical market behavior in a 24-hour x 14-day grid layout . What it shows: Hourly Data: Each
FREE

TradingTimeControl is a utility implemented as an Expert Advisor for MetaTrader 5. It automatically closes all open positions and deletes pending orders at a specified time each day. This tool is designed for traders who need to automate position management with flexible settings. Key Features Closes positions and orders at the specified time ( CloseHour , CloseMinute ) daily. Allows you to change the closing time at any moment, applying new settings immediately. Supports MagicNumber : 0 for al
FREE
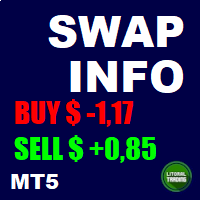
This is a script based tool that informs the swap from all the currency pairs (gold and silver too). It is possible to highlight pairs with a specific currency and whether the swap is positive or negative. In addition it is possible to complement the name of the symbols depending on the broker. The informations are showed in the Experts tab of the Toolbox (Ctrl+T). If you have any doubt or suggestion, please, contact us. Enjoy!
FREE

Just a panel for drawing levels. Minimal but very useful thing. This is a reimagining of Color Levels Pro. ---- 4 types of customized levels. support for rectangle and line levels. The indicator parameters are very simple and are divided into blocks. For any update idea please contact me here. ---- Extension version " Levels tool pro " ---- don't suffer don't suffer ---- Enjoy your work!!!!!!!! ----
FREE

The Panel will read the floating profit/loss for the symbol of your chart and will plot the profit/loss numbers on the chart. It will work with manual trades or trades made by any expert advisor. The Panel shows the Max Drawdown in the base currency, floating profit/loss for both buy and sell orders. It will also show the same in Pips. The Panel is movable on the chart, so you can drag it using the mouse cursor.
FREE

This system is a semi- automatic trend following system that operates during the days of highest probable market volatility aiming to capitalize on major retracements and reversals that occur midweek. It can operate on full autopilot, act as just a signal generator, or any customized user preference based on the needs of the user and the functionality of the program. It is capable of risk management with an inbuilt lot size calculator with adjustable risk pecentage to suit the user's unique apet
FREE
This utility keeps a watchful eye on your trading terminals and ensures that you are notified if any of them are disconnected. Simply attach the utility to a chart and connect to a monitoring service who can notify you.
We use UptimeRobot for both VPS and terminal monitoring; however, any service supporting heartbeat monitoring can be employed.
Many such services offer free plans and various notification methods, such as Cronitor.io
FREE

Right here, is the utility tool to help traders with opening, managing, and closing multiple trading positions at the same time. This Utility tool does not work on strategy tester. To test this utility, follow the blog link below to download the demo version. https://www.mql5.com/en/blogs/post/751097
Specifications. 1) User-friendly - No complications and any trader can find it easy to use. - A simple click on a button is all it takes to perform the desired task. 2) Doe
FREE

Account Sentinel MT5 FREE – Simple Account Monitor Monitor your MT5 account basics in real-time right on your chart! See Balance, Equity, Free Margin, and Margin Level at a glance. Perfect for beginners checking risk without hassle. Key FREE Features: Clean dashboard updates every second Color alerts: Green for safe (Margin Level >80%), Yellow warning, Red danger Basic stats: Balance & Equity difference shown clearly Upgrade for More Power: FULL Version ($49): Add Used Margin, Drawdown %, Multi
FREE

Imagine what results you could achieve in your manual trading if you had a tool that notifies you of a possible price reversal for all the symbols you are interested in at the same time (futures, stocks, forex or cryptocurrency)?
VSA screener is just the right tool. It was created for traders who value their time and make their own trading decisions on opening or closing a position. The software monitors the presence of trading patterns on the preselected tickers under several timeframes (up to
FREE

T-Wallpaper. This is a very useful wallpaper that comes with trade manager panel. You can choose any wallpaper of your choice. Must add the WallPaper file to your MQL5 Data Folder. Follow this easy steps: Download the WallPaper files from our channel https://www.mql5.com/en/channels/transitbk98 Open MT5 Select files Open Data Folder Open MQL5 Open Files and past the Wallpaper folder Now the wallpaper will display. Wallpaper settings are found on the user input. Trade panel settings are found on
FREE

Tired of manually closing dozens of charts or managing multiple positions one by one?
With Close All Pro, you can clear your workspace in a flash—saving time, reducing clutter, and streamlining your trading workflow. Love it? Hate it? Let me know in a review! Feature requests and ideas for new tools are highly appreciated. :) Try "The AUDCAD Trader":
https://www.mql5.com/en/market/product/151841 ️ ALWAYS TEST THIS EA ON A DEMO ACCOUNT BEFORE USING IT LIVE! Description: Close All Pro is desi
FREE
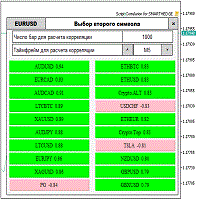
Script for quickly selecting a tool with high correlation. The script is placed on the tool to which you need to select the second correlating one. Then you can change the number of bars to calculate and the timeframe. The script iterates through all available symbols in the market overview and returns the 20 most correlated ones. You can use the selected pairs to trade with THE new SH expert Advisor
FREE

Main Features Automatically closes open positions at a specified time. Symbol filter: close positions only for a selected instrument (or leave blank to affect all). Magic number filter: close only positions with the specified magic number (or all, if set to -1). Displays operational status and parameters directly on the chart . ...and many other interesting features
FREE
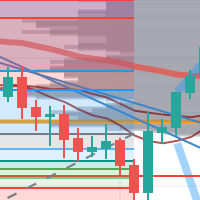
每次一忙都會錯過訊號下單,或不想一直花時間盯盤下單,可以用這個工具掛單,讓MT5 自動 盯盤並在滿足條件後下單 。
demo : https://www.youtube.com/watch?v=JBPiFkixqT4 configuration: https://www.youtube.com/watch?v=D7xESKKD26o #############################################
使用場景:
一般交易可以分為2種,分別是: 左側交易: 價格到達關鍵位置時就下單交易,想要自動下單,可以使用buy limit和sell limit掛單 右側交易: 價格到達關鍵位置, 同時出現做多或做空訊號 時下單交易, 想要自動下單, 就 可以用本工具自動掛單 本工具會 在你指定的阻力區域偵測到做空訊號時,建空單 ; 並在你指定的支撐區域偵測到做多訊號時,建多單。 demo影片: https://www.youtube.com/watch?v=JBPiFkixqT4
########################################
FREE
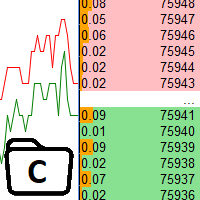
The utility is designed to control the update rate of the order book (or several) in the strategy tester. Management is carried out by a library, which is available here https://www.mql5.com/en/market/product/81400 Interface description: S/P Start and pause playback --- Decrease the speed by one step +++ Increase speed by one step R Updating the character list <0> Slider, moving left/right change the playback speed, after releasing the mouse it is restored to its original state. The
FREE
What the Tool Does SignalAlerts Max watches several indicators:
RSI MACD Stochastic CCI DeMarker RVI EMA Trend Filter (optional)
Whenever any enabled indicator crosses above or crosses below a level, the tool sends alerts:
Terminal Pop-up
Push Notifications Sends alerts to phone via MT5 app.
How To Set Up Push Notifications On Metatrader 4 & 5 - YouTube Important Notes Your PC must be connected to the internet MT5 desktop must be running (or in VPS) You do NOT need to keep the mobile
FREE

The spread in trading is the difference between the purchase price and the sale price of a financial instrument on the market. The spread is a commission fee that traders pay brokers for the opportunity to trade.
It's no secret that each broker offers its own terms for trading. The size of the spread is important. There are a lot of advisors (especially scalpers) who show different results at different brokers. We have repeatedly encountered this. Therefore, using this utility, find out what s
FREE
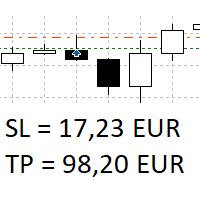
The panel shows all positions and all orders in a small movable window in the chart. Stop loss and take profit are converted into account currency. With the tool you can immediately see the maximum loss in the case of stop loss and the profit in the case of take profit. If there are several positions, a sum is formed. The panel shows either all positions/orders of the current symbol or all existing ones. The data is recalculated for each tick, and moving Stop Loss or Take Profit is immediately v
FREE
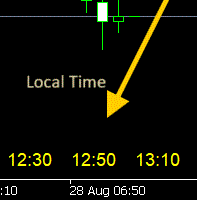
- 사용 설명서 개요 Time Scale Korea Display 는 차트 시간 스케일에 로컬 시간(한국시간)을 표시하는 MT5 커스텀 인디케이터입니다. 각 캔들에 해당하는 한국시간을 보여주어 트레이더가 현지 시간대와 시장 움직임을 쉽게 연결할 수 있습니다. 주요 기능 동적 시간 표시 : 각 차트 캔들에 해당하는 한국시간 표시 위치 선택 : 차트 상단/중앙/하단 표시 위치 선택 가능 윈도우 시간 연동 : 윈도우 시스템 시간으로 정확한 로컬시간 표시 타임프레임 적응 : 차트 타임프레임에 맞춰 자동 조정 외관 커스터마이징 : 폰트 크기, 색상, 위치 조정 가능 브로커 시간 독립 : 브로커 시간대(UTC+2, UTC+3 등)와 무관하게 작동 설정 옵션 표시 설정 매개변수 기본값 설명 DISPLAY_POSITION 하단 표시 위치 (상단/중앙/하단) SCALE_TEXT_COLOR 노란색 시간 텍스트 색상 SCALE_FONT_SIZE 10 폰트 크기 SCALE_FONT_NAME "Arial
FREE
This Expert Advisor is used to send messages from the PCT Multi indicator to Telegram.
The EA has 5 settings: - Channel name: The name of the Telegram channel. - Token: Your bot's Token. - Entries: Entry messages will be sent. - Results: Entry results will be sent. - Alerts: Alerts will be sent.
How to set up: In the Tools -> Options menu, in the "Expert Advisors" tab: - Check the "Allow WebRequest for listed URL:" option. - Click "add new URL" and add " https://api.telegram.org " (without the
FREE

Script for Metatrader 5. One click to Delete the background grid and object, all objects on the chart such as Trend lines you have drawn or created by another program arrows text Fibonacci lines removes the background grid making a clearer clean chart horizontal and vertical lines
Easy for clearing a chart or when opening new charts. Please leave a review on how its working.
FREE

izi hedge is a tool that helps you manage risk, manage hedge orders and rebalance losing orders.
How it works It will place an order opposite to the order you placed with that currency pair. If the order you place is correct, the reverse order will be automatically deleted If the market unfortunately goes against your order and touches the hedge order, it will begin to calculate the hedging volume to limit the risk of the market going in reverse.
FREE
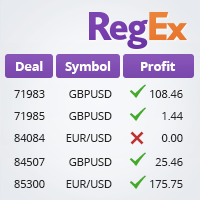
The TradeHistoryParsing is a utility for working with the trade history obtained from the MetaTrader 5 terminal. The product is based on the " RegularExpressions in MQL5 " library. It allows to quickly get the required data on your trading history. The filtering results are displayed as a table, a summary of mathematical statistics is provided below the table.
Working with the tool Export the trade report as an html file and place it into the "sandbox". After that, when launching the EA, specif
FREE

This is the demo version of SmartVSV Panel. https://www.mql5.com/en/market/product/91131 It is the same as original panel with all graphic objects and settings. Main difference is that you can not trade with this demo, but you can see all orders' parameters such as entry, TakeProfit and StopLoss. Also you can test QuickTrade. All functions are explained with alerts. When you add it to your chart press "I" to call information alert.
FREE

Trade Dispensary Connectは、Webhook経由でJSON形式の取引データをTrade Dispensaryのトレードコピアに送信するために設計されたMT5 EAユーティリティです。Trade Dispensaryがローカルマシンで動作している場合は、Webhook URLとして http://127.0.0.1 :5000/webhook/mt5/[ACCOUNT_ID]を使用してください。Trade Dispensaryが別のPCで動作している場合は、そのマシンのアドレス/ドメインを取得してください。このシナリオでは、PinggyやNgrokなどのトンネリングサービスの使用をお勧めします。
このMT5 EAは、Trade Dispensaryのトレードコピアで動作するように特別に設計されていますが、JSON Webhook経由で取引を受け入れる他のアプリケーションでも動作します。手動取引や他のエキスパートアドバイザーによる取引を他のMT5ブローカーアカウントやプロップファームアカウントにコピーするのに非常に便利です。また、MT5モバイルアプリを使用して取引
FREE
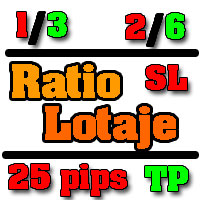
Utilidad de uso informativo la cual ayudará a gestionar el riesgo de los trades con la ayuda visual de los datos proporcionados. el usuario se encargará de ubicar sus SL y TP manual acorde al lotaje. Asesor experto desarrollado para MT5 con el objetivo de ingresar ratios de utilidad y % de riesgo, adicional los Pips de SL para el cálculo del lotaje para dicho riesgo. Estos se calculan sobre el balance actual. El usuario tomaría como dato ingresar el lotaje que se calculó y arrastrar el S
FREE

Простая утилита для быстрого копирования сделок с ведущего счета (Master) из терминала МТ5 в терминал/ы МТ5 через Интернет. Для копирования необходимо приобрести утилиту Z Internet Copy Master и получить у провайдера сигналов номер мастер счета . Копирование происходит в реальном времени. Утилита должна быть всегда запущена на счете. Важно: В меню терминала необходимо добавить сервер для копирования: "Tools" - "Options" - "Expert Advisor" - "Allow WebRequest for listed URL:" - "mt5copy.ru"!
FREE

The Emerald — your all-in-one Forex edge Cut through the noise and trade with confidence. The Emerald bundles a real-time Currency Strength Meter , precision trade/directional signals , crystal-clear signal strength , a current-bar countdown , session time converter , alerts and more — all in one lightweight, fast utility you can use across timeframes and markets. Why it stands out See which currencies are strong and weak at a glance — all 10 major currencies monitored in real time. Instant, pro
FREE

Daily Stop & Profit Daily Stop & Profit is a professional risk management Expert Advisor designed to automatically control your daily profit and loss limits , helping traders protect capital and lock in gains with discipline. This EA works independently of the trading strategy and can be used on any symbol and timeframe . Key Features Set Daily Take Profit and Daily Stop Loss
Limits can be defined in percentage (%) or currency (USD / EUR)
Automatic monitoring of daily results in real tim
FREE
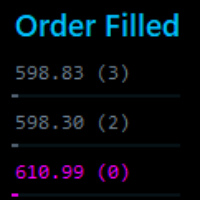
This tool identifies opportunitie levels by tracking where significant orders are being filled in the market and monitors key price levels where institutional orders cluster, providing you with valuable insights into market structure and potential reversal points.
Key Features: Smart Level Detection • Automatically identifies significant price levels where orders are being filled • Tracks both touch and rejection points to validate level strength • Merg Fully Customizable • Adjustable a
FREE
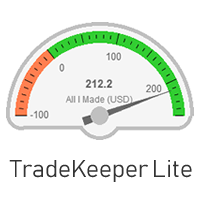
The utility TradeKeeper Lite can show your profits for different periods and bip a sound when you reach a profit target value. Click the tachometer to quickly switch to the next profit period. There are 5 of them: This Day, This Week, This Month, Last 90 Days and All I Made. With the utility TradeKeeper Pro , available at this link , you can also open trades with a magic number and volume of your choice, trail any orders with a simple trail or iSAR-based trail, as well as close any open trades a
FREE
Ultimate Chart Navigator - Instant Symbol Switcher for MetaTrader 5 Love it? Hate it? Let me know in a review! Feature requests and ideas for new tools are highly appreciated. :) Try "The AUDCAD Trader":
https://www.mql5.com/en/market/product/151841 Tired of Wasting Time Switching Charts? Save time and supercharge your trading workflow with the Ultimate Chart Navigator—the professional-grade tool that puts instant symbol switching at your fingertips.
Perfect for forex traders, commodity
FREE
MetaTraderマーケットは、他に類のない自動売買ロボットやテクニカル指標の販売場所です。
MQL5.community ユーザーメモを読んで、取引シグナルのコピー、フリーランサーによるカスタムアプリの開発、支払いシステムを経由した自動支払い、MQL5Cloud Networkなど、当社がトレーダーに対して提供するユニークなサービスについて詳しくご覧ください。
取引の機会を逃しています。
- 無料取引アプリ
- 8千を超えるシグナルをコピー
- 金融ニュースで金融マーケットを探索
新規登録
ログイン