
Demo version of the Virtual SL TP Trailing product for testing all functions https://www.mql5.com/ru/market/product/75210
ВНИМАНИЕ: ТОЛЬКО ДЛЯ ДЕМО-СЧЕТОВ !!!
Make Trailing Stop, Take Profit, Breakeven, Stop Loss levels invisible to the broker!
HIDDEN MODE (STEALTH MODE) Virtual Trailing Stop (Virtual Trailing Stop) Virtual Take Profit (Virtual Take Profit) Virtual Breakeven (Virtual Breakeven) Virtual Stop Loss (Virtual Stop Loss) Виртуальный 2-уровневый Трейлинг-стоп Virtual Tr
FREE

TradeBridge EA ( This is a part of a 2-stage system to work with the MyFXRoom trade alerts and will NOT work on it's own and is published specifically for the MyFXRoom community group ) --------------------------------------------------------------------------------------------------------------------------------------------------------------
For information on accessing the optional bridge used to connect public trade alerts, please visit the author’s MQL5 profile. ----------------------------
FREE

Timezone Filter EA: Precision Trading with Session Control The Timezone Filter EA is an essential tool for traders looking to refine their trading strategy by restricting trade execution to specific trading sessions. Designed for precision and discipline, this EA allows traders to filter which trading sessions they want to engage in—such as Asian, London, or New York sessions —while ensuring that no trades occur outside the defined time periods. Key Features: Customizable Trading Sessions Tra
FREE

Simple countdown indicator for the next candle. Only claim is to be light! The indicator inserts a text object to the right of the current price and calculates how much time is left for the new bar, showing this to the trader. Leave your comment if the indicator helped you in any way! If you have any suggestions, let me know to evaluate the improvements. Success and Good Trades!
FREE

A script for quick reversing positions and/or orders. If you need to reverse a position with the same volume, open an opposite position of a different volume, this script will save you from routine! Allow AutoTrading before running the script. Instructions: Run the script on the chart. This script is a limited version of the market product https://www.mql5.com/en/market/product/638 and allows reversing only positions. Input parameters are not required. Parameters such as changing the type of exi
FREE
Special Trailing Sl is a automatic trailing stop_loss. first It will try to free risk your trade then save the profits. first step is to move the SL 50 points below current price for long trades , and 50 points above current price for short trades.First step will happen when the trade get to minimum profit per point. second step : SL will follow the current price with a dynamic distance. This trailing stoploss has been used in my products.
FREE

How to Use All Symbols Opener Preparation : Open any symbol chart in your MetaTrader 5 platform. Select your preferred time frame for the open chart (e.g., M5, H1, D1). Launch All Symbols Opener : Attach the All Symbols Opener utility to the currently open chart: Drag and drop it from the Navigator window under Experts onto the chart. Alternatively, double-click All Symbols Opener from the Navigator to activate it. Automatic Operation : The tool will detect the active chart’s time frame and appl
FREE

Ghost Trader Pro Special Offer for Ghost Trader Pro Users If you find Ghost Trader Pro useful, I’d really appreciate your short & honest review on the MQL5 Market. As a thank-you , you can message me after posting your review , and I’ll provide you with ONE of my Expert Advisors as a FREE 30-day trial (of your choice, subject to availability). This helps support continued development of free tools like Ghost Trader Pro and future upgrades. Just send me a message on MQL5 after submitti
FREE

# Trading Info Panel - Your Complete Trading Dashboard
## Why This Indicator Was Created
As a fullscreen trader, I was constantly frustrated with the hassle of: - Exiting fullscreen mode to check positions - Switching between charts and the terminal window - Losing focus on price action while checking account status - Missing critical margin levels during active trading
**I needed a simple, elegant solution that kept all vital trading information visible at a glance - without disruptin
FREE
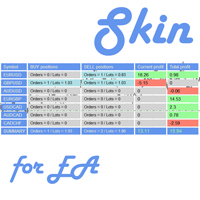
This utility is a graphical shell for other Expert Advisors that do not have their own graphical shell or whose graphical shell you do not like. Just run the utility on a free chart of any currency pair, specify in the input parameters the "Magic Number" of the advisor to which you want to connect the utility, and a graphical shell will appear on the graph, containing information about the traded currency pairs, current positions and trading results of your advisor. If you like this utility, tak
FREE

this tool draws horizontal lines starting from a price you specify in the Inputs. you can draw Horizontal lines above or below or (both sides) the starting price. Based on (The Quarters Theory by Ilian Yotov), this tool displays colored lines at fixed intervals which you can change from the inputs. you can use many sets of Horizontal lines each set of Horizontal lines has its own color and style.
FREE

Smart money is a powerful currency. This money is available to major investors who can identify, predict or even generate capital movements ahead of others. This money can flow into financial and capital markets and create dramatic price changes in various stocks. Therefore, detecting smart cash flow, which usually enters the market in a coherent manner and confronts the volume and value of transactions in a market with high returns, is one of the methods that some investors use to invest. But h
FREE

A script for closing positions If you need to quickly close several positions, this script will make all the routine for you! The script does not have any input parameters. Allow AutoTrading before running the script. Usage:
Run the script on a chart. If you need to specify the maximal deviation and the number of attempts to close positions, use the script with input parameters https://www.mql5.com/en/market/product/625 You can download MetaTrader 4 version here: https://www.mql5.com/en/market/
FREE

The Expert Advisor "TimeLeft Display" shows the remaining time until the close of the current candle in a digital display. The time is displayed in days, hours, minutes, and seconds. Features: Time Calculation: Calculates the remaining time until the close of the current candle based on the current timeframe of the chart. Digital Display: Shows the remaining time in a digital format. Customizable Font and Size: Allows selection of the font (Arial, Arial Black, Aptos Display, Tahoma,
FREE
This indicator allows to hide MACD oscillator (on all MT5 timeframes) from a date define by the user, with a vertical line (Alone) or a panel (with "Hidden Candles").\ Indicator Inputs: Fast EMA Period Slow EMA Period Signal SMA Period Apply To Information on "MACD" indicator is available here: https://www.metatrader4.com/en/trading-platform/help/analytics/tech_indicators/macd ************************************************************* Hey traders!! Give me your feeds! We are a community
FREE

EMA Line Visualizer with Trend Analysis Description:
The Exponential Moving Average (EMA) Line Visualizer EA plots multiple EMAs on your chart (25, 50, 100, 200, and a custom EMA) and analyzes real-time trend direction. It detects whether the market is currently in an Uptrend , Downtrend , or Flat condition based on the latest EMA relationships. Features: Multi-EMA Display
Plot multiple EMAs with customizable periods. Custom Colors
Set distinct colors for each EMA line for better visual trac
FREE

️ Equity Protector EA – Auto SL & Trailing Stop for MT5 Protect your capital. Automate your risk. Maximize your control. The Equity Protector EA is a powerful risk management tool designed for Meta Trader 5 traders who prioritize capital preservation and smart trade automation. Whether you're a scalper, swing trader, or long-term investor, this EA ensures your account stays protected while optimizing trade exits with precision. Key Benefits Drawdown Shield
Automatically monitors your accoun

Overview Are you tired of missing trade opportunities or struggling to execute signals efficiently? The Price Range Trade Automation Bot is here to revolutionize your trading experience! Designed specifically for traders who follow signals from sources like Telegram, this powerful tool automates trade placement across price ranges, ensuring you never miss an entry.
Problems Solved Missed Entries : Manual trading often results in delays, missing the best price levels. Inefficient Capital Use :
FREE

!!ご自身の戦略と合っているのか必ず確認してください!! プロップファームを経験した人なら、
一度はこう思ったことがあるはずです。 最大損失率に合わせてロット計算するのが面倒 扱う通貨ペアが増えるほど計算するのが面倒 ルール違反で失格するのが怖い 口座を失うたびに心が折れる 僕自身、まさにこのループに苦しんでいました。 「勝てるかどうか」よりも先に、
“どうやって生き残るか” が最大の課題だったんです。 その結果、
自分のために作り始めたのがこの ポジションサイジングEA でした。 ↓複数口座管理したいならこっちがお勧め Prop Sizing and Simple Copy EA https://www.mql5.com/ja/market/product/161254
このEAでできること プロップ基準の自動ロット計算 初期残高・最大損失率・一日損失率・最大負け回数を入力するだけ BUY/SELLボタンでSL/TPを同時設定 同時エントリー数にも対応 CALCボタンで最終使用可能額を即表示 許容スプレッド超過時はエントリーしない安全設計 「生き残るためのロットだけ
FREE

PropGuard Basic - 自营交易挑战赛免费保护 ️ 保护您的账户免受规则违规 PropGuard Basic是 免费 EA,帮助自营交易者遵守挑战赛规则。再也不会意外违反回撤限制或利润目标! 主要功能 实时监控 - 可视化绩效条显示您在回撤限制和利润目标之间的位置,带颜色编码状态 利润目标保护 - 达到目标时自动关闭所有交易 回撤保护 - 实时监控,80%音频警告,接近限制时自动关闭 新闻保护 - 2个手动事件 + FFC日历集成,自动检测、自动关闭和交易阻止 周五自动关闭 - 周末前自动关闭仓位 挑战赛跟踪器 - 进度条、统计视图、余额曲线图,支持静态和追踪回撤 视觉警报 - 红色图表背景、屏幕消息、倒计时、声音警报 ️ 简单设置 附加到任何图表 设置回撤和利润目标百分比 配置新闻保护 启用挑战赛跟踪 完成! ️ 重要说明 提示时您必须关闭Algo Trading 将 https://nfs.faireconomy.media 添加到WebRequest 适用于任何时间框架和品种 支持 有问题?留言或发消息给我!
FREE

Free Slave Version – Remote Trade Receiver MT5.
This is the FREE Slave version of our professional Remote Trade Copier system. It allows you to receive trades from a Master account running our full Copy Trade solution. Designed for simplicity and reliability, this version is read-only and cannot send trades or operate independently.
Key Features: One-click setup – simply connect to the Master. Fast and accurate order copying. Supports all symbols, order types, and brokers. Minimal resource us
FREE
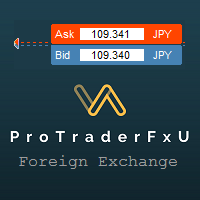
Description: - BidAskLine Indicator is very simple and easy, but each utility can be important in the probability that we will win in our trade. This utility Indicator shows lines and prices of the Bid, Ask and Spread. Input Parameters: - Visual Aspect Options : Select between 2 options with Box or Simple Style. - Parameters Bid Price : Select between show or hide line or box objects, change color, style or width line. - Parameters Ask Price : Select between show
FREE

This EA generates custom Line Break charts on a separate symbol using the following input settings: 1. LineBreak input int LineBreak = 3; Use: Defines the number of lines required for a reversal (e.g., 3-line break chart). Set to 1: For 1-line break charts (more responsive). Higher values: Create smoother, trend-following charts. 2. StartDate input datetime StartDate = D'2025.03.01';s Use: Specifies the date from which historical data should be loaded and processed. 3. LineBreakTime input bool L
FREE

Core Purpose A comprehensive MetaTrader 5 trading dashboard that combines manual trading controls with automated risk management tools for professional traders. ️ Architecture Three-Layer System: Dashboard Layer - Visual interface with real-time account/market data Trading Layer - Buy/Sell execution with position sizing Automation Layer - Risk management & trade protection Key Components 1. Trading Engine Position Sizing : Risk-based or fixed lot calculation Trade Execution : Buy/S
FREE

This is a RISK MANAGER utility for MetaTrader. To activate it, after downloading it, you must enable all autotrading controls on MetaTrader, as with EXPERT ADVISORS. The user must enter control settings as indicated in the indicator properties, which initially have default data. RISK MANAGER will perform checks and display pop-up alerts when certain behaviors exceed the user-entered settings. It's free; use it, try it, develop it, or contribute ideas. It's just a utility; the programmer assumes
FREE

Orders Manager is a simple and indispensable assistant for managing all your orders. Inputs: Magic = 999; // Magic TakeProfit = 1000; // Take Profit. If = 0 the level is not setts. StopLoss = 0; // Stop Loss. If = 0 the level is not setts. Slippage = 10; // Slippage GeneralProfit = false; // Closing all orders based on total profit. If false the function is disabled and works according to TakePr
FREE

エントリー前に確認できるチェックリストを作成しました。 以下のコードを参照してMT5用に作成しました。
Strategy Checklist - indicator for MetaTrader 4 https://www.mql5.com/en/code/18877
機能: チェックリスト20個まで入力できます。 表示位置 (左上 、 右上 、 左下 、 右下) の 指定 が可能 になります。 フォントサイズ の 変更が可能 になります。 チェックリストの幅を変更できます。 ドラッグ&ドロップでチェックリストを移動できます。
インストール方法: ファイル->データフォルダーを開く->MQL5フォルダー->Indicatorsフォルダー 配下にex5ファイルを置いてMT5を再起動してください。 チェックリストはマニュアルで入力が必要になります。入力後 保存しておいてください。 テンプレートで保存しておくと容易にチャートに適用できます。
FREE

VadineroLab MT5 Export Master to CSV EXEL JSON - Expert Advisor for exporting and analyzing symbols, account, terminal parameters, active trades, current account state, trading history, global variables. Generates the following report types: * Symbols Parameters — spread, tick size, min/max lot, swap, … * Account Parameters — balance, equity, leverage, currency, margin info, … * Terminal Parameters — server, version, language, date, environment, … * Trade History — orders, deals, positions, se
FREE

Simple Trade Terminal
概述:
此终端替换了标准的快速交易按钮。需要注意,该终端不会引入新功能,而只是让开仓、平仓以及设置 SL 和 TP 线的操作更加简洁优雅。 输入设置相对简单,主要是视觉调整。如果要获得最干净的界面,建议在图表设置中关闭 Quick-Trading-Buttons,并在终端设置中隐藏边框。
输入参数: Risk Percentage: 确定风险百分比,并据此设置 SL 线时的仓位大小。 Comment: 确定交易标签中显示的评论信息。 Color BUY Button: 确定面板中 BUY 按钮的颜色。 Color SELL Button: 确定面板中 SELL 按钮的颜色。 Color OPEN POSITION Button: 确定面板中 OPEN POSITION 按钮的颜色。 Color CLOSE Buttons: 确定面板中 CLOSE 按钮的颜色。 Background Color Panel: 确定面板的背景颜色(建议与图表背景颜色一致,以获得最佳视觉效果)。 Show Border: 确定是否显示面板边框。 Style
FREE

News Shield – Protect Your Trades from Volatile News Events News Event Backtest
Short Description: In financial markets, economic news can trigger sudden and unpredictable volatility. News Shield is designed to protect your trading account during news releases — automatically, accurately, and without manual intervention. Features: Real-time display of all major economic news directly on your chart Customizable trade lock: block trading a few minutes before and after each news event Compatib
FREE
概览
Performance Indicator 显示一个 热力图 ,展示一组符号在可配置时间区间内的百分比收益。用于直观比较相对的 强弱 ,不对结果作任何保证。 配置
SymbolsList: 用逗号分隔的符号,必须与终端中的名称精确匹配。
BaseTF: 用于计算的基础时间框架。
UpdateSeconds: 自动刷新间隔(秒)。
CapPercent: 颜色强度的归一化值。
PeriodsList: 定义周期的字符串(例如 D1, W1, M1, M3, M6, Y1, YTD);接受诸如 1M 、 2W 、 YTD 之类格式。 收益计算
Standard periods: 比较当前收盘价与 N 个周期前的收盘价。
YTD: 使用最接近当前年初的收盘价以获得一致的比较。 视觉编码
背景: 非负收益为绿色,负收益为红色;强度根据 CapPercent 缩放。
文本: 若收益 ≥ 0 则为绿色,负值为红色,数据不可用时为灰色。双重编码确保可读性。 更新机制
计时器检查 UpdateSeconds 所定义的时间间隔,仅在允许的情况下重建热力图,并有内部保护机制防止过于频繁的
FREE

JMT Funded Man V13 - Professional Risk-Managed Trading Panel for MetaTrader 5 Overview JMT Funded Man V13 is a sophisticated Expert Advisor (EA) designed for MetaTrader 5, specifically engineered for funded accounts and prop firms . This EA provides an intuitive graphical interface with advanced risk management tools, enabling precise, controlled trades while maintaining strict risk parameters. Ideal for funded traders , it ensures compliance with prop firm rules by preventing excessive dra
FREE

US 30 BOT This is a simple quantitative model that trades US30 Index from NASDAQ top 30 American stocks It uses volatility contraction and expansion as a basic theory. Place it on US30 chart ,any timeframe. Hedging accounts are advised. NB: Standard accounts are preferred and well regulated brokers eg ICMarkets are advised to avoid unnecessary losses eg slippage ones, commissions and large spreads. Minimum account balance ADVISED : USD 100 set activate to true in inputs section NB: These a
FREE

A simple and convenient utility for closing orders. It can close both all orders together as well as buy, sell or pending orders separately. Has an intuitive graphical interface. MT4 version of the utility - https://www.mql5.com/en/market/product/78601 If you like this utility, take a look at my other products - https://www.mql5.com/en/users/nina_yermolenko/seller
FREE

Обычная трейдец-сетка, но не имеет явного диапазона. Вместо диапазона, в настройках устанавливаются стоп-лоссы. Закрытие происходит по тейк-профиту, так же устанавливаются в настройках. Робот может торговать в любом направлении, как вверх или вниз, так и в обоих направлениях. Робот не проверяет баланс счета, а потому имеет очень высокий риск. По умолчанию стоят настройки для EURUSD пары (не самые лучшие). Рекомендуемый минимальный депозит $200. Имеется вторая версия в которой добавлены дополните
FREE

This indicator shows both GMT time and your broker's time on the chart.
Simply attach the indicator to a chart, and you will see the GMT time and your broker's time displayed in the top left corner, as shown in the screenshot. By using this indicator, you can always stay informed about your broker's time, which is especially useful during daylight saving changes.
You won't have to worry about whether your broker follows the US or EU schedule, as the indicator automatically adjusts to reflect any
FREE

Trading panel for manual trading. Has a fairly wide functionality. Allows you to automatically calculate the order size, open both market and pending orders. It has a wide range of options for closing orders, it is possible to partially close orders, close orders after reaching a certain profit or loss, separately close profitable and unprofitable, buy and sell, as well as pending orders. The panel also contains a simple implementation of a grid of pending orders, reverse and lock functions, tr
FREE

Manage Positions is an MT5 script designed with five distinct options for efficiently managing open positions. It offers versatile functionality, allowing for both global impact across all currency pairs and localized influence on specific pairs of interest. Additionally, users can target particular currency pairs to tailor their actions accordingly. For instance, leaving the "LEAVE BLANK to Manage Positions for ALL Symbols" field empty enables closing all positions universally, while specifyin
FREE
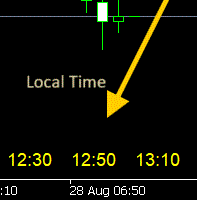
- 사용 설명서 개요 Time Scale Korea Display 는 차트 시간 스케일에 로컬 시간(한국시간)을 표시하는 MT5 커스텀 인디케이터입니다. 각 캔들에 해당하는 한국시간을 보여주어 트레이더가 현지 시간대와 시장 움직임을 쉽게 연결할 수 있습니다. 주요 기능 동적 시간 표시 : 각 차트 캔들에 해당하는 한국시간 표시 위치 선택 : 차트 상단/중앙/하단 표시 위치 선택 가능 윈도우 시간 연동 : 윈도우 시스템 시간으로 정확한 로컬시간 표시 타임프레임 적응 : 차트 타임프레임에 맞춰 자동 조정 외관 커스터마이징 : 폰트 크기, 색상, 위치 조정 가능 브로커 시간 독립 : 브로커 시간대(UTC+2, UTC+3 등)와 무관하게 작동 설정 옵션 표시 설정 매개변수 기본값 설명 DISPLAY_POSITION 하단 표시 위치 (상단/중앙/하단) SCALE_TEXT_COLOR 노란색 시간 텍스트 색상 SCALE_FONT_SIZE 10 폰트 크기 SCALE_FONT_NAME "Arial
FREE

Excellent dashboard for market analytics. The panel helps to analyze the values of the Ichimoku indicator and its signals.
With this panel you can: watch the current signal from Ichimoku on all timeframes; watch the current signal from Ichimoku for different symbols; watch the current Ichimoku value; several types of signals for analytics.
Values in a table cell:
Value of Tenkan-Sen Value of Kijun-Sen Value of Senkou Span A Value of Senkou Span B Value of Chikou Span Span

StockyAI – AI-Powered Trading Signal and Market Analysis System StockyAI is an advanced subscription-based analysis engine designed to support traders with objective data-driven decisions.
Instead of relying on subjective chart interpretation, StockyAI processes market data using quantitative models, technical analysis, adaptive scoring, and probability mapping to generate actionable trading signals. This product connects directly to the StockyAI cloud server, where analysis is performed in real
FREE

Enthiran Slave CopyTrader for MT5 Mirror Trades Across Multiple Accounts with Precision and Speed Enthiran CopyTrader is a powerful MT5 Expert Advisor that allows you to replicate trades from one MetaTrader 5 account (Master) to one or multiple accounts (Slaves) with complete control over trade size, symbol mapping, and execution speed.
To download Master Copier visit this link Whether you manage investor accounts, signal services, or prop firm strategies, this tool helps you maintain synchroni
FREE

Эксперт собирает данные из биржевого стакана, суммируя отложенные ордера на покупку или продажу. Далее, по сумме ордеров определяется общее направление, куда смотрят участники рынка. Если суммарные покупки/продажи превышают определенный коэффициент, то производится сигнал. Настройки: Timer=5 // указывается как часто обновлять данные по рынку в секундах. Чаще чем раз в 10 секунд ставить не рекомендуется. X-size =700 // размер окна по оси Х. Y-size=650// размер окна по оси Y. Only "Market Watch"?=
FREE
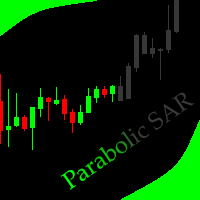
This indicator allows to hide Parabolic SAR (on all MT5 timeframes) from a date define by the user, with a vertical line (Alone) or a panel (with "Hidden Candles"). Indicator Inputs: Step Maximum Color Width Information on "Parabolic SAR" indicator is available here: https://www.metatrader4.com/en/trading-platform/help/analytics/tech_indicators/parabolic ************************************************************* Hey traders!! Give me your feeds! We are a community here and we have the sa
FREE

ProTrade Panel —— 极速、精准、专业的 MT5 交易面板 让交易不再繁琐,让执行快人一步。 您是否厌倦了 MT5 原生下单窗口的繁琐步骤?
您是否在剧烈波动行情中因操作缓慢而错失良机?
ProTrade Panel (专业版) 专为手动交易者设计,集成了 一键下单、突破挂单、快速平仓、可视化风控 等核心功能,助您在该出手时绝不犹豫! 核心亮点 自由拖拽,随心所欲 : 独创的 图表锁定技术 。长按标题栏即可拖拽面板到屏幕任意位置,拖拽时K线图表不会乱跑,松手即停。 极速突破挂单 (Breakout Trading) : 专为突破行情设计。只需设置点数距离,一键生成 Buy Stop (突破多) 或 Sell Stop (突破空) 挂单,自动带好止损止盈。 精细化风控管理 : 所有数值(手数、止盈、止损、挂单距离)均支持 + - 按钮微调,告别键盘输入的繁琐。 全方位平仓策略 : 不仅能平多、平空,更能 一键平盈利单 、 一键平亏损单 或 一键全平 ,风险控制尽在掌握。 极致的交互体验 : 双语切换
FREE

轻质蜡烛倒计时
描述:
推出蜡烛倒计时指示器,这是一种精确且轻量级的工具,旨在显示当前烛台的剩余时间。这个直观的指示器可以轻松定制,以满足您的喜好,并确保无缝的用户体验。
主要特点: 准确性:指标每100毫秒更新一次,提供实时倒计时信息。
轻量级:针对性能进行了优化,不会降低您的图表环境的速度。
易于使用:通过标签颜色、字体大小和字体系列的可调整输入,设置和自定义变得简单。
输入:
更新动画时间(毫秒):100 标签颜色:clrGold
标签字体大小:12
标签字体系列:“Calibri Bold”
标签偏移:1(时间标签按蜡烛偏移)
该指标通过精确而时尚地提供关键时间信息来增强您的交易体验 。 。 。 。 。 。 。 。 。 。 。 。 。 。 。
FREE

This utility clones the chart it is running on. It opens the same chart with the same graphical objects, set of indicators (saving the parameters) and the rest of the elements. In essence, it performs a deep copying of the original chart, transferring the template to the opened chart. The symbol and the timeframe of the original chart are also saved.
FREE

An EA to export trading history for FXer - Journaling and Analytics. fxer.net Register Create an API token Put EA on any chart (any TF is fine) Fill in the API token Follow analytics for better trading At FXer, our mission is clear: to empower traders like you with the tools needed to excel in the ever-changing world of trading. We are committed to providing top-tier, data-driven market analysis and trading intelligence, ensuring you can make well-informed decisions, manage risks effectively, an
FREE

Advanced Breakeven & Partial Close Manager
MT5 脚本 – 一键交易管理 概述 Advanced Breakeven & Partial Close Manager 是一个用于 MetaTrader 5 的交易管理脚本。
它 仅作用于已打开的仓位 ,并严格按照用户设定的规则执行操作。 该脚本在加载到图表时 只执行一次 ,仅执行在参数中明确启用的操作。
不会后台运行,不会自动交易,也不会生成交易信号。 核心功能 该脚本提供严格的保本止损和部分平仓管理,并包含多重安全检查。 保本止损管理
当达到最小盈利条件时,可将止损移动到计算后的保本位置。
支持在入场价基础上增加可选的利润缓冲。
买单保本设置在入场价之上,卖单设置在入场价之下。 部分平仓管理
每次执行仅允许一次部分平仓,按固定百分比减少仓位。
系统会确保剩余手数不低于最小允许值。
默认情况下,仅对盈利仓位执行部分平仓。 重要说明 本产品为 脚本 ,非 EA。
不负责开仓、不分析市场方向、不生成信号。
所有操作需由用户明确配置。
FREE

TradeFlow Dashboard MT5 代表了交易管理的典範轉移,提供了強大且多功能的解決方案,旨在提升您的風險管理策略並簡化 Meta Trader 5 平台內的決策。 憑藉其時尚且用戶友好的介面,該工具超越了傳統的交易體驗,特別適合希望提高業績的手動交易者。
讓我們深入研究 TradeFlow Dashboard MT5 的主要亮點,探索每個功能如何為無縫且強大的交易體驗做出貢獻:
無縫訂單執行: TradeFlow Dashboard MT5 讓您能夠無比輕鬆地執行買入、賣出、限價和停損訂單。 無論您喜歡固定手數還是透過百分比管理風險,該工具都能適應您獨特的交易風格,為每筆交易提供精確性和控制。
輕鬆啟動追蹤停損: 一鍵啟動追蹤停損帶來了一定程度的適應性,這對於駕馭市場的動態本質至關重要。 您的停損會根據市場走勢動態調整,提供在快節奏的交易環境中至關重要的靈活性和反應能力。
主動市場崩潰保護: 市場崩潰過濾器是風險管理領域的遊戲規則改變者。 設定每日最大回檔百分比,TradeFlow Dashboard MT5 會採取主動措施,在達到限制時自動平倉所有未平倉部位
FREE

The tool is intended to help traders who cannot look at the chart all the time, or who use several charts, the trader can mark regions of interest as supports and resistances and as soon as the price approaches these regions an audible warning and on the screen will be presented for the trader to take some action, in addition the tool can automatically mark the highs and lows of the day and time.
FREE

CopyStar – File-based Trade Copier (MT5 Master/Slave, MT4-compatible) Short description
CopyStar mirrors changes to your open net positions from the master to any slaves – quickly, robustly, and without network configuration. Communication runs via common files (shared file folder), enabling CopyStar to support MT5↔MT5, MT5→MT4, MT4→MT4, and MT4→MT5. Supports symbol mapping, lot multiplication, optional SL/TP copying, magic/comment filters, and a clear chart status display including heartbeat.
FREE

当前符号关闭所有头寸 一个简单可靠的脚本,用于关闭当前符号上的所有头寸。它消除了繁琐的工作并节省宝贵的时间。 优势: 仅关注当前资产: 脚本仅关闭选定符号的交易,不影响其他头寸。 快速且方便: 一次运行即可在几秒钟内关闭所有头寸。 适用于任何策略: 适合处理多个头寸或专注于单一资产的用户。 安全性: 逐一处理头寸并记录错误,确保完全控制。 工作原理: 在您的MetaTrader 5终端中运行脚本。 脚本会自动找到当前符号的所有未结头寸。 一键关闭所有交易,其它资产保持不变。 适合谁使用此工具? 需要快速关闭单一符号头寸的交易者。 使用短期策略并注重效率的用户。 想节省时间并专注于重要决策的人。 我创建的其他工具: 清除 当前 符号 的 所有 止 损 和 止 盈
一个脚本,用于删除选定符号上的所有止损和止盈。 清除 所有 符号 的 所有 止 损 和 止 盈
用于同时删除所有符号上的SL和TP的工具。 StopAndTake
管理止损和止盈水平的基本工具。 当前 资产 平均 成本 (简化 版)
一个经济实惠的解决方案,用于计算当前符号头寸的平均成本。 当前 资产 平均 成本 (高级
FREE

ApexTPGrid is a powerful Trade Management Utility designed to professionalize your grid and averaging strategies. Whether you trade manually or use other EAs, this utility takes control of your open "basket" of orders to manage them to a safe exit. The standout feature is the Swap-Aware Logic . We all know the pain of holding a grid for weeks, only to close at "breakeven" and realize negative swaps ate your capital. ApexTPGrid solves this by automatically calculating all accumulated costs (Swap
FREE

PositionsLimiter EA: Enforcing Trade Discipline with Position Limits The PositionsLimiter EA is a powerful risk management tool designed to help traders control the number of open positions at any given time. By allowing traders to set a maximum limit on simultaneous trades, this EA ensures that no additional trades exceed the specified threshold. If a trader or another automated system attempts to open a new position beyond the set limit, the EA will automatically close the excess trade, ensur
FREE

Close Positions on Candle Close This tool allows you to automatically close positions based on the last candle's closing price, helping confirm trade exits and avoiding unpredictable price movements. How It Works: The EA waits for a candle to close above or below the Stop Loss level before executing a position close. It eliminates the need to manually monitor trades and helps automate exit strategies. Settings: Order_Type: Select the types of orders or positions to be managed. CandleTimeFrame:
FREE

1. 產品概述 (Product Description) AlphaLogic PropProtector is an institutional-grade utility designed specifically for Prop Firm traders (FTMO, FundedNext, etc.). It acts as your final line of defense, ensuring your account equity never breaches the strict daily or total loss limits of your challenge. 2. 詳細參數設定 (Input Parameters) 參數分組 & 變數名 預設值 說明與建議設定 === AQ MONITORING === InpAllSymbols true 建議開啟 。監控帳戶內所有品種的持倉與訂單。 InpUseComm true 極其重要 。開啟後會精確計算每一筆成交的佣金與手續費,確保淨值與券商後台 100% 同步。 === PROP COMPLIANCE ===
FREE
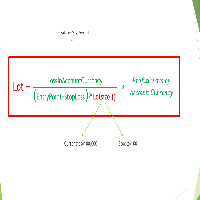
Important Note: Before using it in a real account test it in your demo account.
//+------------------------------------------------------------------+ //| Optimum_Lot_Size.mq5 | //| Copyright 2023, MetaQuotes Ltd. | //| https://www.mql5.com | //+------------------------------------------------------------------+ #property copyright "Copyright 2023, MetaQuotes Ltd." #property
FREE

Having a chart window that has multiple pairs (symbols), timeframes, and indicators displayed simultaneously can be quite advantageous. This indicator will allow traders to place multiple chart objects in a sub window of the main chart window. The indicator is capable of adding all available MT5 indicators and custom indicators to the existing chart. The list and parameters of the indicators are for reference at: https://www.mql5.com/en/docs/indicators
Input parameters Name
Example
Indicator
FREE
SpreadTracker 是一款专为 MT5 设计的专业点差监控工具,能够帮助您实时追踪“市场报价”窗口中所有交易品种的详细点差信息。它不仅能显示即时点差,还能动态计算并显示平均点差和最大点差,为您提供全面而精准的市场洞察。 主要功能 实时数据追踪: SpreadTracker 能够不间断地实时监控并更新所有交易品种的点差数据,确保您始终掌握最即时的市场动态。 多维度点差分析: 它不仅仅显示当前点差,还能同时计算并展示每个品种在指定时间内的平均点差和最大点差。通过这些关键指标,您可以轻松评估点差的波动性和交易成本。 动态排序与显示: 所有交易品种都会自动按其平均点差进行排序,帮助您快速识别点差最低或最高的品种。其多列动态显示功能允许您自由调整界面,以最适合您交易习惯的方式呈现数据。 一键图表直达: 只需点击监控列表中的任何一个交易品种,即可立即打开其对应的图表,实现数据监控与交易分析的无缝衔接,大大提升您的操作效率。 高度自定义化: 您可以根据个人喜好完全自定义指标的界面。无论是颜色方案、布局排版还是数据的更新频率,都可以进行个性化设置,让工具完美契合您的工作流程。
FREE

Script for Metatrader 5. One click to Delete the background grid and object, all objects on the chart such as Trend lines you have drawn or created by another program arrows text Fibonacci lines removes the background grid making a clearer clean chart horizontal and vertical lines
Easy for clearing a chart or when opening new charts. Please leave a review on how its working.
FREE

SmartCloser MT5 SmartCloser MT5 is an advanced service application designed for the MetaTrader 5 platform that enables traders to automatically close open positions based on predefined profitability and loss criteria. This application is not a trading robot or script; it functions as a continuously active service within the trading environment, providing users with control and flexibility in managing their positions. Key Features: Close All Positions: Ability to close all open positions on the
FREE

APEXSYNC TRADE COPIER PRO - THE INSTITUTIONAL-GRADE COPYING REVOLUTION ULTRA-LOW LATENCY | SMART RISK INTELLIGENCE | PROP-FIRM SAFE Tired of slow, basic copiers that risk your capital? Meet ApexSync Pro - the next-generation trade copier engineered to DOMINATE the MT4/MT5 ecosystem with institutional-grade performance, AI-driven risk management, and prop-firm certified safety protocols. WHY APEXSYNC PRO BEATS EVERYTHING ELSE Feature Old Copiers APEXSYNC PRO Speed 500ms+ (slow) <200ms (blazing
FREE
Use this software to browse through all objects within the chart and look at them comfortably. Also, you can look at the list of global variables and search and delete them . The same you can do with charts and indicators. You can search in objects names and object descriptions to find the object you are interested in. This is definitely an improvement to what is available in Mt5. You type what you are interested in , then press Search button. You can move to next and previous search results. N
FREE

The CandleStick Scanner is a tool that allow you to perform a market scan and search any candlestick pattern that you already created in the current chart, You can perform a quick search in the current chart (500 bars will be scanned), This is a lite version of CandleStick Factory for MT5 . The full version video can be found here : https://www.youtube.com/watch?v=fq7pLXqVO94 The full version can be purchased here: https://www.mql5.com/en/market/product/75434
How it works You can
FREE

# ️ WICHTIGER HAFTUNGSAUSSCHLUSS & BETA-HINWEIS ️ **DIESE SOFTWARE BEFINDET SICH AKTUELL IN DER BETA-PHASE. DIE NUTZUNG ERFOLGT AUF EIGENE GEFAHR!** **DER AUTOR ÜBERNIMMT KEINE HAFTUNG FÜR VERLUSTE, DIE DURCH DIE NUTZUNG DIESER SOFTWARE ENTSTEHEN, INSBESONDERE NICHT FÜR VERLUSTE DURCH DAS AUTOMATISCHE SCHLIESSEN VON POSITIONEN (TRADES). BITTE TESTEN SIE DIE SOFTWARE AUSFÜHRLICH AUF EINEM DEMO-KONTO!** --- # Equity Drawdown Monitor - Ihr Wächter für Risikomanagement **Schützen Sie Ihr Kapital
FREE

Smart Bulk Order Closer
MT5 脚本 – 按浮动盈亏关闭交易 概述 Smart Bulk Order Closer 是一款 MetaTrader 5 脚本,可根据仓位当前浮动盈亏关闭交易。 脚本在图表加载时 仅执行一次 ,只关闭符合用户定义 PnL 条件的仓位。
不后台运行,不修改止损或止盈,也不开仓。 核心功能 每个仓位单独评估,并可使用以下过滤: PnL 阈值: 仅当浮动盈亏超过设定值时关闭。 交易状态: 仅关闭盈利、仅关闭亏损或全部。 方向: 仅买单、仅卖单或两者。 交易品种: 当前图表品种或账户所有已开品种。 输入参数 CurrentSymbolOnly (true/false): 限制为当前图表品种。 ProfitFilter: 选择要关闭的交易(盈利、亏损、全部)。 Direction: 按买卖方向过滤(买、卖、两者)。 Min_PnL_Amount: 最小浮动盈亏以关闭交易。 例: 10.0 关闭盈亏大于10单位的交易。 例: -4.0 关闭浮动盈亏大于-4的交易,忽略更大亏损。 用户 管理多仓位的交易者、剥头皮交易者和日内交易者,需要基于盈亏精
FREE

背景
本产品是基于 周期论 而开发出的实用看盘工具。 当您需要使用 多周期图表 来分析 一个品种 时,手动添加不同周期的图表并且应用模板的时间是个非常大的成本。 这一款产品可以帮助您快捷新增一个或多个交易品种的多个周期的图表,并且 统一应用同一种模板 ,新增后可将图表拖拉至副屏,适用于多屏分析。 使用方法
在需要添加的交易品种图表上应用此脚本,在弹出的面板输入您需要添加图表的数量和应用模板名称即可。 第一行填写需要添加图表的数量,新增图表的周期默认顺序为:M5, M15, M30, H1, H4, D1。 第二行填写您需要应用模板的名称,您可以使用系统自带的模板,也可以使用您自定义的模板,但是名称需同步,包括英文大小写。 点击 这里 查看快捷切换多屏图表的工具,可配合此产品一起使用。 点击 这里 查看基于周期论的指标产品,可配合此产品一起使用。 如果您有任何问题或需要帮助,请通过私信与我联系。
注意! 我的所有产品只能在这里购买,即官方 MQL5 网站。 谨防骗子!
FREE

This trading bot is designed for MetaTrader 5 (MT5) to manage open positions effectively by automating partial closures based on a predefined risk-reward ratio. It includes Telegram integration to send notifications directly to your group or channel about trading activities, including entry, stop-loss, and take-profit levels. Key Features : Partial Close Management : Automatically closes a percentage of the trade volume when the target level is reached. Risk-Reward Calculation : Sets profit leve
FREE

Daily Stop & Profit Daily Stop & Profit 是一款专业的 风险管理型智能交易系统(Expert Advisor) ,旨在自动控制 每日盈利和亏损限额 ,帮助交易者以纪律化的方式保护资金并锁定利润。 该 EA 独立于交易策略运行,可用于 任何交易品种和任何时间周期 。 主要功能 设置 每日止盈(Take Profit) 和 每日止损(Stop Loss)
限额可按 百分比(%)或固定金额(USD / EUR) 设置
实时自动监控每日交易结果
清晰显示 剩余的盈利或亏损目标
风险与收益管理 每日止盈(TP):
当达到设定的每日盈利目标后,自动管理交易。 每日止损(SL):
通过限制每日最大亏损来保护交易账户。 实时统计数据: 盈利交易总额(USD) 亏损交易总额(USD) 当前持仓总盈亏(USD) 交易控制面板 EA 在图表上提供直观的控制面板,支持一键操作: 关闭盈利单 — 关闭所有盈利交易 关闭亏损单 — 关闭所有亏损交易 全部关闭 — 关闭所有未平仓交易 删除挂单 — 删除所有挂单 启用 / 禁用 EA — 快速控制 EA
FREE
MetaTrader市场是您可以下载免费模拟自动交易,用历史数据进行测试和优化的唯一商店。
阅读应用程序的概述和其他客户的评论,直接下载程序到您的程序端并且在购买之前测试一个自动交易。只有在MetaTrader市场可以完全免费测试应用程序。
您错过了交易机会:
- 免费交易应用程序
- 8,000+信号可供复制
- 探索金融市场的经济新闻
注册
登录