 MetaTrader 5
 エキスパート
 インディケータ
 ライブラリ
ライブラリ
 ユーティリティ
 ウィジェット
 ルール
ルール
YouTubeにあるマーケットチュートリアルビデオをご覧ください
ロボットや指標を購入する
仮想ホスティングで
EAを実行
EAを実行
ロボットや指標を購入前にテストする
マーケットで収入を得る
販売のためにプロダクトをプレゼンテーションする方法
MetaTrader 5用取引ユーティリティ - 40
 以下はMetaTrader5での取引を簡素化する取引プログラムです。ユーティリティにカーソルを合わせると、その説明と目的が表示されます。
Object Synchronizer MT5 : Better focus/analysis of the price chart in many timeframes. Are you bored to save and load template many times for the same symbol for many chart timeframes? Here is the alternative. With this indicator, you enjoy creating objects across many charts, you can modify the same object in any chart, you can delete the same object in any chart. All objects you created/modified are always synchronized across all chart windows (with the same symbol). Save your time, you can fo
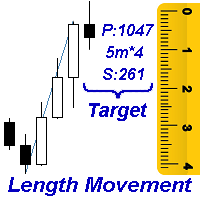
Measures the length of the selected movement in points, shows the duration of the movement, as well as the speed of movement. Outputs the average value of each dimension.
It is designed to calculate the expected target based on typical market movements.
The intended goal will provide information about the ratio of the stop size to the possible profit and will allow you not to open positions with a small expected profit.
It will also help you determine the point at which it is more logical to c

VR Alertは、価格やその他のインディケータを監視し、価格やインディケータがあらかじめ設定されたレベルに達したときにトレーダーに通知するように設計されたインディケータユーティリティです。信号レベルの設定は、水平方向だけでなく、斜め方向からも可能です。これにより、トレーダーは傾斜したトレンドレベルからの通知を受け取ることができます。VR Alertを使えば、長時間モニターを眺める必要はありません。家事をしたり、仕事をしたり、家族との時間を安心して過ごすことができます。そちらの作業は、レベルを設定し、4つの情報伝達方法の中から1つを選ぶだけです。このユーティリティは、スマートフォンや電子メールへのアラート送信し、標準的なアラートウィンドウとサウンドの表示する、グラフの赤色表示などがされます。ユーティリティーの操作はすべて、グラフィック上のマウスを使って行います。 起動すると、このユーティリティーはチャートに他のインディケータがあるかのことをスキャンします。VR Alertは、チャート上に表示されている部分を持つインディケータを観察します。
モニタリング可能なすべてのインディケータには、
The indicator allows you to quickly switch from one instrument to another, from one time period to another using the keyboard or buttons on the monitor. Each command can be assigned a hot key from 0-9, a-Z (case-insensitive) and VK_OEM_COMMA ("<" on the keyboard) and VK_OEM_PERIOD (">" on the keyboard). This can help you to operate the maximum number of instruments that are available at your broker, analyze more instruments/periods in less time. This product cannot be tested in the tester , beca

This indicator allows you to measure the profitability of each specific transaction (the ratio of Stop and Profit). The indicator allows you to adjust the ratio by step size and number of steps. You can build an unlimited number of ratios to compare the risks from different movements.
Note: the MT5 tester is not designed for full-fledged work with graphic objects, so drawing in the tester is slower than in the real situation. The ratio selection is performed with 1 mouse click.
Building a line

The script displays info about the share's corporate reports and dividends. The data is downloaded from investing.com : Report date Profit per share (EPS) Revenue Market capitalization Amount of dividends Date of payment of dividends Dividend income The product cannot be tested in the tester (since it is not possible to receive data from the Internet).
Before launching: Add 2 URL https://ru.investing.com/earnings-calendar/Service/getCalendarFilteredData and https://ru.investing.com/di
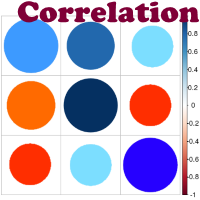
Advantage The analyzer provides an opportunity to examine correlation in history, for example, for the previous month excluding the current one, thus allowing you to evaluate symbol movement in history. It can be conveniently used in conjunction with the LineSyncMirrorCharts analyzer. Charts are synchronized by a market type: Forex, CFD, Futures, and Indices. The analyzer calculates the distance covered by the price on a specified period in points. The tool fits pairs and portfolio traders.
Des

Automatic calculation of lot size based on the StopLoss level: it calculates the lot with consideration of the risk percentage. Enter the deposit percentage and set the line to the planned StopLoss level. The lot size for the entry will be output as a result. The TakeProfit will also be calculated with taking into account the profit/loss ratio, and their profit/loss in the deposit currency. Thus, the end result of the trade can be seen immediately, which is an integral part of successful trading

Telegram Publisher Agent は、 トレーダーが Telegram チャネルおよびグループにリアルタイムでシグナルを送信できるようにするアドオンです。このツールは、カスタマイズ可能なメッセージ、チャートのスクリーンショット、その他の機能を備えており、トレーダーが取引の洞察や戦略をフォロワーと共有するのに役立ちます。このツールは、明暗のテーマ切り替えを備えた美しいデザインも備えており、ユーザーに美的で機能的な取引体験を提供します。 Telegram Publisher Agent は、すべての取引をチャネルおよびグループ内のシグナルとして公開するように設計されています。あなたがしなければならないことは、取引を提供することだけです。その後、ボタンをクリックするだけで、Telegram Publisher Agent が取引シグナルを取引チャネルまたはグループに送信するためのすべての面倒な作業を実行します。 Telegram パブリッシャーエージェント インストールと入力ガイド EA に関する通知を受け取りたい場合は、URL ( http://autofxhub.
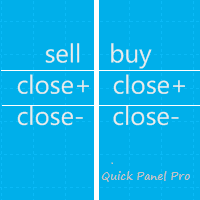
観察。このコンサルタントはヘッジ口座のみを対象としています。メタトレーダー4のバージョン Quick Panel Pro
特徴 バッチの計算はすばやく簡単です。停止線を移動すると、計算はすぐに行われます。 ほとんどの業務操作は、これらのパネルのボタンをクリックするだけですぐに完了できます。 緑色のボタンをクリックするだけで、パネルをすばやく切り替えることができます。 マウスをクリックしてストップロスとテイクプロフィットを素早く変更します(バックテストには使用できません) 黄色の背景のパネルに平均価格を表示し、平均価格の線を描きます。 ここをクリック コントロールパネル ダッシュボードは 2 つの列で構成されます。左の列は売りに関するもの、右の列は買いに関するものです。 売り: 売り注文をオープンします。 最初: 最初の売り注文を閉じます。 1つ目は営業時間についてです。 最後に: 最後の売り注文を閉じます。最後のは営業時間についてです。 all+: 利益を伴ってポジションを閉じるための売り注文。 all-: 損失で売り注文をクローズします。 max+: 最大の利
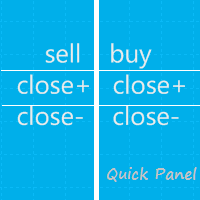
注: この EA はヘッジ口座でのみ機能します。メタトレーダー4のバージョン クイックパネル このパネルは、6 つのグループの取引パネルを提供するエキスパートアドバイザーです。
特徴 ほとんどの取引操作は、これらのパネルのボタンをクリックすることで迅速に実行できます。 パネル間の切り替えは緑色のボタンをクリックするだけで簡単に行えます。 EA はストラテジー テスターの視覚的なチャート上で実行でき、履歴データを使用して取引を練習する簡単な方法を提供します。 マウスをクリックしてストップロスとテイクプロフィットを素早く変更します(バックテストには使用できません) 背景が黄色のパネルに平均価格を表示し、平均価格の線を描きます。 ここをクリック
パネル ダッシュボードには 2 つの列が含まれています。左の列は売りに関するもので、右の列は買いに関するものです。 sell: 販売注文を開きます。 first: 最初の販売注文をクローズします。 1つ目は営業時間についてです。 last: 最後の販売注文を閉じます。最後のは営業時間についてです。 a

DYJ Follow Me is an EA that follows the virtual transaction record of any dyj indicator to actually open and close positions.
It can display the name and status of the indicator of the single signal source; At present, it is only the DYJ SignalSourceOfWPR MT5 indicator, and more indicators will be expanded in the future.
It can receive real-time trend direction of indicator.
It can receive the latest admission time of the indicator.
It can receive the latest admission price of the ind

The TimeFilter indicator allows visually selecting the bitmaks (GoodHourOfDay, BadHoursOfDay, GoodDayOfWeek, BadDaysOfWeek), which correspond to the Standard Library's Intraday Time Filter module for trading signals. Additionally, it is possible to enable and disable the trading intervals in a string form. It is also possible to use the trade volume multiplier when using the indicator as a part of an EA. String format: [week day]:[first hour]-[last hour]. See the screenshots and the video for us

This tool adds alerts to your Fibo Retracement and Fibo Expansion objects on the chart. It also features a handy menu to change Fibo settings easily and quickly! Please note the product is not working as a demo. Please watch the video.
Features Alert for Fibo Retracement and Fibo Expansion levels. Sound, Mobile and Email alert. Up to 15 Fibo Levels. Continuous sound alert every few seconds till a user clicks on the chart to turn it OFF. Single sound alert with pop-up window. Keeping all user se
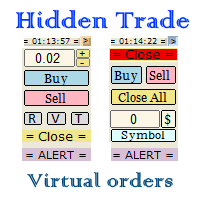
Small trading panel for managing orders and positions in 1 click for MetaTrader 5 The version for MetaTrader 4 is here , you can check it in the tester without restrictions Set hidden TakeProfit, StopLoss and pending orders at lines placed on the chart. Virtual breakeven. Virtual trailing stop. Close all positions. Close only Buy positions. Close only Sell positions. Work in the back testing mode (working in the tester is limited). Place up to 20 virtual orders. News trading and operation by tim

A ticker that shows the average bitcoin price of the selected currency and keeps updating it at regular intervals. PRO version updates more often and displays details about the price change! Make sure you have added the API address http://metakod.com/mk/api in the list of allowed URLs on tab Tools → Options → Expert Advisors. All of the supported currencies and the API address are listed in the screenshots below.
Inputs Logging level - Controls the amount of details written to the log (default:
What does it do? It assists you in your trading and has some important jobs to perform: It sets virtual pending orders, stop loss and take profit. It can set real stop loss and take profit if desired. It makes trading independent of bid-ask line concept, thus useful for very short term traders and price action traders. Orders can be opened, managed and closed with 1 click providing fastest management. It can automatically set your position sizing based on your risk inputs. Graphical panel enable

This indicator sends a message (notification), an email, and plays a custom sound when a Limit (Buy/Sell) or Limit Stop (Buy/Sell) or Take Profit, Stop Loss, Stop Out is executed. A user can change the sound file name, and select if they receive notifications/emails. It runs as an indicator, and only one indicator is locked (used) by a user account/login.
Parameters soundFile - sound file
Save your file at the terminal folder, for example: " C:\Program Files\MetaTrader 5\Sounds\Order Executed.

The indicator displays useful trading information on the chart for futures contracts such as: Average daily volatility with adjustable period of time. Optimal volume to trade depending on percentage of account balance you use. The percentage can be adjusted. Optimal stop loss depending on your maximum risk per trade considering percentage of account balance you use. Initial margin for the contract. Tick value for the contract. The indicator has an ability to display dynamic daily volatility leve

This is a utility for closing orders or baskets of orders for the total profit or loss. Can work multicurrency, can work with orders opened manually. Has additional trailing profit. Capabilities: Closing an order for the current symbol or for all symbols Closing individual orders or whole baskets of orders Stopping the utility in one click Trailing function for total profit Setting TP and SL in money, in points or as a percentage of the deposit Closing all BUY or SELL orders or closing all orde

This script will show you information about the execution speed of market orders. Instruction 1. Press " File/Open Data Folder " 2. Copy the log-files from ../Logs to ../MQL5/Files 3. Run the CheckExec script on EURUSD chart, for example 4. Select parameters: AllOrders - check execution time of all market orders for EURUSD, OpenOrders - check execution time of market orders which where used to open positions on EURUSD, CloseOrders - check execution time of market orders which where used to

This utility calculates and draws lines over the chart. There are two types of channels: Channel A: the mainline is drawn using local lows for uptrends and local highs for downtrends Channel B: the mainline is drawn using local highs for uptrends and local lows for downtrends The parallel lines of both types are built using the max. fractal between the base points of the mainline. There are a few conditions, which have to be fullfilled and can be changed by the parameters (see also picture 3):
t

Plot History Mt5は、エキスパートアドバイザーが実行する取引端末とアカウントの取引履歴を分析するトレーダーにとって不可欠なスクリプトです。分析方法は、スクリプトが実行されるシンボル図と魔法の番号、1人または複数の専門家が使用するすべての魔法の特定または完全な分析に基づいています。スクリプトは取引データを分析し、これらをチャートにプロットし、エキスパートログに詳細な取引情報を印刷し、分析されたデータをcsvにエクスポートできます。 スクリプトの利点 アカウントで使用されている1つまたはすべての魔法を分析する機能 すべての取引データをcsvファイルにエクスポートします すべての取引、エントリー、エグジットをチャートにプロットします。これは、プロットするかどうかのように設定できます。 エキスパートログに詳細な取引情報を印刷する アカウント取引分析を実行する方法 分析するシンボルを選択することから始め、次に、分析を特定の魔法の番号付けで実行するか、アカウントで使用されるすべての魔法の完全な分析で実行するかを選択します。ノート;これはスクリプトであり、専門家のアドバイザーではあり
This non-trading expert utilizes so called custom symbols feature ( available in MQL as well ) to build renko charts based on historical quotes of selected standard symbol and to refresh renko in real-time according to new ticks. Also, it translates real ticks to the renko charts, which allows other EAs and indicators to trade and analyze renko. Place RenkoCharts on a chart of a work instrument. The lesser timeframe of the source chart is, the more precise resulting renko chart is, but the lesse
Strategy Builder offers an incredible amount of functionality. It combines a trade panel with configurable automation (covert indicators into an EA), real-time statistics (profit & draw down) plus automatic optimization of SL, TP/exit, trading hours, indicator inputs. Multiple indicators can be combined into an single alert/trade signal and can include custom indicators, even if just have ex4 file or purchased from Market. The system is easily configured via a CONFIG button and associated pop-u

This tool allows you to better analyze your chart. With "Crosshair Percent", you can calculate distances in the chart in a percentage way (in a very simple way, when the pointer is attached in the form of a crosshair: CRTL + F). The utility allows to measure and/or calculate the movements of the price NOT only in points, use a measure in professional terms as it is the percentage. The result is shown in two parts of the screen, one of them, next to the position of the pointer and the other in a

The script creates a brief daily summary report of the weekly trade in a separate window.
Input parameters of the script number of weeks - set the time interval (the number of weeks) for the report. switch for symbols selection - three modes for selecting the instruments to generate the report: All_Symbols - report is generated for deals of all instruments. Current_Symbols_Only - report is generated only for deals of the instrument in the current window. Without_Current_Symbols - report is gene
This utility displays the name of the current symbol and the current period in the chart background in a large font. It is very convenient, e.g. when you use multiple charts with different symbols, period or when saving a chart screenshot. The information is displayed in two lines. In the first line, the chart symbol and current timeframe are shown in a larger font (e.g. AUDUSD,h1 ). In the second line, the full name of the current symbol is displayed in a smaller font (e.g. for GPBJPY it shows
A ready-made trading system based on automatic plotting and tracking of Fibonacci levels for buying and selling any symbol on any timeframe.
Advantages Determines the trend direction (14 indicators) Displays the trend strength and the values of indicators comprising the trend direction Plotting horizontal levels, support and resistance lines, channels Selection of the Fibonacci levels calculation type (6 different methods) Alert system On-screen Email Push notifications
Buttons Changing the co

MetaTrader 4 version is available here: MT4 Drawer . This tool allows you to draw on the chart using keyboard shortcuts. It also provides some custom drawing tools for your convenience. You can configure 3 variants for each tool (6 for advanced patterns), which you will be able to choose from dashboard. There is also, a possibility to define up to 30 quick access keys that skips the dashboard step and goes straight to drawing. Here are the list of supported tools: Advanced Pattern - draws two t

Copyist MS — это простой и удобный в использовании торговый копир. Работает как однофайловый советник с переключаемыми режимами работы Master и Slave. Ордера можно копировать из МТ5 в МТ5, из МТ5 в МТ4, из МТ4 в МТ5. Для копирования ордеров в MetaTrader 4 требуется версия советника для MetaTrader 4. Текущая версия советника работает только на ХЕДЖИНГОВЫХ счетах. Параметры Тип работы - выбор режима работы: Master или Slave; Копировать по магическому номеру - копирование торговых ордеров по магич
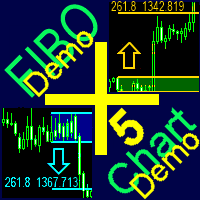
A ready-made trading system based on automatic plotting and tracking of Fibonacci levels for buying and selling any symbol on any timeframe. Demo version - calculation of the last 290 bars is not performed.
Advantages Determines the trend direction (14 indicators) Displays the trend strength and the values of indicators comprising the trend direction Plotting horizontal levels, support and resistance lines, channels Selection of the Fibonacci levels calculation type (6 different methods) Alert
FREE
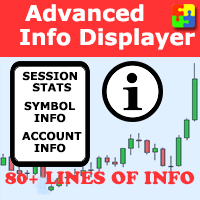
Would you like to have statistics about your trades displayed while you operate? Have you a solid understanding of the symbol you are trading? Do you really know everything you need to about your trading account? Do you need to keep an eye on the local times around the world? Advanced Info Displayer answers to all that. It helps you to know many hidden or hard to find data. Also, it is very convenient if you value statistics and maths. Just to exemplify, in more than 80 lines of information you

This is a utility designed to automatically set the stop loss levels of orders according to the specified condition. Two price levels serve as the condition for setting stop loss: Trigger level - when this level is reached, an order is placed. The stop loss value of an order. It is possible to enable or disable traling stop loss.
Input parameters Order type for execution - type of orders to be processed by the expert. It can either be BUY, SELL or auto-select. Trigger Level Points - level to pl

Risk Manager Pro is a simple utility that calculates the necessary lots with the risk percentage and the pips of stop loss, before opening positions. The web calculators can be useful in some cases but they are not efficient to open operations in real time. In the trading days, there are few opportunities to open positions and when the opportunity arises, the seconds make the difference. This is not possible with conventional web calculators, since to calculate the size of an operation regarding

As the name suggests, the utility collects ticks and uploads them to a file. Each symbol receives its own folder. A directory in the symbol folder is created for each date so that you can find ticks of a necessary symbol and date quickly and easily. The collector is made as fast as possible within MQL. One collector is sufficient for each symbol. Timeframe does not matter. The utility features the function for displaying ticks collected in a file on a chart. You can also navigate ticks using a k

マルチチャートリフレッシュMt5は、高速でスムーズに不可欠なスクリプトであり、複数のチャートを同じものから同時にリフレッシュすることができます。マルチタスクにより、更新するシンボルを事前に選択できるため、これが可能になります。 それはどのように機能しますか?
チャートを開き、ナビゲーターからスクリプトをドラッグしてチャートにドロップします。目的の記号を設定し、[OK]をクリックします。これはスクリプトであり、エキスパートアドバイザーではないことに注意してください。プログラムは、タスクが完了するとチャートから自分自身を削除します。ターミナルのジャーナルの詳細情報は、どのシンボルが希望のバー数で更新されているか、更新されていないかについて印刷されます。これより簡単なことはありません!
スクリプトメニュー設定 シンボルの選択-目的のシンボルを設定します シンボルプレフィックス-シンボルプレフィックスが存在する場合は入力します。プレフィックスのみです。 記号の接尾辞-記号の接尾辞が存在する場合は入力します。その接尾辞のみです。 何本のバーでチャートを更新しますか? -更新/チャートするバ

The Universal Signal Dashboard (USD) is a signal dashboard or indicator matrix. It can generate a matrix of signals from values, chart and candle prices, and from the buffer output of almost any technical indicator. However, unlike most dashboards of the same category, USD is configurable based on the inputs provided by the user within the app interface. The tabs (Display, Data, and Signals tabs) starts empty and the Display tab will show more display entries as the user adds more signal entries

Spread Costs refers to the amount of the loss caused by the spread, and Swap Benefits refers to the amount of the income gained by overnight positions. Spread Costs is an important indicator for short-term traders, especially for scalping traders, and Swap Benefits is an important indicator for long-term traders. Since the spreads and swaps on the MetaTrader 5 platform are all expressed in points, we need to convert it into the amount expressed in the account currency. This tool can display the

The Quick trade report separately by symbols script will be useful for simultaneous trading on multiple instruments. It provides the ability to assess the effectiveness of trading on each symbol separately. It is possible to set a time period for making the reports. The report visualizes the changes in the balance for deals on each symbol. Also, the following key trading parameters are calculated for each instrument: Total net profit - the financial result of all trades. This parameter represent

Super ATR is a powerful tool for analyzing the ATR (Average True Range) levels. The intuitive interface allows you to easily monitor all the main ranges of volatility.
Key Features Plots the daily АТR areas on the chart. Plots the weekly АТR areas on the chart. Plots the monthly АТR areas on the chart. Displays a panel with the current values of the main volatility ranges (M5,H1,D1,W1,MN) on the chart. The areas and values in the table change their color when the ATR level is reached. Draws the
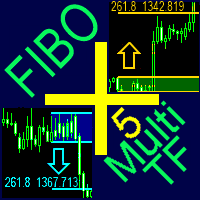
A ready-made multitimeframe trading system based on automatic plotting and tracking of Fibonacci levels for buying and selling any symbol.
Advantages Determines the trend direction based on a complex of 14 indicators ( Cx ), extremums of ZigZag ( Z ), RSI ( R ), Impulse ( I ) Displaying the values of 14 indicators comprising the trend direction ( Cx ) Plotting horizontal levels, support and resistance lines, channels View the plotting option of Fibonacci levels on any timeframe, with the abilit
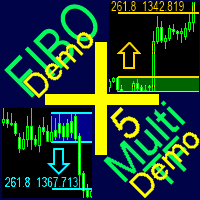
A ready-made multitimeframe trading system based on automatic plotting and tracking of Fibonacci levels for buying and selling any symbol. Demo version - calculation of the last 390 bars is not performed.
Advantages Determines the trend direction based on a complex of 14 indicators ( Cx ), extremums of ZigZag ( Z ), RSI ( R ), Impulse ( I ) Displaying the values of 14 indicators comprising the trend direction ( Cx ) Plotting horizontal levels, support and resistance lines, channels View the plo
FREE

This utility changes the behavior of auto-scroll. It removes the need to manually disable and re-enable the auto-scroll function.
Main features Disables auto-scroll - when the screen is scrolled backwards to look at the price history. Enables auto-scroll - when moved back to current history.
Inputs None.
Note I recommend testing when markets are open, since auto-scroll works when there are incoming ticks.

TCP - Trader Control Panel is an extension to build into MetaTrader 5 manual methods to control open positions. It adds opening and closing position feature as well as user-friendly monitoring dashboard, money and risk management when opening. Opening and closing positions are done by mouse by interactively placing stop loss line on appropriate level or by pressing predefined keys on keyboard. Before opening a new position, the EA calculates such lot size, which will guarantee you no more losses

This is a series of gauges that can be loaded on any Chart time frame. You can use this gauge indicators to decide when to enter and exit market with high degree of confident. Gauge No 1: Ichimoku Kinko Hyo Tenken Sen Crosses Kijun Sen. This will tell Bull and Bear and the timing to enter market. When the value move from above 0 towards below 0, the Tenken Sen line is moving to cross the Kijun Sen line and appears value is the Delta for the difference. Same goes to the opposite. The positive val
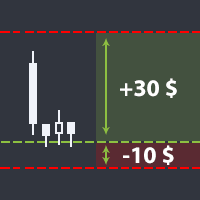
The utility helps open a deal with a stop loss that does not exceed the specified amount, or to refrain from it altogether. That is, it determines the number of lots to open the deal so that the stop loss is as close as possible to the specified amount in USD without exceeding it. For example, it will be indispensable when trading according to the Gerchik strategy. That is, when trading based on risks, with a fixed risk and a fixed take profit relative to stop loss. For example, if you always op

Pointer synchronization MT5 is an indicator with which the pointer can be synchronized in all the visible graphics of the terminal. It shows a cross cursor on all the visible graphics of the terminal, in position relative to the cursor of the active graph. To activate the indicator, simply press the button that appears in one of the corners of the chart once the indicator is added to the chart. To deactivate the indicator, simply press the button again. Once the indicator has been deactivated,
Renko indicator helps develop Renko charts on different symbols.
Advantages Drag and drop the indicator on M1 timeframe of the symbol chart Realtime updates Indicator can be used for Expert Advisors and technical analysis Backtest your strategy using Renko indicator
Parameters BOX SIZE: Input the number of box size. The box size reflects the difference of the symbol price. So, a 50 box size would reflect a 5 pip value difference in a currency pair symbol Show Wicks: If true , high or low of th
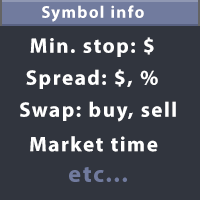
This utility displays the information required for making trades on each opened chart. For example: spread value, swap value; triple swap day; session closing time; ATR of the symbol by Gerchik; total profit/loss for the current symbol; the number of trades made earlier; the percentage change in the quotes of 6 selected instruments; and much more. The spread value is always shown. The rest of the information is displayed depending on the settings: Show total orders at the moment (long, short) .
Check Online-Status monitors your terminal. If its connection to the server is interrupted for longer time, you will receive an email and/or a push notification, depending on what your settings. You can find out how long the terminal has been offline and can judge the quality of your brokers and/or the provider of your VPS after some time. Remember, the terminal manages and controls your money. Everything hangs in the air if it has no connection to the server! Check Online-Status displays the th
The utility is designed to display on the chart the margin zones built on the basis of margin requirements for futures of the Chicago Mercantile exchange (CME). These margin zones are good levels of resistance and support, as seen in the screenshots.
How to use To trade on margin zones, use the following rules: buy after the day has closed above one of the zones to the next zone; sell after the day has closed below one of the zones to the next zone; after opening a sell trade, place limit sell

This DYJ OonClickClose help you to close all orders having profit immediately with only ONE CLICK, its work is very fast. You can choose which symbol you want or close all symbols so it will helpful for you in your trading to manage trading faster. This EA can quick close all Buy and Sell Orders by a selected symbol or total, And delete all pending orders. It includes dynamic target profit tracking function. The software has manual transaction buttons buy and sell. It is a management softw
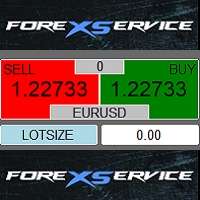
One Click Trader is a tool designed for MetaTrader 4 platform, which enables you to take your trading to the next level. It enables you to open, manage and close your trades in simple an efficient way by just one click of your mouse button. "-" , "+" change OCT window size Up arrow minimizes the OCT panel Down arrow maximizes the OCT panel Right arrow displays the next panel with additional features Left arrow hides the panel with additional features Red SELL button enables you to open s

This QuickClose help you to close all orders having profit immediately with only ONE CLICK, its work is very fast. You can choose which symbol you want or close all symbols so it will helpful for you in your trading to manage trading faster. This EA can quick close all Buy and Sell Orders by a selected symbol or total, And delete all pending orders. This SymbolButton is designed for closing orders. There is available Manual and Automatic closing functions. Automatic closing function will close t

Telegram Notify MT5
Telegram Notify MT5 is an utility tool to bridge your MetaTrader 5 activities to your Telegram chat/channel. It is useful for monitoring your MetaTrader 5 account by sending a notification to your particular Telegram chat/channel when someone/EA is placing trades, modifying order's TP/SL, closing trades and etc. This EA does not place any trade for your account. This EA also could be a convenient tool for monitoring other's EA trading activities or a tool for publishing your

Exit based Indicator - What is it? Exit your open positions based on up to 10 indicators. Even those you buy in Market !!! Use any indicator that provides buffer values (most of them output buffers). You can use any available buffers and even compare various indicator values. Selectors for exiting Buy Positions and Sell Positions are separate. The EA works in AND or OR mode. You can combine multiple instances to create elaborate rules. NO BROKER SIDE STOP LOSS IS USED.
Usage Ideas / Examples -

Telegram ChartSnap MT5 is an utility tool to bridge your MetaTrader 5 activities to your Telegram chat/group/channel. It will screen shot your MetaTrader 5 chart and send it to your dedicated Telegram chat/group/channel through a Telegram bot. The whole process will keep repeating based on a time cycle that predetermined by the user. It is a convenient tool for those who like to get access to their favorite system/dashboard that only available at MetaTrader Desktop. Beside that, trader can easi

The Expert Advisor is a great tool that allows you to control your trade with ease and precision. The tool can be moved in the graphs and offers the following characteristics:
Instant order entry with a single click. Entry of pending orders using price tags and trend lines. Instant order closure with a single click. Instant order closure using trend lines as output levels that the broker can not see. We can modify the way to enter and exit the market, allowing us to choose the way to do it. For

The script opens a separate window and displays information about the current open positions in it.
The informer will be useful to those who operate with a large number of positions open on different instruments in different directions.
It allows you to quickly decompose the loading of the deposit by instruments, visually identify the most tense places in the aggregate position. For the exposed stop orders, it calculates the total risks and goals.
The utility refers to probabilistic analysis tools, in particular the Monte Carlo method. The Monte Carlo method is defined as the simulation of processes in purpose to evaluate their probabilistic characteristics and apply them to the solvable task.
Operation features The simulation uses a tick model with the subsequent transformation to the candles form, as a model as close as possible to the real market process. The utility generates a stream of a random tick sequence until a result with th

This indicator shows the remaining time for the candle to close, even if the price does not change in value, the clock keeps counting backward. You can also program price alert levels using trend lines.
It can be used together with Expert Advisors and other panels, such as Controller without limit MT5
MT4 version
Instructions To set a price alert level, you must draw a trend line. Once the object has been drawn, it must be named so that the indicator recognizes the object. In the name

Effortless Trade Management – Automatic Stops & Trailing Take the guesswork and manual effort out of risk management. Our Automatic Stops tool continuously monitors your account and instantly applies your predefined stop loss, take profit, partial close levels (scaling out), and trailing stop to every new trade. Once the EA is attached to a chart, it automatically sets and manages these levels for any new trade on that currency pair – so you never have to enter them manually again. Key Featu

This utility ensures a real-time synchronization of multiple charts. Any event of a graphical object creation/modification/deletion, chart scrolling and zooming is copied from the current source chart to one or more receiving charts. Note: demo-version of this product doesn't work in the backtester! ______________________________________________________________ Settings: Synchronize with - select the receivers: Same symbol - all charts with the same symbol; Same symbol - all charts with the same
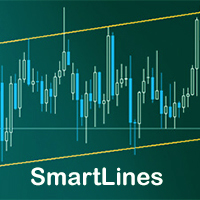
SmartLines allows you to open orders using trend lines. SmartLines for MT4 https://www.mql5.com/ru/market/product/25875
Now you have the opportunity to control breakthroughs of the trend corridor automatically and without delay. As soon as the price crosses your trend line with your settings, the order is automatically opened. You will not miss the moment of the trend change. The principle of working with SmartLines is similar to placement of pending orders. However, pending orders only have th
Данный софт позволяет вам управлять своими параметрами риска и мани менеджмента. Вы можете задавать параметр риска как на текущий капитал, так и на предполагаемый уровень депозита, что позволит контролировать риски в каждой сделке и в каждом активе. Open order script также позволяет задать фиксированный объём открытия операций и вести торговлю «в один клик» благодаря реализации дополнительных кнопок Sell / Buy непосредственно на график. Особенность скрипта
Ключевой особенностью и характеристик

SonicTradeCopier: (Best for scalping)
Easy Fast Reliable trade copier. Copy trades from one terminal to an other (internet copy feature coming soon.)
MT4 to MT4. MT4 to MT5. MT5 to MT5. MT5 to MT4. MT4/MT5 to any other platform copy possibility for custom made solutions. Reverse trading. Advance filters for traders.
Features:
(Setting up copying policies) Sender only has to setup signal name and start sending signals [ You must start signal sender first always ]. Receiver sets up signal nam
The utility is entended for preparing information for the Sprint EA . Preparing information for different financial instruments needs the EA to be attached to a chart of the corresponding financial instrument. The EA prepares information in online mode only. Input Parameters Symbol Name - name of financial instrument of the chart the EA is attached to. Connection Control - control of disconnections with the trade server: true - enable. false - disable. Send Mail - send an e-mail notification abo
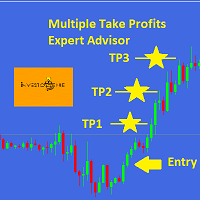
This EA is designed for MULTIPLE TAKE PROFITS options based on User's order management.
ABOUT EXPERT ADVISOR:
The expert advisor is designed to help user take multiple profits on single order. The multiple take profits can be allocated a fixed percentage based on user's preferences. The user is required to set an entry level in price and set target percentages and target prices. The stop loss and price to close options helps user in risk management.
ADVANTAGES:
Option of Taking Profits till

While you are trading, Auto StopLoss Defender doing all the routine work. "Must have" for scalping. Best way to save account balance in case of force majeure.(Internet connection loss, power outage, sharp change in price direction) The Utilite automatically adds a stop loss to open and pending orders that have no stoploss set. The anti-requote system is built into the Utilite. That means the stop loss will be registered anyway! In the settings you can set any stop loss begin from 0.0001 (If yo
MetaTraderマーケットはMetaTraderプラットフォームのためのアプリを購入するための便利で安全な場所を提供します。エキスパートアドバイザーとインディケータをストラテジーテスターの中でテストするためにターミナルから無料のデモバージョンをダウンロードしてください。
パフォーマンスをモニターするためにいろいろなモードでアプリをテストし、MQL5.community支払いシステムを使ってお望みのプロダクトの支払いをしてください。

取引の機会を逃しています。
- 無料取引アプリ
- 8千を超えるシグナルをコピー
- 金融ニュースで金融マーケットを探索