YouTubeにあるマーケットチュートリアルビデオをご覧ください
ロボットや指標を購入する
仮想ホスティングで
EAを実行
EAを実行
ロボットや指標を購入前にテストする
マーケットで収入を得る
販売のためにプロダクトをプレゼンテーションする方法
MetaTrader 5のためのエキスパートアドバイザーとインディケータ - 21

Take Control of Risk with Smart Trailing Stop Manager for MetaTrader 5 Looking for MetaTrader 4 version? I t is available separately in the Market: Smart Trailing Stop Manager MT4 Tired of missed profits or manual stop loss adjustments?
Smart Trailing Stop Manager is a powerful utility for MetaTrader 5 designed to automate your trailing stop, breakeven, partial close, and SL management. Whether you're a discretionary trader, signal follower, or scalper — this tool helps lock in gains and cut l

Modified oscillator MACD. A classic indicator that combines a trend indicator with an oscillator to detect entry points. Has a multi-timeframe panel and 3 types of notifications
Benefits:
Works on all instruments and timeseries Trend indicator with oscillator for inputs Multi-period panel on all timeframes Pluggable arrows when signals appear Three types of notifications: push, email, alert
MT4 version -> HERE / Our news -> HERE
How the indicator works:
AW Classic MACD - Indicator o
FREE

Expert Rider – Precision Trend-Riding Expert Advisor for MT5 ExpertRider is an Expert Advisor for MetaTrader 5. It analyzes price data on multiple timeframes to identify trading opportunities. The system manages positions and adjusts them according to market conditions. The Expert Advisor reviews market structure on short, medium, and long timeframes. It identifies key levels, trend directions, and volatility changes. Entries occur when price reaches specific zones and conditions align. Positio

In the "Masters of Risk" trading system, one of the main concepts is related to places where markets change direction. In fact, this is a change in priority and a violation of the trend structure at the extremes of the market, where supposedly there are or would be stop-losses of "smart" participants who are outside the boundaries of the accumulation of volume. For this reason, we call them "Reversal Patterns" - places with a lot of weight for the start of a new and strong trend.
Some of the imp

This indicator allows to display Renko charts in the indicator window. Renko charts show only price movements that are bigger than the specified box size. It helps to eliminate noise and allows to focus on main trends.
Time is not a factor here. Only price movements are taken into account. That's why Renko chart is not synchronized with the main chart it is attached to. Indicator works in two modes: CLOSE - only close prices are taken into account while building the chart HIGH_LOW - only high/l
FREE

このインジケーターは、MetaTrader 4 および 5 用のインタラクティブなエリオット波動ラベリングツールです。
チャート上のメニューから、ラベルのサイズ、色、波動の種類(ABC修正波、5波のインパルス、またはWXY構造)を選択し、チャート上に直接波動ラベルを手動で配置することができます。
チャートを1回クリックするだけで、選択した価格と時間の位置に適切な波動ラベルが順番に配置され、エリオット波動構造を視覚的に整理・把握するのに役立ちます。 気に入ったら評価してください! このインジケーターは、MetaTrader 4 および 5 用のインタラクティブなエリオット波動ラベリングツールです。
チャート上のメニューから、ラベルのサイズ、色、波動の種類(ABC修正波、5波のインパルス、またはWXY構造)を選択し、チャート上に直接波動ラベルを手動で配置することができます。
チャートを1回クリックするだけで、選択した価格と時間の位置に適切な波動ラベルが順番に配置され、エリオット波動構造を視覚的に整理・把握するのに役立ちます。 気に入ったら評価してください!
FREE
Range Breakout Expert Advisor (EA) for MetaTrader5
PS : This Expert Was Downloaded over 1200 Time , When we reach 2000 Download i ll increase the Price
Key Features: Fixed Lot Size / Martingale Option: Fixed Lot Size:* The EA allows you to set a constant lot size for each trade. Martingale Option:* Alternatively, you can enable the Martingale strategy, which increases the lot size after a losing trade to recover losses. Trading Between Specific Times: The EA only opens trades with
FREE

ADX インジケーターは、トレンドとその強さを判断するために使用されます。価格の方向は +DI と -DI の値で示され、ADX 値はトレンドの強さを示します。+DI が -DI より上であれば、市場は上昇傾向にあり、反対であれば下降傾向にあります。ADX が 20 より下であれば、明確な方向性はありません。インジケーターがこのレベルを突破するとすぐに、中程度の強さのトレンドが始まります。40 を超える値は、強いトレンド (下降トレンドまたは上昇トレンド) を示します。
平均方向性指数 (ADX) インジケーターの複数通貨および複数時間枠の変更。パラメータで任意の通貨と時間枠を指定できます。また、インジケーターは、トレンドの強さのレベルが交差したとき、および +DI と -DI のラインが交差したときに通知を送信できます。ピリオドの付いたセルをクリックすると、このシンボルと期間が開きます。これが MTF スキャナーです。
通貨強度メーター (CSM) と同様に、ダッシュボードは、指定された通貨を含むペア、またはその通貨を基本通貨とするペアを自動的に選択できます。インジケーターは、
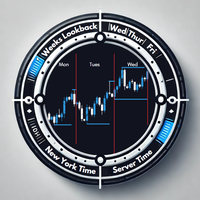
Overview The Daily Session Separator indicator is a powerful tool designed to enhance your trading experience by clearly marking daily trading sessions on your chart. It helps traders visualize daily boundaries, session highs and lows, and essential day-specific data to make informed decisions. With its seamless integration into any chart and dynamic adaptability, this indicator is a must-have for traders who rely on precision and clarity. Key Features Daily Session Separators Automatically adds
FREE

This indicator is designed to detect high probability reversal patterns: Double Tops/Bottoms with fake breakouts . Double top and bottom patterns are chart patterns that occur when the trading instrument moves in a similar pattern to the letter "W" (double bottom) or "M" (double top). The patterns usually occur at the end of a trend and are used to signal trend reversals very early. What this indicator detects: This indicator detects a special form of Double Tops and Bottoms, so called Double To

初心者やエキスパートトレーダーに最適なソリューション!
このインジケータは、独自の機能と秘密の数式を組み込んだ、ユニークで高品質かつ手頃な価格のトレーディングツールです。たった1枚のチャートで28の通貨ペアのアラートを表示します。新しいトレンドやスキャルピングチャンスの引き金となるポイントを正確に把握することができるので、あなたのトレードがどのように改善されるか想像してみてください!
新しい基本的なアルゴリズムに基づいて構築されているため、潜在的な取引の特定と確認がより簡単になります。これは、通貨の強さや弱さが加速しているかどうかをグラフィカルに表示し、その加速のスピードを測定するためです。加速すると物事は明らかに速く進みますが、これはFX市場でも同じです。つまり、反対方向に加速している通貨をペアにすれば、利益を生む可能性のある取引を特定することができるのです。
通貨の勢いを示す縦の線と矢印は、あなたの取引の指針となるでしょう。 ダイナミックマーケットフィボナッチ23レベルはアラートトリガーとして使用され、市場の動きに適応します。もしインパルスが黄色のトリガーラインに当たった場

REMEMBER THAT TO OBTAIN POSITIVE RESULTS YOU MUST USE A RAW ACCOUNT WITH LOW SPREADS, TRADE ON SYMBOLS WITH LOWER SPREADS BETWEEN BID/ASK PRICE, ALWAYS FOLLOW THESE 3 FUNDAMENTAL RULES IN YOUR SET:
- TP AND DISTANCE MUST HAVE THE SAME VALUE
- SL MUST ALWAYS HAVE A DOUBLE VALUE OF TP AND DISTANCE
- LOT MULTIPLIER MUST HAVE A VALUE GREATER THAN 2 ( BETTER 3 ) WARNING: I would like to point out that the close function closes all open trades in the account , even those opened manually or by other
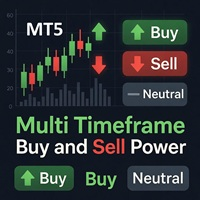
Multi Timeframe Buy and Sell Power
The Multi Timeframe Buy and Sell Power indicator for MetaTrader 5 is a versatile tool designed to provide traders with a clear visual representation of market pressure across nine standard timeframes, from M1 to MN1. By aggregating buy and sell strength percentages derived from recent price action and tick volume, it helps identify potential trends, reversals, and neutral conditions in real-time. The indicator displays this information in a compact dashboard
FREE

Weis Wave Scouter Basic は、MetaTrader 5 用に設計された当社の有名なインジケーターの基本バージョンであり、Wyckoff 手法と VSA(ボリュームスプレッド分析)の概念を手軽かつ効率的に探求したいトレーダー向けに設計されています。ボリュームウェーブの読み取りに基づいており、市場の動きを明確に特定でき、リチャード・ワイコフが教えた「労力と結果」「需給」の原則に焦点を当てています。 Weis Wave Scouter Basic を使用すると、標準カラー(Classic)テーマの直感的なヒストグラムで上昇波と下降波を視覚化でき、トレンドや反転を簡単に解釈できます。Brick Size や Volume Scale Factor などの基本的な調整が可能で、ティックボリュームまたは実際のボリュームを選択できるため、FX、株式、暗号資産などさまざまな市場で柔軟に使用できます。初心者やシンプルなツールを求めるトレーダーに最適な Weis Wave Scouter Basic は、Wyckoff と VSA の技術を取引に活かすための理想的な出発点です。 We
FREE

TradeInfo is a utility indicator which displays the most important information of the current account and position.
Displayed information: Information about the current account (Balance, Equity, Free Margin). Current spread, current drawdown (DD), planned profit, expected losses, etc. Number of open position(s), volume (LOT), profit. Today’s and yesterday’s range. Remaining time to the next candle. Last day profit information. MagicNumber filter. Comment filter.
Indicator parameters: ShowPro
FREE

A Price Action Trading Expert Advisor (EA) is a type of automated trading system designed to execute trades based on price action patterns and signals. Price action trading focuses on analyzing historical price movements to identify potential future price movements without relying on conventional technical indicators.
Here are key aspects and characteristics of a Price Action Trading Expert Advisor:
1. **Strategy Based on Price Action Patterns**: The EA is programmed to identify and trade bas
FREE

An ICT fair value gap is a trading concept that identifies market imbalances based on a three-candle sequence. The middle candle has a large body while the adjacent candles have upper and lower wicks that do not overlap with the middle candle. This formation suggests that there is an imbalance where buying and selling powers are not equal. Settings Minimum size of FVG (pips) -> FVGs less than the indicated pips will be not be drawn Show touched FVGs Normal FVG color -> color of FVG that hasn't
FREE
ENGLISH DESCRIPTION (MQL5 Standard Optimized) Product Name: Vortex Nomad Aegis [Subtitle: KAMA Trend | Vortex Energy | Aegis Elasticity Shield] Introduction Vortex Nomad Aegis is a scientific trend-following system designed with a built-in safety mechanism: Price Elasticity Check . Most trend bots fail because they buy at the top (FOMO) just before a pullback. This EA solves that problem using the "Aegis Shield"—a dynamic filter that blocks entries when the price is mathematically "overextended"
FREE
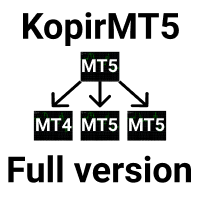
KopirMT5 (CopierMT5) - transaction copier for the MetaTrader 5 terminal, copies (synchronizes, duplicates) transactions from hedge accounts (copier, copy dealers).
Supports copying: MT5 <-> MT5, MT4 -> MT5 Hedge, MT5 Hedge -> MT4 Does not support copying MT5 Hedging < - > MT5 Netting, MT4 < - > MT5 Netting Free version for test
Why exactly our product? The copier has a high speed and is not dependent on ticks. Copy speed - less than 0.5 sec. Transactions are copied with high accuracy, the

BotAGI is the first next-generation AGI Forex robot. It is a basic version of BotGPT, simplified and without options, it is ideal for beginners. There is absolutely nothing to do, it's 100% automated, simply indicate your risk (in percentage) per trade and the EA is ready. Optimized for the EURUSD pair. Its success rate is exceptional, download it and see the results for yourself ! Is an intraday, he prefers to take his time and not miss his target. It performs an average of 5 to 15 transaction
FREE

Triangle Pattern Gann EA v3.4 - Trade Like the Legendary W.D. Gann Harness the Power of Geometric Price Patterns & Sacred Ratios Are you ready to trade with one of the most powerful pattern recognition systems ever developed? The Triangle Pattern Gann EA v3.4 brings the legendary wisdom of W.D. Gann into the modern algorithmic trading era.
What Makes This EA Exceptional? Based on Proven Gann Methodology W.D. Gann was one of history's most successful traders, achieving over 90% accuracy u
FREE

PHantom N1 EA – 視覚的市場処理を備えたインテリジェントなエキスパートシステム PHantom N1はデータ駆動型アプローチに基づいており、数年にわたり膨大な過去の市場データを使ってトレーニングされています。
開発環境には、実際の価格変動、ボラティリティフェーズ、構造的な市場変化、外的要因が含まれていました。
使用されたのは従来のテクニカル指標だけでなく、視覚的なチャートパターン、ローソク足形成、オーダーフローなどのマルチモーダルデータも活用されました。 目標は、市場のダイナミクスを認識するだけでなく、予測する能力を持つモデルを開発することでした。
PHantomは継続的に学習を行い、新しい市場環境に適応します。固定的な条件に依存することはありません。 価格は販売されたライセンス数に応じて継続的に上昇します 1. 視覚的市場状況の把握 PHantom N1 EAの特筆すべき機能は、市場の現状を視覚的にスナップショットとして取得する能力です。この視覚的アプローチは、人間のチャート分析行動を模倣しています。
EAは定期的に高品質なチャートのスクリーンショットやデータイメージを

NOTE: Turn Pattern Scan ON
This indicator identifies Swing Points, Break of Structure (BoS), Change of Character (CHoCH), Contraction and Expansion patterns which are plotted on the charts It also comes with Alerts & Mobile notifications so that you do not miss any trades. It can be used on all trading instruments and on all timeframes. The non-repaint feature makes it particularly useful in backtesting and developing profitable trading models. The depth can be adjusted to filter swing points.
FREE

SMA Reentryとは SMA Reentry は、2本の単純移動平均線(SMA)—高速と低速—を利用し、トレンドに沿った再エントリーポイントをシグナルするプロフェッショナル向けインジケーターです。低速SMAで定義されたトレンドの中で、価格が高速SMAを再び上抜け・下抜けしたタイミングを明確に表示します。プルバック(pullback)、ブレイクアウト(breakout)、トレンド回帰シグナルを求めるトレーダーに最適なツールです。 動作原理 高速SMAと低速SMAのクロスにより主要なトレンドを特定 価格が高速SMAを再び上抜け・下抜けした際、矢印でプルバックや再エントリーシグナルを表示し、トレンド継続を確認 期間、ラインや矢印の色、矢印の価格からの距離など、各種入力をカスタマイズ可能 チャート上に2本のSMAを直接表示し、視覚的分析をサポート おすすめユーザー トレンドフォロー戦略を利用したい方、またはプルバック後の最適なエントリーポイントを探す方 ブレイクアウトや再エントリー戦略を利用する方 調整後にトレンド回帰する重要ポイントを見つけたい方 裁量トレーダー、システムトレーダーどち
FREE

This indicator recognizes a special type of Inside Bar formation which is formed by a big Master candle followed by 4 smaller candles (please see the strategy explanation below). Features Plots buy/sell stop lines on the chart as well as well as take profit and stop loss levels. The TP/SL levels are based on the Average True Range (ATR) indicator. Object colors are changeable. Sends you a real-time alert when a Master candle formation is identified - sound / popup / email / push notification. On

MonsterDash Harmonics Indicator is a harmonic pattern dashboard. It recognizes all major patterns. MonsterDash is a dashboard that displays all detected patterns for all symbols and (almost) all timeframes in sortable and scrollable format. Users can add their own user defined patterns . MonsterDash can open and update charts with the pattern found.
Settings MonsterDash's default settings are good enough most of the time. Feel free to fine tune them to your needs. The color settings are for tho

Advanced SatoshiMind AI Bitcoin Robot MT5 - JUST PLUG & PLAY ON BTCUSD CHART in M5 time- For Back test Use 1 Mint OHLC Mode Upgraded with Best AI & Neural Network Features for Higher Accuracy in BTCUSD Trading- MUST BUY THIS PROFITABLE AI ROBOT!! - Upgraded version Date 22Dec 2025 Introducing Advanced SatoshiMind AI Bitcoin Robot MT5 — a next-generation Expert Advisor built to trade Bitcoin/BTCUSD with intelligent precision, using a unique blend of technical mastery and AI-driven decision-maki

ICT Concept PRO P EA - SMCトレーディング自動化 機関投資家のトレーディング概念とアルゴリズムの精度の融合 SET FILE: MQL5 CHAT LINK チャットリンク ON SALE: $245.00 ONLY - VALID FOR NEXT 10 SALES NEXT PRICE $1277.00 HURRY 概要 ICT Concept PRO P EAは、Inner Circle Trader(ICT)手法を採用するトレーダー向けに設計された高度なエキスパートアドバイザーで、市場構造、流動性エンジニアリング、機関投資家の注文フローを理解するための洗練されたアプローチです。外国為替ペア(EURUSD、GBPUSD、XAUUSD)、インデックス、商品向けに構築されたこのEAは、複雑なICTの概念を軍事レベルの実行基準で自動化されたトレーディングシグナルに変換します。 プロップファームのトレーダー、機関投資家の戦略愛好家、Smart Money Conceptsを通じて優位性を求めるアルゴリズムトレーダーのために設計されたICT Concept PR

FOR CRASH 500 ONLY!! MT5
*This is a smooth heiken ashi setup meant to be used on CRASH 500 in combination with other indicators. *You are welcome to test it on other markets aswell. *I will be posting other indicators aswell to help with trading the crash 500 market. *You can use this to help smooth out price if you do struggle with reading the charts as is. * Just note heiken ashi doesnt represent real price action only smoothes it out for ease of read.
FREE

SP500 Sniper ― エキスパートアドバイザー(EA)概要 SP500 Sniper は、 S&P 500 指数 専用に開発された高度に専門化されたエキスパートアドバイザーで、 超高精度なエントリー , 厳格なリスク管理、そして実際の市場環境における安定したパフォーマンスを重視しています。 本戦略は、プロフェッショナル向けのアルゴリズム開発プラットフォーム StrategyQuant を用いて設計・開発されており、裁量的な判断や過度なカーブフィッティングを排除した、 データ主導かつ体系的なアプローチ を採用しています。 戦略概要 SP500 Sniper は、 トレンド構造とモメンタムの確認 に基づいて取引を行い、市場がすでに明確な方向性を示した後にのみ、高確率の取引機会を狙います。
短期的なノイズや単一のシグナルには反応せず、 確認された価格挙動 を待ってからエントリーします。 コアとなる取引ロジック 以下のすべての条件が同時に満たされた場合にのみ、取引シグナルが生成されます。 ケルトナーチャネル(Keltner Channel)の構造
ケルトナーチャネルの 上限・下限の両
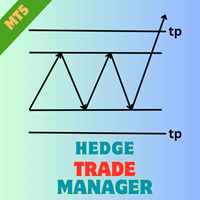
Hedge Trade Manager MT5でヘッジ戦略を強化しましょう。この洗練されたエキスパートアドバイザー(EA)は、逆行する価格変動に対抗するためにヘッジ取引を自動化するように設計されており、2010年代にフォレックスブローカーが反対ポジションを許可することで利益を固定または不確実なトレンド中の損失を制限するヘッジ技術に根ざしています。MQL5やForex Factory、Redditのr/Forexなどのトレーディングフォーラムでその柔軟な設定と強固なリスク保護が評価されており、このEAはフォレックス主要ペア、インデックス、暗号通貨のようなボラティリティの高い市場でスキャルパーやスイングトレーダーに好まれています。ユーザーは、潜在的なドローダウンを管理可能なシナリオに変える能力を称賛し、ダイナミックなロット進行とエクイティベースの出口により全体のリスクを25-40%削減することが多く、回復戦略を試みる初心者ヘッジャーや、多EA設定を統合して多様なポートフォリオを構築する経験豊富なプロに最適です。 Hedge Trade Manager MT5は、取引が指定された損失距離(
FREE

Elevate your trading with advanced Moving Average crossover strategies. Building on the success of the AI Momentum Scalper, the MA Momentum Scalper delivers a refined approach to market entry using the power of Moving Average crossovers to identify high-probability trading opportunities.
$499 (6 copy remaining at this price, final price will be $999)
Why Moving Average Crossovers Work
The MA Momentum Scalper capitalizes on one of trading's most reliable technical patterns - Moving Average cro

This is the Cumulative Volume Delta (CVD) , it's an indicator that calculates the long and short volumes plotting it then as a line on the chart, the most efficient way to use this indicator is by comparing the CVD line to the current chart and looking at the Divergence beetween the two of them, so that you can identify fake-outs and liquidty sweeps. for example in the picture that i put below you can see that the price has made a lower low but the CVD didn't, that means the volumes didn't suppo
FREE

ZEUS FX – Fully Automated Trading System for XAUUSD (Gold) 2 copies are priced at 150$, the next price is 250$. ZEUS FX is a fully automated trading solution specifically designed for the gold market (XAUUSD).
Unlike traditional indicators, ZEUS FX uses a sophisticated algorithm that monitors price volatility and trading momentum during the calmer Asian trading sessions—while remaining highly user-friendly. The strategy is built on a Breakout & Recovery model. It identifies strong price movement

Traders Toolbox Premium はオールインワンツールです それらの戦略と計算を自動化するために、一般的な取引戦略に関する広範なトレーニングに基づいて作成されました。 (Jason Kisoglooによって設計およびプログラムされました) 特徴: 19個々の信号 -これらの信号の それぞれ は、ニューラルネットワークスタイルの構成でバイアスされ、最終的な/全体的な結果を構成します。 各信号には独自の設定が あり 、必要に応じてカスタマイズまたは最適化できます。 包括的なオン - 画面 - ディスプレイ -包括的な情報とツールチップを備えた6つのスナップアウェイパネル。 (パネルの境界線をクリックして、折りたたんだり、離したりします...設定は機器ごとに自動的に保存されます): 信号パネル -バイアス情報と信号の詳細を含む信号分析を表示します。 ニュースパネル -アップ、さらにはニュース来 トン の に基づいて 予測 の イベントへのカウントダウンと現在の機器に影響を。 (内部M T5 エコノミックカレンダーと 外国為替ファクトリースクレー
** All Symbols x All Time frames scan just by pressing scanner button ** After 18 years of experience in the markets and programming, Winner indicator is ready. I would like to share with you! *** Contact me to send you " Trend Finder indicator " free, instruction and add you in "M1 Signal Scanner group" for sharing or seeing experiences with other users. Introduction: M1 Signal Scanner is the indicator designed scalping M1 time frame to detect Small trend switching in the direction

Big sale 50% OFF! Price $299. Regular price $599 All our signals are now available on myfxbook: click here Unique set files and all recommendations are provided free of charge. All future updates of the adviser are included in the price. After the purchase, contact me and I will help you install and configure the robot correctly. I will also share with you information on how to get a free VPS from a reliable broker. GOLD EAGLE is a swing strategy that is for the market in flat, which is 80-

"CHOMPER PULLBACK"
Trend Pullback Reversed – Aggressive Reversal Strategy Trend Pullback Reversed is a high-performance Expert Advisor designed for M5/M15 trading on XAUUSD, Forex, and other major pairs. This EA implements an aggressive reversal pullback strategy , detecting deep pullbacks in trending markets and executing trades against the classic pullback signal , turning potential continuations into high-probability reversals. Key Features: Reversed Signal Logic: Buys on classic sell-pullba
FREE

Simple Renko Chart Generator. Just place the EA on the desired symbol, configure and hit OK, your Renko Chart is generated. You can attach any MT5 compatible indicator or template to the renko chart and perform your technical analysis.
Settings: Origin Symbol Custom Symbol Type (Pips, Ticks, Points, R) Brick Size Show Wicks Brick Open Time Asymmetric Reversals Chart Mode Refresh Ratio Watch Market Book History Start Date History Type (1 minute OHLC, Real Ticks) * Strategy Tester: Use 1 minut
FREE

Golden Eagle Pro EA 概要
Golden Eagle Pro EA MetaTrader 5プラットフォーム用の強力な自動トレーディングアドバイザーで、複数のインジケーターとマルチタイムフレーム分析(D1のMA、M30のATR、M5のFractals)を組み合わせて使用します。このアドバイザーにはリスク管理のための柔軟な設定(固定ロット、残高に対するパーセント、リスクレベルの選択)や、トレーリングストップおよびブレークイーブン機能が組み込まれています。このプログラムはテストに成功し、金の先物およびXAU/USDペアでの取引に推奨されています。アドバイザーは非常に柔軟で、さまざまな金融商品とタイムフレームで取引でき、市場の状況に応じてパラメーターを最適化することができます。
限定オファー! Golden Eagle Pro EA は特別価格で提供されています: • 最初の10件の購入 — 30 USD • 次の10件の購入 — 65 USD • 最終価格 — 1000 USD 注意:各段階で利用できるライセンスの数には制限があります! 1. 全体的なコンセプトと

トレーディングパネル,手動取引,注文管理,リスク管理,トレードマネージャー,ワンクリック取引,ストップロス,テイクプロフィット,部分決済,スキャルピング
JoOrderTrade Simple – MT5 用インテリジェント手動トレードパネル
重要:本ツールを正しく動作させるには、MetaTrader 5 の設定で「Algo Trading を許可する」を必ず有効にしてください。この設定が有効になっていない場合、パネルは動作しません。
重要なお知らせ :パネルが大きすぎたり小さすぎたりし、文字も同様に大きすぎる、または小さすぎる場合、または表示がずれている場合は、画面の解像度が原因の可能性があります。その場合、パネル設定内の 「BASE LAYOUT」 または 「BUTTON SIZES」 で、必要に応じて手動で調整してください。
英語またはポルトガル語を話し、ページがそれ以外の言語で表示されている場合は、MQL5 のページ言語を英語またはポルトガル語に変更してください。「概要」タブに、JoOrderTrade Simple トレードパネルの使い方を説明
FREE

The Range Breakout Expert Advisor is a professional-grade trading solution that capitalizes on intraday breakout opportunities. Unlike many other EAs that rely on complex grid or martingale strategies, this EA follows a clear, logical approach to market dynamics.
Please consider leaving a review if this tool is useful for you. Thanks! :)
Key Features: • Time-based range calculation for precise entry points • Risk-based position sizing for professional money management • Dual breakout strate
FREE

### Best Order Block Detector Indicator for MT5
The Order Block Detector is a technical analysis indicator designed for MetaTrader 5 (MT5). It identifies potential order blocks (OBs) in the market, which are key price levels where significant buying or selling activity has occurred, often acting as support or resistance zones. These blocks are detected based on volume pivots and market structure swings, helping traders spot areas of institutional interest for potential reversals or continuation
FREE

XAUUSD 向け エクイティベースのスイングトレーディングシステム 重要な情報 戦略タイプ エクイティベースのエクスポージャー管理によるスイングトレード(グリッドなし、マーチンなし、ナンピンなし) リスクレベル エクイティ保護、日次制限、エクスポージャーフィルターによりユーザーが管理 プロップファーム対応 日次および全体のエクイティ損失保護を内蔵 ブローカー要件 すべての MT5 ブローカー(ECN / RAW 口座を推奨) 設定の難易度 初心者向け(すべてのパラメータを調整可能) 製品概要 Equity Paragon EA は、XAUUSD(ゴールド)専用に設計された 管理型スイングトレーディングシステムです。 エクイティベースの保護フレームワークを使用し、 段階的な保護メカニズムによってエクスポージャー管理と利益保護を行います。 本 EA は、グリッド、マーチンゲール、ナンピン、 および高リスクな回復手法を使用しません。 リスクおよびエクスポージャーのすべての設定はユーザーが管理します。
Code2Profit EA チャンネルガイド 内部構造には、適応型ブレークイーブン、動

Divergence Matrix SE – スペシャルエディション
重要なダイバージェンスを正確に把握し、価格の潜在的な反転ポイントを瞬時に見抜く!
ダイバージェンスポイントを自動で表示し、マーケット分析をサポート—重要な動きを見逃すことはありません。 Divergence Matrix SE は MACD、MACDヒストグラム、ストキャスティクス のダイバージェンスを保持しており、軽量でシンプルな体験版を提供します。信頼性の高いシグナルを提供するため、ダイバージェンスは発生後 4本のローソク足後に表示 され、市場のノイズをフィルタリングしてより確実なシグナルを表示します。SE版はコア機能に絞った設計で、動作はスムーズ、インターフェースはシンプル—初心者にも最適で、プロのトレーダーの参考ツールとしても活用可能です。 SE版を使えば: ダイバージェンスの重要ポイントを自動で捉え、手動で探す必要なし 各ダイバージェンスの背後にあるトレンド変化を明確に理解 ダイバージェンス分析を素早く体験し、自分のトレード戦略に組み込む さらに多くのインジケーターや高度な機能を使いたいですか?
Lite
FREE

このエキスパートアドバイザー(EA)は、取引管理を簡素化するように設計されており、複数の便利なボタンにより効率的なポジション管理を実現します。特に、複数のエントリーポイントを持つトレーダーや、注文を迅速に管理する必要があるトレーダーに最適です。EAの明確なインターフェースと直感的な操作性により、複雑な設定なしでバッチ操作が簡単に実行でき、手動介入によるエラーを削減します。
主な機能は以下のとおりです。
5ポイントの損益分岐点をワンクリックで設定可能。短期取引でリスクを迅速に確定させるのに最適です。
10ポイントの損益分岐点をワンクリックで設定可能。日中スイングトレードに最適です。
1000ポイントの損益分岐点をワンクリックで設定可能。BTC/USDのようなボラティリティの高い市場に最適です。
すべてのオープンポジションの損益分岐点に自動的に利益確定を設定し、オプションで2ピップのスプレッドを設定できるため、少額ながらも安定した利益を得ることができます。
すべてのオープンポジションをワンクリックで決済できるため、市場変動が発生した場合でも迅速にポジションを清算でき、資金の安

AEGIS Account and Drawdown Protector
AEGIS is an EA for MT5 that protects your trading account from large losses. It monitors equity in real time and closes all positions instantly when user-defined limits are reached. Limits can be set as percentage or fixed currency.
AEGIS also includes daily drawdown and daily loss protection with automatic reset at a chosen timezone . This is especially useful for prop firm traders where the daily cycle follows broker server time.
Additional protection

To get access to MT4 version please click https://www.mql5.com/en/market/product/130055  ; - This is the exact conversion from TradingView: "Ut Alart Bot Indicator". - You can message in private chat for further changes you need. Here is the source code of a simple Expert Advisor operating based on signals from Ut Bot Indicator . #property copyright "This EA is only education purpose only use it ur own risk" #property link " https://sites.google.com/view/automationfx/home " #property versio
FREE

50% Off Today Only! Price Goes Back Up at 11 PM (EST)
Marketkeys Trade Manager EA for MT5: Your Pathway to Forex Trading Mastery
What Traders Are Saying: "Much better than lots of other trade managers I've tested..." – R Vdr "Saves me time from manually calculating lots sizes and risks...amazing support." – Richard Obi Efficiency and precision are paramount in Forex trading. Marketkeys Trade Manager EA for MT5 offers just that - a seamless interface combined with robust risk management tools.

OBV MACD
Calculating MACD based on OBV data Features
3 outputs: MACD & Signal & Histogram 4 Colored Histogram Smoothing factor show/hide option for MACD & Signal lines Description
Among the few indicators developed for working with volume data, OBV (On Balance Volume) is the simplest yet most informative one. Its logic is straightforward: when the closing price is above the previous close, today's volume is added to the previous OBV; conversely, when the closing price is below the previous close
FREE
YM Adx Bollinger Martingale EA – Adaptive Trend & Recovery System YM Adx Bollinger Martingale EA is a fully automated trading system that combines three professional analytical tools:
ADX for trend detection, Bollinger Bands for volatility-based entries, and a smart Martingale recovery algorithm for balanced position management. This Expert Advisor identifies directional momentum with ADX, confirms trades through Bollinger Band breakouts, and applies a controlled Martingale logic to recover loss
FREE

ニュース フィルター プロテクターは、ニュース発表でオープンなポジション/注文が残らないように保護するように設計されています。ニュースが予測不可能なボラティリティや損失の拡大を引き起こす可能性がある今日の世界では、このようなツールはカレンダーを再度確認する必要がないため、心の平安に非常に役立ちます。
各パラメータがどのように機能するかを理解するために、EA の 入力 を見てみましょう。 --------------------------------ニュース設定---------------- ---------------- コンマで区切ってフィルターするニュースの通貨 (つまり、USD、EUR、GBP): フィルターで除外するすべての通貨 (MT5 カレンダー ウィンドウに表示されているように) をカンマで区切って入力します (以下でさらに指定したニュースをフィルターで除外できます)。ただし、最初にこれらのニュースに関連するすべての通貨を挿入する必要があります)。 キーワード #1 (フィルターする特定のニュース - 例: 「給与」): 各キーワードに、MT5 カレンダーの説明

The Volume Delta Indicator is a technical analysis tool that combines volume analysis with price action to identify potential trading opportunities. This indicator analyzes the difference between buying and selling pressure through candle structure analysis. Key Features Volume Delta Calculation : Measures buy/sell volume difference using candle structure analysis EMA Smoothing : Applies exponential moving average to smooth volume data Breakout Detection : Identifies price breakouts with volume
FREE

Auto Chart Refresh Indicator – MT5 Auto Chart Refresh インジケーターは、MetaTrader 5 のチャートを常に最新の市場データと同期させます。スキャルピング、デイトレード、リアルタイム精度を求めるトレーダーに最適です。 主な機能 リフレッシュ間隔を自由に設定(1 秒~任意、デフォルト 30 秒) 軽量かつ安定、CPU 負荷は最小 カウントダウン、最終更新時間、更新回数表示 柔軟な表示設定:文字色、サイズ、位置 全ての銘柄と時間足に対応 メリット 常にリアルタイム価格で取引可能 変動の激しい相場やニュース時も最新を保持 複数チャート・時間足を同期 裁量・自動売買どちらにも信頼できる信号を提供 Auto Chart Refresh – リアルタイム精度のためのプロ仕様ソリューション。

Gold Batukaru Propfirm is a special expert advisor for Gold/ XAU/ XAUUSD. This EA is designed with follow trend method for entry position. This EA is a single entry method use stop loss and take profit.
Performance : Gold Batukaru Propfirm has been tested at various backtest levels, but past results don't guarantee future performance. Please do your own research! Suggested use cent account if balance is not enough, because this EA need huge balance. This EA is designed for longterm, just set

Linear Regression Channel Pro The ultimate tool for statistical trend analysis. Automatically identifies the "Fair Value" of price and volatility extremes. Overview Linear Regression Channel Pro is a professional-grade indicator that automatically draws and updates the Linear Regression Channel for the current market trend. Unlike standard indicators that curve like Bollinger Bands, this tool draws precise straight-line channels based on the "Least Squares" mathematical method. It is designed fo
FREE

Koala FVGをMT5にご紹介します。プロフェッショナルなFair Value Gap(FVG)パターンインジケーターです。 Koala FVG: MT5で精密トレードへの道 Fair Value Gap(FVG)パターンの可能性を解き放つKoala FVG。これはMetaTrader 5向けに設計された最先端のインジケーターです。期間限定で、このプロフェッショナルツールに無料でアクセスできます。プレミアムインジケーターに移行する前にお試しください。 主な特徴: FVGパターンの検出: Koala FVGは、カスタマイズ可能な最小および最大サイズの基準に基づいて、資格のあるFVGパターンを知的に識別します。 ビジュアル表現: FVGゾーンを示すダイナミックな四角形を含む、クリアなグラフィカルディスプレイで視覚的な明瞭さを体験してください。三本のラインがFVGレベルをハイライトし、精密な分析が可能です。 矢印エントリーシグナル: トレードの機会を見逃さないでください。Koala FVGはエントリーポイントの明確な矢印シグナルを提供し、情報を元に意思決定できるようサポートします。 K
FREE
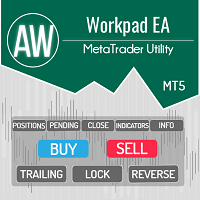
AW Workpad は、手動および半自動取引用に設計された多機能取引コントロール パネルです。保留中の注文、市場ポジションを管理し、幅広い統計データを提供するだけでなく、古典的な指標のグループの複数期間の分析を行うことができます。 このユーティリティは、次の 5 つのタブで表されます。 Positions, Pending, Close, Indicators, Info . 各タブには、注文や現在の市場状況に関する情報を処理するための独自の機能グループがあります。 MT4版→ ここ / 問題解決 -> ここ 機能または利点: このユーティリティは、すべての時間枠と任意のシンボル (通貨、指数、石油、金属、株式) で機能します。 各パネルのすべての要素には追加のラベルが付けられており、任意の要素にカーソルを合わせるだけで表示されます。 AW Workpad 取引パネルには、柔軟な設定と直感的なパネル インターフェイスがあります。 最も必要なすべての機能を 1 つの製品に。 取引パネルのタブ: Positions - このタブでは、成行注文を操作および維持できます
NightVision EA MT5 - is an automated Expert Advisor that uses night scalping trading during the closing of the American trading session. The EA uses a number of unique author's developments that have been successfully tested on real trading accounts. The EA can be used on most of the available trading instruments and is characterized by a small number of settings and easy installation. Live signal for NightVision EA: https://www.mql5.com/en/signals/author/dvrk78 Ask me for the recommended FX

ほとんどの「即時RSIダイバージェンス」シグナルは間違っています RSIダイバージェンスのインジケーターを使用したことがある方は、恐らくこうした経験をしたことがあるでしょう。
リアルタイムでダイバージェンスが表示され、一瞬は正しいように見えますが、
数本のローソク足が経過すると消えてしまいます。
後でチャートを確認すると、過去のシグナルが最初に見たものと一致しなくなっています。 これはユーザーの操作ミスではありません。
論理的な問題です。 確認されていない高値や安値に基づくダイバージェンスは、本質的に不安定です。 過去の履歴を書き換えないRSIダイバージェンスインジケーターを探している場合は、
この説明をぜひ最後までお読みください。 ———————————————————— インジケーター概要 このインジケーターは、RSIダイバージェンスを特定するために設計されており、即時の推測ではなく、確認済みの市場構造に基づいています。 価格とRSIの間の強気・弱気のダイバージェンスを自動的に検出し、RSIウィンドウ内に明確に表示します。 主な特徴: RSIダイバージェンス構造の自動検出 RSIウ
FREE

KING GOLD 3.40 (MT5) — XAUUSD Micro Scalper KING GOLD 3.40 is an Expert Advisor for MetaTrader 5 designed for XAUUSD (Gold). The EA is optimized for small lot trading and focuses on short-term entries under suitable market conditions. Recommended settings: Symbol: XAUUSD Timeframe: M1–M5 (depends on broker conditions) Lot size: 0.01 (example) Account type: Hedging Minimum deposit: from 300 USD (recommended for margin safety) Testing note:
This product has been tested in the MetaTrader 5 Strateg

98%の精度を誇るトレードシグナル 正確なエントリー、明確なエグジット | マルチタイムフレーム | 全市場対応
3つの簡単なステップで仕組みを確認 1️⃣ エントリー(買い/売りルール) シグナル発動:2本の線(X)がカラーゾーン(赤:買い、青:売り)の外側を横切る。
確認:価格ローソク足がクロスゾーンにタッチ(クロスゾーン中、またはクロスゾーンから1~5本以内)
代替エントリー(ノータッチ):
売りシグナル(青ゾーン):価格がクロスゾーンを上抜ける(ノータッチ)。
買いシグナル(赤ゾーン):価格がクロスゾーンを下抜ける(ノータッチ)。
2️⃣ エグジット(利益確定) 決済シグナル:黄色の線が現在のゾーンの外側をカーブ → エグジット。
3️⃣ リスク管理 ロットサイズ:口座残高1,000ドルあたり0.01ロット。
取引の分散:主要通貨ペア(例:USDJPY、EURGBP、GOLD)に分散投資。
このインジケーターがトレーダーに人気の理由 98% の精度 – 流動性と移動平均線クロスに基づく信頼性の高いシグナル。 あらゆる通貨ペア、コモディティ、時間足(1

The indicator is stable on noise fluctuations in price and quickly reacts to the trend. It is based on an algorithm from a system of hyperbolic functions that allows you to aggressively smooth the flat with minimal lag on the trend. It can be applied directly to the price chart, to itself, or to other indicators in order to eliminate false signals. The main purpose of the indicator is to smooth out small sawtooth price movements as much as possible. The higher the Hyperbolic parameter, the stron

Gold is Cold EAは、著者独自のトレンドインジケーターをベースにしています。このEAは、上昇トレンドの開始を青い矢印で、下降トレンドの開始を赤い矢印で正確に検出し、 TPに達するまでマーチンゲール/グリッドスタイルでオープントレードを制御します 推奨ペア:xauusd、eurusd、audusd、gbpusd、nzdusdなどの主要通貨ペアに加え、audcad、nzdcad、eurnzd、eurcadなどのマイナー通貨ペア(m15以上の時間枠) 設定: 開始時間 – EA の開始時間 開始分 – EA の開始分 終了時間 – EA の終了時間 終了分 – EA の終了分 ロット – 取引を開始する最初のロット 可変ロットの使用 – True/False – 資金管理を使用する True/False 0.01 ロットごとのフリー マージン – 0.01 ロットごとのフリー マージン 乗算 – 1.5 などの乗数 最大ロット – 許可される最大ロット 利益確定 – ポイントでの利益確定 ポイントでのストップ ロス (0: 使用しない) – ポイントでのストップ ロス。0 の場
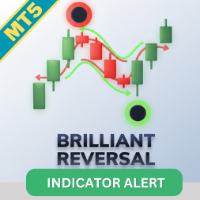
取引戦略を向上させる Brilliant Reversal Indicator MT5 は、非パラメトリックカーネル回帰を活用した最先端のインジケーターで、スムーズで適応性の高いトレンド分析を提供します。Nadaraya-Watson推定器に着想を得たこのツールは、価格データにガウスカーネル平滑化を適用し、市場のボラティリティに適応するダイナミックなエンベロープを作成しますが、伝統的な移動平均の過度のラグはありません。TradingViewなどのプラットフォームで広く称賛され、世界中のトレーダーから反転の検出精度で評価されているNadaraya Watson Envelopeは、2022年以来人気急上昇で、Bollinger Bandsの優れた代替品です。非再描画モードはリアルタイムの信頼性のあるシグナルを保証し、再描画オプションは詳細分析のためのウルトラスムーズなビジュアルを提供します。 トレーダーは、Brilliant Reversal Indicatorをトレンドの強さ、オーバーバイ/オーバーソールド状態、潜在的な反転ポイントを驚くべき精度で強調する能力で愛しています。基礎的な価

The official release price is $65 only for the first 10 copies, the next price is $125 Gold Scalper System is a multifunctional trading system that combines a breakout strategy for key liquidity levels with confirmation and a built-in Smart DOM Pro module for market depth analysis. The system identifies zones of limit order accumulation, tracks activity at support and resistance levels, and generates signals at the moment of their breako

The Gann Box (or Gann Square) is a market analysis method based on the "Mathematical formula for market predictions" article by W.D. Gann. This indicator can plot three models of Squares: 90, 52(104), 144. There are six variants of grids and two variants of arcs. You can plot multiple squares on one chart simultaneously.
Parameters Square — selection of a Gann square model: 90 — square of 90 (or square of nine); 52 (104) — square of 52 (or 104); 144 — universal square of 144; 144 (full) — "fu

日中取引と複数日取引のためのGiramenti 高度ブレイクアウトエキスパートアドバイザー
このエキスパートアドバイザーは、カスタマイズ可能なタイムセッションと複数日保有条件において、ルールに基づいた正確なブレイクアウト取引を行うために設計されています。
規律ある日中取引を行うトレーダーでも、複数日トレンドへの参加を目指す戦略的なスイングトレーダーでも、このEAは、単一の最適化されたエンジン内で卓越したカスタマイズ性とコントロール性を提供します。
カスタマイズ可能な高値/安値レンジの定義
開始時間と過去数時間を選択することで、ブレイクアウトチャネルを定義します。これにより、セッションベースの動的な高値/安値レンジが作成され、正確なブレイクアウトエントリーが可能になります。
曜日による方向性バイアス
月曜日から日曜日まで、曜日ごとに取引方向(ロングのみ、ショートのみ、両方、またはなし)を個別に設定できます。外科手術のような精度で週の取引を微調整できます。
スマートリスク管理
以下から選択:
取引ごとの固定資金リスク
口座残高の動的な割合によるリスク
ロットサイズは、ストップ

移動平均 EA ΜΤ5 は、完全に自動化された Expert Advisor であり、移動平均の取引をまったく新しいレベルに引き上げます。 移動平均 EA MT5 は、MA が上昇したときに 1 つの買い取引を開くか (青色の MA)、MA が下降したときに 1 つの売り取引 (赤色の MA) を開くか、勾配が続く限り、すべての新しいろうそくで新しい同じ方向の取引を開くことができます。 移動平均の方向は変わりません。 一連の独自の設定により、この EA は非常に用途が広いものになっています。 この EA には、ECN Raw Spread ICMarkets アカウント (ニューヨーク ベースの GMT+3 タイム ゾーン サーバー) 用に特別に最適化された、多くのシンボル用に提供されたセット ファイルが付属しています。 他のブローカーまたは口座タイプを使用することもできますが、ブローカー/口座に合わせて必要な時間を調整する必要がある場合があります. アドバイス: 私のEAは市場を予測する魔法のシステムではなく、マーチンゲールやグリッド戦略を使わずに安定した結果を得るた

The Candle Timer indicator displays an advanced bar countdown timer on a chart. This study indicates the remaining time for the last candle in the chart.
Main features The indicator shows the remaining time for the last bar in the chart. Alert notifications for new bar. Works on every timeframe (M1, M5, M15, M30, H1, H4, D1, W1, MN). Customizable parameters (Colors, Text size, Visibility...). Ideal tool for all kinds of trading (Scalpers, intraday traders...). Very fast calculation. Availa
FREE
MetaTraderマーケットは自動売買ロボットとテクニカル指標を販売するための最もいい場所です。
魅力的なデザインと説明を備えたMetaTraderプラットフォーム用アプリを開発するだけでいいのです。マーケットでプロダクトをパブリッシュして何百万ものMetaTraderユーザーに提供する方法をご覧ください。
取引の機会を逃しています。
- 無料取引アプリ
- 8千を超えるシグナルをコピー
- 金融ニュースで金融マーケットを探索
新規登録
ログイン