适用于MetaTrader 5的EA交易和指标 - 44
EA Portfolio Analytics Dashboard Pro - Advanced Multi-EA Performance Monitor EA Portfolio Analytics Dashboard Pro is a professional MetaTrader 5 tool designed for advanced portfolio management and real-time performance analytics. Monitor all your Expert Advisors simultaneously with institutional-grade metrics. Key Benefits: Multi-EA Performance Matrix: Track unlimited EAs and their statistics in a single view. Real-Time Risk Analytics: Monitor key metrics like Sharpe Ratio, Value at Risk (V

Hi-Lo is an indicator whose purpose is to more precisely assist the trends of a given asset - thus indicating the possible best time to buy or sell.
What is Hi-lo?
Hi-Lo is a term derived from English, where Hi is linked to the word High and Lo to the word Low. It is a trend indicator used to assess asset trading in the financial market.
Therefore, its use is given to identify whether a particular asset is showing an upward or downward trend in value. In this way, Hi-Lo Activator can be tran
FREE

Automatic Trend Line Fit. This indicator automatically plots the straight line and parabolic (curved) trend to any symbol at any timeframe. The plotted straight line is a good indication of the current trend and the curved line is an indication of a change momentum or change in the current trend. Plotting the straight line over about 2/3 the number of candles as the curved line is usually a good way to determine entry and exit points as it shows the current trend and momentum of the market. This
FREE

TradeForge Pass Prop Firm – 您的 AI 驱动 Prop Firm 闯关 EA TradeForge Pass Prop Firm 是一款为通过 Prop Firm 挑战设计的高端 MT5 Expert Advisor。它融合了人工智能、严格的风控机制与动态策略适应能力,是成功拿资 prop firm 评价的终极工具。 AI 内核 基于历史 Prop Firm 数据与实时市场行情训练 AI 算法,可: 分析价格行为与波动模式 动态适应市场变化 通过多层逻辑优化交易时机 避免高风险新闻交易期 AI 确保每笔交易的智慧选择,显著提高闯关成功率。 严格适配 Prop Firm 规则 支持常见 Prop Firm 规定(如 FTMO、MyForexFunds、True Forex Funds): 最大每日回撤限制 最大总回撤监控 软停/硬停条件 固定或动态仓位按风险 % 设置 无马丁格尔、无网格,仅基于逻辑的入场 设定挑战目标与回撤限制,EA 全面管理,无需手动干预。 策略亮点 Scalp + Swing 混合逻辑 :AI 根据市场节奏决定短线

This indicator is especially for the binary trading. Time frame is 1 minutes and exp time 5 or 3 minutes only. You must be use martingale 3 step. So you must put lots size is 10 % at most. You should use Mt2 trading platform to connect with my indicator to get more signal without human working. This indicator wining rate is over 80% but you may get 100% of profit by using martingale 3 step. You should use MT2 Trading Platform to connect meta trader platform and binary platform . You can get mt2
FREE

Advanced SatoshiMind AI Bitcoin Robot MT5 - JUST PLUG & PLAY ON BTCUSD CHART in M5 time- For Back test Use 1 Mint OHLC Mode Upgraded with Best AI & Neural Network Features for Higher Accuracy in BTCUSD Trading- MUST BUY THIS PROFITABLE AI ROBOT!! - Upgraded version Date 22Dec 2025 Introducing Advanced SatoshiMind AI Bitcoin Robot MT5 — a next-generation Expert Advisor built to trade Bitcoin/BTCUSD with intelligent precision, using a unique blend of technical mastery and AI-driven decision-maki
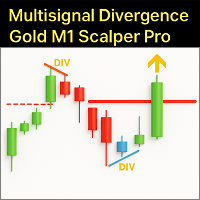
Master the volatile Gold (XAUUSD) market on the M1 timeframe with the Multisignal Divergence Gold M1 Scalper Pro . This indicator is not just another tool, but an advanced trading engine, meticulously designed to provide scalpers with high-precision entry signals, filtering out noise and focusing on robust confluences. The Challenge of Gold M1 Scalping:
Scalping, especially on an asset like Gold on the M1, demands speed, precision, and an exceptional ability to identify momentary reversals and

If you love this indicator, please leave a positive rating and comment, it will be a source of motivation to help me create more products <3 How to use SuperTrend? When the price crosses above the supertrend line it signals a buy signal and when the price crosses below the supertrend line it signals a sell signal. The supertrend indicator which acts as a dynamic level of support or resistance and helps traders make informed decisions about entry and exit points. When prices are above s upertre
FREE

Supply and demand in trading describes how buyer (demand) and seller (supply) actions set asset prices, with high demand/low supply raising prices (premium) and low demand/high supply lowering them (discount); traders identify these imbalances as "zones" on charts (e.g., Rally-Base-Rally for demand, Drop-Base-Drop for supply) to find potential entry/exit points, aiming to buy at discount demand zones and sell at premium supply zones, using volume and price action to confirm institutional acti
FREE

This is a 7-day limited-access version of KPG V4 Pro 1. After the evaluation period expires, please purchase the full product on the MQL5 Market to continue using all features.
**KPG V4 Pro 1 limited-access Smart Trading System- ** **BillionKPG Club – Precision Engineered for Steady Growth**
Hello, traders! **Quick setup tip:** For optimal performance, ensure your account meets the minimum margin requirements and set your risk parameters conservatively. If you encounter any setup challe
FREE

MACD Pro – MACD Indicator for MetaTrader 5 Description
MACD Pro is a Moving Average Convergence Divergence (MACD) indicator for MetaTrader 5. It follows the standard MACD calculation method and displays trend direction and momentum in a separate indicator window. Indicator Elements MACD line based on the difference between fast and slow exponential moving averages Signal line calculated as an exponential moving average of the MACD line Histogram showing the difference between the MACD and signa
FREE

Global Trading Sessions is a technical indicator for MetaTrader 5 designed to identify and mark the opening times of the four major financial sessions: Tokyo, London, New York, and Sydney . The indicator addresses the common challenge of varying broker server times by utilizing a GMT-based calculation logic . By synchronizing with Global Mean Time (GMT), the indicator ensures that session boundaries are accurately placed regardless of the brokerage platform’s local time zone. This makes it an es
FREE

A heatmap is a graphical representation of data in two dimensions, using colors to display different factors. Heatmaps are a helpful visual aid for viewers, enabling the quick dissemination of statistical or data-driven information. The MP Heatmap indicator provides a graphical representation of the relative strengths of major currencies compared to others, organizing data from pairs into color-coded results and producing a clear overview of the entire Forex market. The MP Heatmap indicator dis
FREE

General Description Volatility Breakout Master is an Expert Advisor designed to capture market volatility through a “breakout + reversal” strategy.
The system detects when the price breaks the high or low of the last X candles within a configurable time window, enters in the breakout direction, and—if the market reverses—opens a new position in the opposite direction following a dynamic model.
Once a cycle is completed (when one direction prevails), all trades are closed, and the system automat
FREE

Pipsometer is an elegant, real-time panel indicator for MT5 that instantly shows you both your cumulative money and pip gain/loss and total trades executed on the current chart. It dynamically changes its display color—green for net profit and red for net loss—so you can gauge performance at a glance without opening reports or scrolling through trade history.
FREE

Money Mind BTC — BTCUSD 在 H1 (v13.00) 具有全球风险管理和自适应行为的自动化系统 Money Mind BTC 13.00 是一款专为 BTCUSD 设计的智能交易顾问,具备全面风险控制和自动适应逻辑。它结合了运行稳定性、配置灵活性以及可根据市场条件自动调整行为的全球管理结构。 主要特征 交易品种:BTCUSD 推荐周期:H1 内部过滤器,可调节灵敏度 具有自适应距离的渐进式入场 可配置交易方向(仅买入、仅卖出或双向) 固定、算术或几何手数模式 按账户余额百分比计算的全局止盈和止损 账户增长时自动调整手数 最大持仓数量限制 开仓前的内部风险验证 版本 13.00 新增功能 新的入场灵敏度结构(级别 1–5) 根据市场条件动态调整持仓间距 新增参数 EscalaVelocidad (速度比例),可调节系统响应 改进了资金和保证金验证 用于优化的多目标评估模型 总体说明 EA 采用渐进式交易逻辑,根据市场行为调整风险敞口与出场条件。不使用单独的 TP 或 SL,而是通过全局控制实现一致的风险管理。 推荐配置 交易品种:BTCUSD 周期:H1 建议最低资

KEY FEATURES: One-Click Chart Switching (Fast Navigation) Simply click on any symbol name in the dashboard, and your chart instantly changes to that pair. Never miss a trade setup again due to slow navigation. Triple Signal Detection Monitors 3 powerful indicators simultaneously for every symbol: RSI Monitor: Detects Overbought/Oversold conditions instantly. Stochastic: Confirms momentum shifts. MA Trend: Identifies the main trend direction (Bullish/Bearish) using Moving Averages. writ Any Symb
FREE

NEXA Gold Pullback System v2.0 基于 H1 趋势 + M15 回调结构的 GOLD 摆动交易 EA
官方用户说明书(最终版) 1. 产品概述 NEXA Gold Pullback System v2.0
是一款专为 GOLD(XAUUSD)设计的
摆动交易型 Expert Advisor(EA)。 本 EA 在 H1(1小时)周期 上分析中长期趋势方向,
并在 M15(15分钟)周期 中识别
黄金市场中反复出现的回调(Pullback)结构后执行交易。 系统并非依赖单一指标信号,
而是基于以下结构化市场流程构建: 趋势 → 回调 → 突破 该设计旨在减少短期市场噪音,
并在趋势行情中提高交易效率。 2. 交易策略结构 2.1 H1 趋势过滤(EMA、RSI、ATR) EMA34 位于 EMA89 之上 → 上升趋势 EMA34 位于 EMA89 之下 → 下降趋势 EA 使用 ATR 对 EMA 间距进行标准化,
将趋势强度划分为三个等级: 弱 正常 强 同时结合 RSI 条件过滤
虚假或短暂的趋势信号。
在弱趋势状态下,EA 不进行交易。 2.2 M15
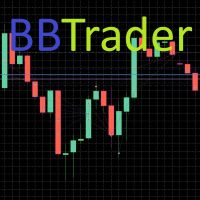
Introducing the BB Trader EA, an advanced trading tool harnessing insights from the Bollinger Band indicator. This expert advisor strategically makes use of the upper and lower bollinger bands. Key Features: Flexible trade options: Set the maximum number of trades for single or multiple entries. Optional ATR-adjusted system: Manage multiple trades while dynamically making adjustments for volatility. Versatile grid lot sizing: Choose between static or automatically increasing (non-martingale) op
FREE

本指标的主要目的是根据 "混沌交易, 第二版" 和 "新交易维度" 的描述,在加速振荡器的直方图里检测并标记交易信号。信号列表: 当指标直方条低于零轴此为做多信号。 当指标直方条低于零轴此为做空信号。 当指标直方条高于零轴此为做空信号。 当指标直方条高于零轴此为做多信号。 当指标直方条与零轴交叉此为做多信号。 指标包括一个信号块,用来方便地通知交易者任何新信号的形成。 本指标是基于 "混沌交易" 和 "新交易维度" 策略的复杂交易系统的一部分。本指标是形态的一部分。建议指标与以下产品配合使用: 混沌交易法 EA 混沌交易图表 新交易维度图表 改编的动量指标 识别 1 2 3 形态 波浪制造者 点差和利息监控 虚拟挂单突破做空 (混沌交易法 EA 的简化版本) 虚拟挂单突破做多 (混沌交易法 EA 的简化版本)
FREE

Trade Hunter MT5 - Buy and Sell Indicator
Unlock precise trading opportunities with Trade Hunter MT5! This powerful indicator identifies potential buy and sell signals by analyzing price movements over a customizable period. Blue arrows mark buy opportunities below key lows, while red arrows highlight sell signals above critical highs. With adjustable parameters like bar range, percentage offset, and alert settings, Trade Hunter adapts to your strategy. Optional alerts and notifications ensur
FREE

Neuro Gold is from the same family as BotGPT. Its realization required more than 18 months of development. Thanks to its real-time connection on its networks, it is able to make decisions in a few microseconds at any time and knows how to adapt to the situations it encounters over time. -> Please note that the backtest does not take into account real-time network data, so the real-time results are even better than the backtests. Its success rate is exceptional, download the demo version for fr
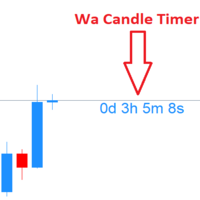
Wa Candle Timer MT5 是一个功能强大且用户友好的指标,旨在在您的 MT5 图表上显示当前蜡烛结束前的剩余时间。此工具帮助交易者时刻关注蜡烛的关闭时间,从而更好地执行交易并做出决策。现在,您还可以根据设定的百分比设置提醒,使时间控制更精确。
主要功能: 显示当前蜡烛的倒计时。 当剩余时间低于用户定义的百分比时变色。 蜡烛到达指定百分比时触发提醒。 支持字体和颜色的完全自定义。 提高交易中的时间管理和精确度。
可自定义设置: 1️⃣ 高于阈值的计时颜色 2️⃣ 低于阈值的计时颜色 3️⃣ 字体大小 4️⃣ 字体样式 5️⃣ 提醒触发百分比设置(例如:95%、80% 等)
这是所有依赖精准时间控制的交易者的理想工具。使用 Wa Candle Timer MT5,掌握市场节奏,先人一步做出交易决策。
FREE

Please check the " What's new " tab regularly for a complete and up-to-date list of all improvements + parameters. FREE indicator for my trading utility Take a Break . This indicator allows you to manage multiple other EAs with just one Take a Break EA instance. Simply specify the corresponding Chart Group in the indicator(s) and Take a Break EA settings and you are good to go.
Setup examples (Indicator + EA)
As a prerequisite, add the URL https://trading.custom-solutions.it to the list of al
FREE

Time Range Breakout Pro : Advanced Hour Range Trading System
Time Range Breakout Pro is a sophisticated Expert Advisor designed to capitalize on price movements within specific time ranges. This EA uses a strategic approach to identify optimal trading opportunities based on price action during predefined hours, with built-in risk management features to protect your investment. Key Features Time-Based Trading Strategy Trades exclusively during your specified hours Validates price ranges to
FREE

Opening Gap EA 特別適合交易股票價格開盤時的缺口。由於股票的上漲幅度通常大於下跌幅度,因此只開立買入部位。交易在交易時間結束前不久進行,並在開盤後的第二天立即關閉。這裡產生的缺口被視為利潤。與NVDA的回測中產生了不錯的利潤。此 EA 是您 EA 組合的一個很好的補充。
EA 的優點:
- 沒有鞅,沒有網格系統
- 每筆交易都有 SL 擔保
- 您只需少量資金即可進行交易,最低 100。
- 使用 NVDA Timeframe M1 進行測試。然而,也可以使用其他資產。
檢查 M1 時間範圍內的交易視窗以了解交易時間何時結束非常重要。然後,您可以在設定中的「交易時間」下將此時間提前 1 分鐘。
這是一個範例:https://www.mql5.com/de/market/product/123570#!tab=comments&page=1&comment=54625304
這是設定檔:https://www.mql5.com/de/market/product/123570#!tab=comments&page=1&comment
FREE

BEHOLD!!!
One of the best Breakout Indicator of all time is here. Multi Breakout Pattern looks at the preceding candles and timeframes to help you recognize the breakouts in real time.
The In-built function of supply and demand can help you evaluate your take profits and Stop losses
SEE THE SCREENSHOTS TO WITNESS SOME OF THE BEST BREAKOUTS
INPUTS
MaxBarsback: The max bars to look back
Slow length 1: Period lookback
Slow length 2: Period lookback
Slow length 3: Period lookback
Slow leng
FREE

Setup Tabajara was created by a Brazilian trader known as "The OGRO of Wall Street" .
The idea of this setup is to indicate to the trader the current trend of prices and the type of operation should be looked for in the graph.
Operation
It does this through the relation of the closing price position and the of 20 periods, by painting the candles in 4 possible colors : Green -> Price rising in upward trend (Search entry points for PURCHASE) Black -> Price correcting in Bullish Trend (Sear
FREE

Random Long-Only Turtle Expert Advisor This EA implements a random long-only turtle strategy with two feat ures: 1. Fundam ental-Based Long-Only Approach: Gold and Bitcoin hedge against inflation and monetary policy uncertainty. The EA trades long-only on these assets. Backtesting shows strong performa nce during bull markets in gold and Bitcoin. 2. Adaptive Random Trading in Rang ing Markets: Many trend-following strategies fail because whipsaw losses in ranging markets exceed trend profits.
FREE

With this system you can spot high-probability trades in direction of strong trends. You can profit from stop hunt moves initiated by the smart money!
Important Information How you can maximize the potential of the scanner, please read here: www.mql5.com/en/blogs/post/718109 Please read also the blog about the usage of the indicator: Professional Trading With Strong Momentum.
With this system you have 3 reliable edges on your side: A strong trend (=high probability of continuation) A deep pull
THE BEST! yet easy-to-use MT5 to Telegram Trade Copier [MANUAL HERE]
Overview: This powerful tool allows traders to send real-time trade notifications directly to their Telegram channels and group, ensuring they never miss an important market move. TeleBot5 is an innovative MQL5 program designed to seamlessly bridge your MetaTrader 5 trading experience with Telegram.
**Key Features:**
- **Real-Time Trade Alerts:** Instantly receive notifications for every trade executed on your MT5 accoun
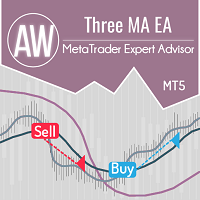
在两条移动平均线的交叉点交易的 Expert Advisor 使用第三条移动平均线来过滤当前趋势方向。它具有灵活但同时简单的输入设置。 问题解决 -> 这里 / MT4版本 -> 这里 / 使用说明 -> 这里 好处: 直观简单的设置 适用于任何类型的工具和任何时间范围 具有三种类型的通知 将第一个订单与最后一个订单重叠的可插拔系统 能够自动计算交易量 专家顾问策略。 EA 使用三个移动平均线来开仓。主要的是两个移动的,快的和慢的。第三个是过滤掉市场噪音的幻灯片。 如果快速移动的信号从下向上穿过慢速移动的信号,那么这是一个买入信号。 如果快速移动的信号从上到下穿过慢速移动的信号,那么这是一个卖出信号。 使用第三次滑动时: 当快速和慢速移动平均线低于过滤移动平均线(下降趋势)时,只有卖出信号有效。 当过滤移动平均线低于(上升趋势)快速和慢速移动平均线时,只有买入信号起作用。 最快的周期最小,最慢的周期更长,滤波器滑动周期最大。 如果禁用过滤,则: 在快速和慢速移动平均线的每个交叉点,EA 将打开交易 Input variables: Main settings

FourAverage是趋势检测中的一个新词。 随着信息技术的发展和大量的参与者,金融市场越来越不适合用过时的指标进行分析。 传统的技术分析工具,如移动平均线或随机指标,其纯粹形式无法确定趋势的方向或其逆转。 一个指标可以根据14年的历史指示未来价格的正确方向,而不改变其参数吗? 与此同时,不要失去充足的横向市场走势? 答:可以。 我们的团队开发了一个指标,具有相当强大和有效的机制来适应不断变化的市场条件。 2025年,领先的趋势指标"FourAverage"正进入新的发展阶段。 现代加密货币和股票市场似乎是为此指标创建的。 独特的平滑公式允许您调整(识别模式)指标的任何特征的货币对或其他工具。 现在,为了盈利,一个指标就足够了,而这仅仅是个开始。 与其他工具结合使用或作为信号滤波器,FourAverage的好处是巨大的。 该指标有一个内置函数,绘制箭头并在指标上显示前一笔交易的结果。 这使得检查历史非常方便。 这是非常容易使用这个趋势指标。 1)确定具有良好增长潜力的资产。 2)使用一组内置指标设置或选择您自己的选项。 3)您正在等待指标的信号来开启交易。 4)打开一个位置,并获得利

KT Volume Profile 将交易量堆积数据显示为纵轴上的柱状图,使交易者能够分析特定时间段和价格水平的市场活跃度。该指标非常适合识别市场中最重要的交易区域和支撑/阻力水平。
成交量轮廓中的控制点 (POC)
POC 是成交量轮廓中交易量最多的价格水平。它通常被视为关键支撑/阻力位或市场在选择方向前经常回测的重要价位。
功能特点 使用非常简单,只需将矩形拖放到图表上的任意位置,即可实时更新成交量轮廓数据。 当价格突破 POC 时可触发提醒。 从零开始编码,最大限度地优化 CPU 和内存资源的使用。
输入参数 成交量来源: 按Tick成交量 / 实际成交量。 轮廓柱状图颜色: 设定柱状图的颜色。 轮廓矩形宽度: 设置矩形框的宽度。 矩形颜色: 设置框体的颜色。 显示控制点 (POC): true/false POC 颜色: 控制点的颜色。 POC 样式: 控制点的线条样式。 POC 宽度: 控制点的线条粗细。 提醒设置: 参数简单明了。
实际成交量 vs Tick成交量 由于外汇市场是去中心化的,散户交易者很难获得真实的成交量数据。如果

This EA uses two moving averages one slow and one fast, when ever they cross it checks if the RSI value is greater or lesser than 50 depending on the signal given by the Moving averages. After that it checks if the Stochastics lines are going up or down and not in the Over Bought or Over sold zone. so in total it uses an RSI, 2 Moving Averages ,Stochastics and an ATR to try to evade stop hunting.Also has a trailing function to hold the profits if price moves X pips tested on a 5 min time frame
FREE

TradingLab Trade Panel - 产品描述 TradingLab Trade Panel - 专业的全合一交易界面 将您的 MetaTrader 5 转变为专业的交易指挥中心 概述 TradingLab Trade Panel 是一个全面的交易叠加界面,用一个直观的界面替换多个手动操作。专为自由裁量和系统性交易者设计,它结合了视觉订单放置、自动化风险管理、高级仓位控制和灵活的追踪策略——所有这些都在一个优雅的、受 TradingView 启发的深色主题中。 主要功能 视觉订单放置 直接在图表上拖放入场、止损和止盈线 实时重新计算手数大小,因为您调整价格水平 自动检测订单类型(市价、买入/卖出止损、买入/卖出限价) 在执行前查看确切的美元风险和回报 自动化风险管理 一键选择风险百分比(0.5%、1%、2%) 可调滑块从 0.1% 到 10% 每笔交易风险 基于账户权益和止损距离的自动手数大小 回报:风险比率锁定在调整止损时保持纪律 点差监测,当条件恶化时有视觉警报 高级仓位管理 部分关闭选项:25%、50% 或 75% 仓位减少 一键保本以锁定受保护利润 即时反转仓位并调
FREE

“交易通知”是一个实用工具,旨在通过 移动通知或终端警报 通知您每笔开仓或平仓交易,以及每笔交易的美元盈利/亏损结果。这是我自己使用了很长时间的一个工具,我决定免费分享它!
输入参数: (每个输入都是 true/false 类型, 双击可以更改其值) 平仓盈亏通知 :如果为 true,它将通知您任何已平仓交易的美元结果。这样,您就可以了解交易何时结束及其结果。
这是一个有用的功能,可以让您不必沉迷于图表,观察您的交易盈亏的上下波动。这会减轻交易压力。 通知新开仓交易 :如果为 true,它将在新开仓交易时通知您。 当您设置挂单并想知道何时触发入场水平时,这是非常重要的参数。
如果您是一名算法交易者并使用进入市场的 EA,此功能有助于监控 EA 的活动以确保其正常工作。
通知新的挂单交易 :如果为 true,它会在设置挂单时通知您。这仅对使用 EA 交易进行交易并希望观察 EA 何时设置挂单的用户有用(因为如果挂单是手动下达的,则不需要“通知”它,因为您自己下达了挂单)
通知删除挂单交易 :如果为 true, 它将在删除挂单时通知您 。同样,这主要对算法交易者有用,原
FREE

速度阻力线是确定趋势和阻力线的有力工具。 该指标使用图表极值和特殊的数学公式构建线条。 该指标可用于确定趋势方向和枢轴点。
<---------------------------->
指标参数:
"Depth of search" -搜索图表极值的深度(以条形为单位) "Back step of search" -极值之间的最小距离(以条为单位) "Deviation of price" -同一类型极端之间的允许价格差异 "Line color" -带有相应索引的线条颜色 "Line style" -带有相应索引的线条样式 "Line width" -具有相应索引的线宽 <---------------------------->
你可以在"艾德森*古尔德的稀有作品集"一书中找到更多信息,也可以在私人信息中与我联系。
<---------------------------->
提前感谢所有有兴趣的人,祝你好运征服市场!
FREE

Introducing Order Blocks Breaker , a brand-new way to identify and leverage order blocks in your trading strategy. After developing multiple order block tools with unique concepts, I’m proud to present this tool that takes things to the next level. Unlike previous tools, Order Blocks Breaker not only identifies order blocks but also highlights Breaker Order Blocks —key areas where the price is likely to retest after a breakout. MT4 - https://www.mql5.com/en/market/product/124101/ This t

Type: Expert Advisor (MetaTrader 5) Official Telegram: @StellarXNeos Don't forget to Reviews LIMITED INTRO PRICE FREE (NOW) Next price: $199 Final price cap: $1,299 OVERVIEW StellarX Neos is a fully automated MT5 Expert Advisor designed with a structured trading framework, built-in safety layers, and a clean professional interface. The EA focuses on execution discipline and risk control, with optional Prop-Firm style rules for rule-based environments. SYSTEM MODULES CORE: Low-latency automated
FREE

基本主题构建器:简化您的图表自定义 通过 基本主题构建器 指标,彻底改变您的交易体验。这款多功能工具旨在简化您在MetaTrader 5 平台上自定义图表外观的过程。该指标提供了一个用户友好的面板,您可以轻松切换不同的主题和配色方案,提升交易环境的视觉吸引力和功能性。 Free MT4 version 基本主题构建器 指标是那些希望轻松个性化MetaTrader 5图表的交易者的终极工具。通过其简单的面板界面和各种主题预设,您可以迅速调整图表的外观,以匹配您的交易风格或心情。无论您偏爱经典外观还是现代美学,基本主题构建器提供了一系列选项,以增强您的视觉体验并提高专注度。立即优化您的交易设置,体验这款实用且易于使用的指标。
主要特点: 轻松管理主题: 使用便捷的面板界面,单击即可快速更改图表主题。 预定义预设: 从几种预配置的主题和配色方案中进行选择,包括经典、深色、浅色等,以适应您的交易偏好。 可自定义选项: 调整颜色和样式,按您的喜好定制图表外观。 用户友好界面: 享受简单直观的设计,无需复杂设置或配置。 提升交易专注度: 通过视觉吸引力强且无干扰的图表环境,改善您的交易体验。
FREE

Event Horizon Trader - это передовой автоматический торговый робот, построенный на инновационной гибридной архитектуре. Он объединяет квантовые принципы, искусственный интеллект и многоуровневую систему управления рисками для адаптивной торговли на финансовых рынках. Советник разработан для работы в изменчивых рыночных условиях, динамически подстраиваясь под трендовые, флэтовые и высоковолатильные периоды. Советник имеет тестовую настройку для пары: XAUUSD Ключевые компоненты системы: 1. Квант
FREE

The Super Boom and Crash Robot operates based on two key indicators: the Relative Strength Index (RSI) and the 200-period Moving Average (MA). It buys when the RSI is above 30, signaling potential for upward momentum, and the 200-period MA is positioned above the current price, indicating a bullish trend. Conversely, it sells when the RSI falls below 70, suggesting overbought conditions, and the 200-period MA is below the price, signaling a bearish trend. This strategy aims to capitalize on pric
FREE

ICT Unicorn Hunter – Multi-Timeframe Smart Setup Detector IMPORTANT: This is a Multi-Timeframe Scanner, looking for 'Unicorn' setups. A Unicorn in this definition is a liquidity sweep, market structure shift and creation of a Fair Value Gap overlapping with the last opposite-close candle before the liquidity sweep (breaker). This scanner does NOT provide visualisation of the Unicorn on the chart.
For visualisation, use the Unicorn Tracker indicator, which is designed to work with the Unicorn
FREE

EMTB GOLD REAPER – Advanced Multi-Filter Gold Trading EA Experience the Precision of a Professional Gold Trading System. Designed for XAUUSD. Built for Results. Forget guesswork and emotional trading. The EMTB GOLD REAPER is a high-precision, multi-timeframe Expert Advisor engineered exclusively for the gold market (XAUUSD) . It combines robust candlestick logic with a multi-layered, configurable filter system to identify high-probability opportunities and manage risk with institutio
FREE

正在寻找可以帮助您轻松识别有利可图的交易机会的强大外汇交易指标? Beast Super Signal 就是您的不二之选。 这个易于使用的基于趋势的指标持续监控市场状况,寻找新的发展趋势或跳入现有趋势。当所有内部策略一致且彼此 100% 融合时,Beast Super Signal 会发出买入或卖出信号,无需额外确认。当您收到信号箭头警报时,只需买入或卖出。
购买后给我留言,让我加入我的私人 VIP 群组! (仅限购买完整产品)。
购买后给我发消息以获取最新的优化设置文件。
此处提供 MT4 版本。
在此处 获取 Beast Super Signal EA。
查看评论部分以查看最新结果!
Beast Super Signal 根据您偏好的 1:1、1:2 或 1:3 风险回报率建议入场价、止损和获利水平,让您放心交易。这个 Beast Super Signal 是 100% 不可重新绘制的,这意味着它永远不会重新计算或重新绘制,每次都能为您提供可靠的信号。 Beast Super Signal 指标适用于所有时间范围,包括货币对、指数、商品和加密货币对。 Beast S

Stochastic RSI makes a stochastic calculation on the RSI indicator. The Relative Strength Index (RSI) is a well known momentum oscillator that measures the speed and change of price movements, developed by J. Welles Wilder.
Features Find overbought and oversold situations. Sound alert when overbought/oversold level is reached. Get email and/or push notification alerts when a signal is detected. The indicator is non-repainting. Returns buffer values for %K and %D to be used as part of an EA. (se
FREE

XAUUSD Scalper Pro Ichimoku MACD
智能且激进的黄金剥头皮交易专家顾问,基于 Ichimoku + MACD + 多周期趋势过滤器(MTF),专为 XAUUSD M1 设计 概述
XAUUSD Scalper Pro Ichimoku MACD 是一款全自动剥头皮交易机器人,专门为 XAUUSD(黄金) 的 M1(1分钟) 周期开发。
该 EA 结合 Ichimoku 与 MACD 的分析来捕捉强劲的短期动能,并通过 多时间框架(H4)趋势过滤器 确保交易方向顺应主要趋势。 EA 采用 以美元(USD)为单位的止盈/止损系统 ,让风险控制更加直观。
同时配备 智能追踪止损(Trailing Stop) ,能在价格变动中动态锁定利润。 这是一款适合追求 高效、快速且稳定 交易风格的黄金剥头皮交易者的智能系统。 主要功能
双重信号确认 :Ichimoku(Tenkan/Kijun 交叉 + Kumo 云过滤)与 MACD(动能与交叉信号)结合使用。
多周期趋势过滤(MTF) :基于 H4 移动平均线的趋势确认,仅在趋势方向开仓。
美元风险管理系统 :止盈

A bot utility designed to streamline trade management. It offers auto lot calculation based on money, account risk, or fixed lot size, with order setup featuring draggable take profit, stop loss, and entry price to fit your plan. It supports Buy/Sell market, Buy/Sell limit, and Buy/Sell stop orders, with or without stop loss and take profit. Additional features include single-click breakeven, deleting positions/orders, and more, making trade management efficient and easy.
FREE

MT4 版本: https://www.mql5.com/en/market/product/126488
MT5 版本: https://www.mql5.com/en/market/product/126489
Goldie Gold Expert Advisor 是一种高度专业化的交易算法,专为交易 Metal Gold (XAU/USD) 而设计。此 EA 结合了多种突破策略的复杂组合,可在波动的交易时段捕捉重大的市场走势。无论您喜欢马丁格尔风险管理方法还是传统的固定风险模型,Goldie Gold 都可以根据不同的交易偏好进行定制。
主要特点
突破策略集成:
结合几种经过验证的突破策略来识别和交易高概率设置。
利用高级逻辑过滤假突破,提高准确性和盈利能力。
适应趋势和区间波动的市场条件,以实现一致的性能。
风险管理选项:
使用马丁格尔: 允许在连续亏损的情况下使用马丁格尔系统进行恢复交易。 动态调整头寸规模以收回损失,同时管理风险敞口。 无马丁格尔: 提供更安全的固定风险模型,具有预定义的获利 (TP) 和止损 (SL) 水平。 适合寻求账户稳定增长且亏

Spike Detector Rider – Intelligent Trading in Volatile Markets Introduction
The Spike Detector Rider is an advanced system for MetaTrader 5 designed to detect explosive price movements in high-volatility assets such as synthetic indices and commodities.
It combines volatility filters, trend analysis, and automated risk management to provide intelligent trade confirmations. After purchase, please send me a private message via MQL5 to receive the installation manual and setup instructions. Asset

Pivot Point Super trend it can be used to catch price turning points and can show arrows for buying and selling. calculations are based on price peaks . you can control the price turning points by increasing the Pivot point period input on the indicator the ATR factor is for how far apart do you want the bands to be spread apart price break outs are also spotted in their early stages which will make trading much better
FREE

Introduction to the Candle Time Indicator The Candle Time Indicator for MetaTrader 5, helps users know how much time on a candlestick is remaining.
Overview of Candle Time Indicator settings. TextColor: set the color of the countdown clock; FontSize: set the size of the font; Installation Guide Copy and paste the CandleTime.ex5 indicator files into the MQL5 folder of the Metatrader 5 trading platform. You can gain access to this folder by clicking the top menu options, that goes as follows: Fil
FREE

This auxiliary indicator displays time left before closing on the current timeframe with continuous update . It also shows the last trade price and variation from a previous day close in percentage and points. This indicator is pretty handy for daytraders and scalpers who want to precisely monitor closing and opening of candles.
Indicator parameters Show in shifted end - Default: False. Display time and values on screen. If True, Displays only time to close aside last candle. Distance from the
FREE

Bollinger Brute 是一个 Brute Force Bollinger Band Break Out and Reversion EA
(!!!限时促销价!!!)
如果您不喜欢风险,或者如果风险不是问题,请定制它以慢慢来,定制它以暴力破解您的利润!
我们的一些客户只是在寻找一种自动交易策略,而不是一个完整的交易工具,因此我们在考虑到他们的预算的情况下创建了 Bollinger Brute。
价格经济,这应该可以满足这些需求。
(其中大部分代码是从我们的 Traders Toolbox EA 中提取的)
主要特征:
Band Squeeze Filter - 仅当在平均 Band 大小的可调整百分比处出现 Band Squeeze 时才会进行交易。 两种可定制的策略模式 - 仅交易突破或突破和反转。 资金管理 - 基于风险或固定手数,无鞅。 静态/追踪止损 - 可以自动追踪所有未结头寸的获利和止损,或者如果您愿意,可以不使用止损。 利润和回撤保护设置 - 用于关闭所有头寸以保护回撤或利润。 蛮力模式 - 无需等待更多蜡烛即可开仓。 (有风险但可以快速获利

该指标识别一种特殊类型的内线形态,由一根大主蜡烛和 4 根较小蜡烛形成(请参阅下面的策略说明)。 特征 在图表上绘制买入/卖出止损线以及止盈和止损水平。 TP/SL 水平基于平均真实范围 (ATR) 指标。 对象颜色是可变的。 当确定主蜡烛形成时向您发送实时警报 - 声音/弹出窗口/电子邮件/推送通知。 提出建议后,您可以通过自己的图表分析进行确认。通常,最好的交易设置是围绕重要支撑/阻力、整数、供需区域等发生的设置。 如果您想在多个图表上使用该指标,您可以考虑利用我的三角旗和三角形扫描仪中的内柱扫描,您可以找到 在这里 。 输入参数
内部蜡烛的数量 :为了获得最佳信号质量,建议将其设置为 4。请参阅下面的策略说明。 最大蜡烛线信号适用于 :此设置控制建议的入场线将扩展多长时间。 买入/卖出止损点的距离 :入场线的偏移量/缓冲区。建议主蜡烛高/低至少 5 个点。 以点为单位的最小主蜡烛尺寸 :请参阅下面的策略说明。 以点为单位的最大主蜡烛尺寸 :请参阅下面的策略说明。 等待蜡烛关闭 :真/假。默认值为真。如果设置为 False 那么警报将在 4 日 蜡烛打开。 忽
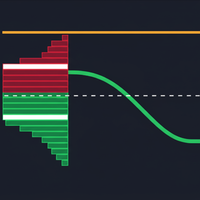
The "Volume Range Profile with Fair Value" (VRPFV) indicator is a powerful volume analysis tool designed to help traders better understand market structure and identify key price areas where significant institutional activity occurs. Instead of just looking at volume on individual candlesticks, VRPFV analyzes the distribution of volume by price level within a specific time range, providing deep insights into the "footprint" of smart money. VRPFV consists of the following core components: Upper &
FREE
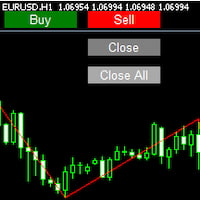
Imagine flying a real aircraft without ever stepping into a flight simulator. That's what trading is like. You have to simulate your strategy before you can take it to a live market. It is good if you can simulate things speedily before even stepping into any live market, or before coming up with an automated system. People don't have all day to stare at a higher timeframe chart until the entry signal finally arrives. That's why I built this so that you can simulate your strategy with speed. Th
FREE

B.W.S 基於 Ai 的即插即用:釋放 MT5 Boom and Crash EA 的力量,30 合 1 邏輯 对于更新版本注意: 1. 您必须已购买然后加入链接: https://t.me/ +_dW7fNhLMMs5YzE8 2.出示您的付款凭证,即可获得无限制的无限版本。 介紹:
金融交易世界在不斷發展,隨著先進技術的出現,交易者現在可以使用強大的工具來自動化他們的策略並增強他們的交易體驗。 Deriv Boom and Crash EA 的 B.W.S 基於 Ai 的即插即用系統是一種非常受歡迎的工具。這一創新解決方案結合了人工智能和一套全面的交易邏輯,為交易者在動蕩的繁榮和崩潰市場中提供無與倫比的優勢。在本文中,我們將探索 B.W.S 基於人工智能的即插即用系統的特性、優勢和功能。 了解 MT5 繁榮與崩潰市場: 在深入研究 B.W.S 基於人工智能的即插即用系統的細節之前,必須了解繁榮與崩潰市場的性質。 MetaTrader 5 平台 (Deriv) 上提供的 Boom and Crash 指數複製了真實市場的價格動態,允許交易者推測短期價格走勢。這個市場的高波動性既
FREE
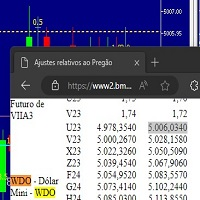
Este script marca no gráfico do ativo MINDOL da activ trades o ponto de ajuste do contrato futuro do Mini Dolar (WDO),
***ATENÇÃO*** para este script funcionar é necessário autorizar a URL da BMF Bovespa no Meta Trader. passo a passo: MetaTrader 5 -> Ferramentas -> Opções -> Expert Adivisors * Marque a opção "Relacione no quadro abaixo as URL que deseja permitir a função WebRequest" e no quadro abaixo adicione a URL: https://www2.bmf.com.br/ este indicador usa a seguinte página para buscar o a
FREE
Liquidity Pressure Index (LPI) is an advanced technical indicator designed to uncover the hidden battle between buyers and sellers in the market. Unlike conventional oscillators that only rely on price movements, LPI integrates market depth (order book data), ATR-based volatility compression, and adaptive smoothing to give traders a deeper view of true liquidity dynamics.
By combining price action with volume absorption and order flow pressure, the LPI helps traders anticipate shifts in market
FREE

介绍Blitz Gold Trader Pro:一款具有无与伦比速度和精准度的尖端黄金交易解决方案。由一支经验丰富的交易员和开发人员团队精心打造,这款先进的交易机器人采用强大的算法,结合了价格行动分析、趋势跟踪,并可根据需要自定义多个指标。它专为优化M1(1分钟)时间框架上的交易而设计,在捕捉盈利机会的同时,将风险降至最低。 Pro版本使用与免费版本不同的一组指标。 Blitz Gold Trader Pro采用明确的、风险规避的策略:无网格交易、无马丁格尔、无对冲。该机器人每次仅严格开启一个仓位,确保交易的可控性和专注性。该版本不依赖新闻过滤器,而是根据不同的点差进行调整,即使在市场波动时也能实现连续交易。 使用Blitz Gold Trader Pro的过程十分简单。凭借直观的设置,您只需调整手数大小,并选择机器人是否应全天候运行,或在特定的日期和时间内运行。该机器人兼容MetaTrader 5,并适用于任何外汇经纪商或代操盘公司。 低回撤(DD)——当前参与此EA的代操盘公司挑战包括Axi Select和Darwinex Zero。 如何开始: 截图来自使用MT5在RoboFor

这个强大的工具会自动识别趋势线,帮助您简化交易策略并做出更明智的决策。 mt4版本
关键功能 自动趋势线检测 :“基本趋势线”指标扫描了市场的潜在趋势线,并立即在图表上显示它们。这样可以节省您的宝贵时间,并确保您永远不会错过重要的趋势。 用户友好的面板 :我们的指示器配有美丽,直观的面板,可让您轻松绘制各种趋势线。该面板专为所有经验级别的交易者而设计,仅需单击几下即可添加,编辑或删除趋势线。 保存和管理您喜欢的趋势线 :跟踪对您最重要的趋势线。我们的指标使您可以保存首选的趋势线,并在您重新访问图表时始终可用。 多功能应用程序 :无论您是交易外汇,股票还是加密货币,“基本趋势线”指标适应各个市场,为您提供可靠的工具来增强交易策略。 输入 Number of Reactions :您可以确定价格对趋势线反应的次数。 Reaction Strength :一个较高的数字意味着只考虑了更强的反应。 Price Mode :趋势线可以在高/低价格上或关闭/关闭。 Max Length of Trend Line :使用此条目,您可以确定趋势线的最大长度。根据酒吧的数量。 Ext
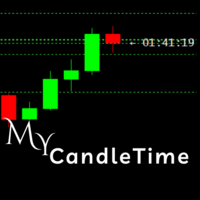
My CandleTime
This indicator displays the remaining time until the current candle closes directly on the chart.
It is designed to help traders keep track of candle formation without constantly checking the platform’s status bar. Main Features Shows countdown timer for the active candle. Works on any symbol and timeframe. Lightweight, does not overload the terminal. Adjustable font size and name. How to Use
Simply attach the indicator to a chart.
You can customize font size, color, and font to
FREE

We often need to know the sudden change in trend that happens on the graph and this can be confirmed through indicators.
This indicator shows the moments of trend reversal and how in which trend the price is shifting.
Custom background, no need to configure the colors in the chart, just drag the indicator!
Indication with arrows.
- Blue arrow: Upward trend.
- Pink Arrow: Downward Trend.
NOTE: Free indicator, support may take a while to respond.
FREE

Solarwind No Repaint是一个技术振荡器,将费舍尔变换应用于标准化价格数据,创建基于直方图的指标来识别潜在的市场转折点。该指标将价格变动转换为高斯正态分布,使周期性模式和动量变化对交易者更加可见。 工作原理 该指标通过几个计算步骤处理价格数据: 高低分析 :计算指定周期内的最高价和最低价 价格标准化 :取每根K线高低价范围的中点,并根据周期范围进行标准化,将数值缩放到-1和+1之间 费舍尔变换应用 :应用数学费舍尔变换公式 0.5 * ln((1+x)/(1-x)) 并进行平滑处理 趋势信号处理 :基于数值变化和动量阈值生成方向性信号 主要特征 直方图显示 :在单独的指标窗口中显示为彩色柱状图 基于趋势的着色 :绿色柱表示看涨动量,红色柱表示看跌动量 无重绘设计 :仅使用已完成的K线以防止当前K线上的信号变化 自适应敏感度 :可配置的阈值系统以过滤市场噪音 信号持续性 :保持趋势方向直到发生显著的动量变化 参数 周期 (Extperiod):用于高低计算的回望周期(默认:10) 信号敏感度 :新信号所需的变化阈值(默认:0.05) 使用完成K线 :通过仅使用完成的K线防
FREE

Eagle Spikes Detector v1.50 - Professional Trading Signal System Ultimate Precision Trading with Advanced SuperTrend Filtering Technology join my telegram channel to trade with me: https://t.me/ +9HHY4pBOlBBlMzc8
The Eagle Spikes Detector is a sophisticated, professional-grade trading indicator designed for serious traders who demand precision, reliability, and visual excellence. Combining advanced multi-timeframe analysis with cutting-edge SuperTrend filtering, this indicator identifi
FREE

该指标基于著名的分形指标,但具有很强的定制性 和灵活性,
这是识别趋势逆转并最大化您的利润潜力的强大工具。
凭借其先进的功能和用户友好的界面,它是各个级别交易者的最终选择。 MT4 版本: Ultimate Fractals MT4 特征 :
可定制的分形蜡烛数。 反转线。 可定制的设置。 用户友好的界面。 主要参数: 左侧蜡烛 - 左侧形成分形的条形数量。 右侧蜡烛 - 分形右侧的条形数量。
不要让市场的不确定性阻碍您。使用“终极分形”指标提升您的交易游戏。
加入成功交易者的行列,依靠此工具做出自信的决策并实现财务目标。 请随意定制此产品描述,以突出显示您的特定“Ultimate Fractals MT5”指标的任何独特功能或优点,
并向我询问有关产品的任何问题或建议。
FREE

气泡指标 —— 价格减速 + 成交量激增检测 一个简单直观的可视化工具,当价格突然放缓并伴随成交量激增时,会在图表上显示彩色方块。
(包含填充功能与同心气泡效果)
它能帮助交易者更清晰地观察市场节奏,发现潜在的关键转折点。 指标功能: 识别市场在启动前“犹豫”的时刻 显示成交量放大但价格波动不大的区域 帮助提前发现潜在的突破信号 工作原理: 分析比当前图表更小的时间周期 检测异常小的K线(价格放缓) 检测异常高的成交量(成交量激增) 显示绿色(看涨)或红色(看跌)方块 主要设置: 价格敏感度: 数值越低,越敏感 成交量倍数: 数值越高,越严格 气泡大小: 调整显示效果 实用价值: 简单直观 无需复杂计算 发现有趣的市场结构与节奏 完全可自定义 非常适合用于区间交易、突破判断或理解市场动态。
Timeframe Simulator Indicator This indicator redraws candlestick structures from a higher timeframe onto your current chart. It helps visualize higher-period price action without switching timeframes, making it easier to analyze trends and key levels while trading on lower timeframes. Main features: Customizable Candles – Adjust the appearance of higher timeframe candles (bull/bear colors, wick style, gaps, and history length). Higher Timeframe Lines – Optionally display dynamic high, low,
FREE
学习如何在MetaTrader AppStore上购买EA交易,MetaTrader平台的应用程序商店。
MQL5.community支付系统支持通过PayPay、银行卡和热门付款系统进行交易。为更好的客户体验我们强烈建议您在购买前测试EA交易。
您错过了交易机会:
- 免费交易应用程序
- 8,000+信号可供复制
- 探索金融市场的经济新闻
注册
登录