Ichimoku Advanced Pro MTF
- インディケータ
-
Hoang Ngoc Thach
 I'm trader and coder.
Please see my products at : https://www.mql5.com/en/users/rockyhoangdn/seller - バージョン: 2.0
- アップデート済み: 7 8月 2021
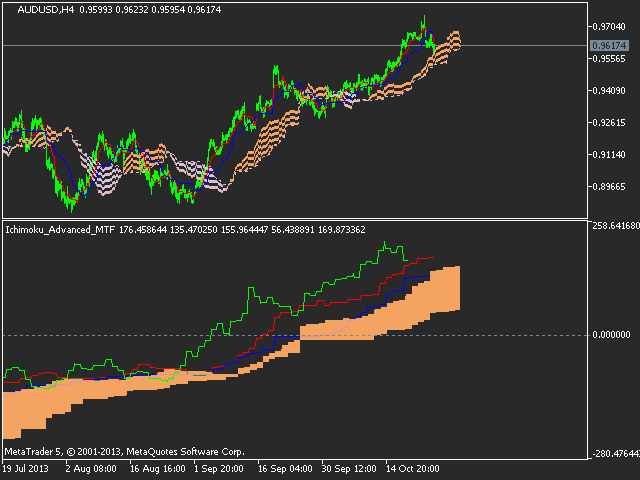
Ichimoku Kinko Hyo is a purpose-built trend trading charting system that has been successfully used in nearly every tradable market. It is unique in many ways, but its primary strength is its use of multiple data points to give the trader a deeper, more comprehensive view into price action. This deeper view, and the fact that Ichimoku is a very visual system, enables the trader to quickly discern and filter "at a glance" the low-probability trading setups from those of higher probability.
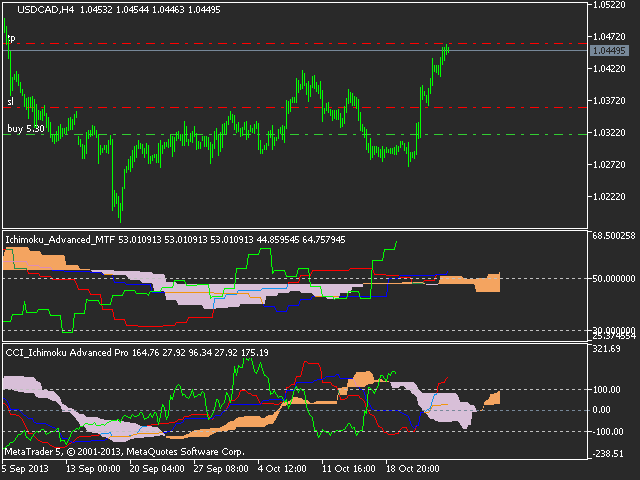
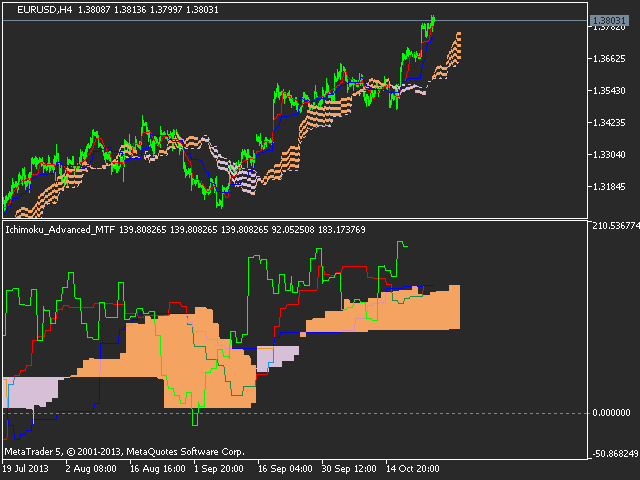
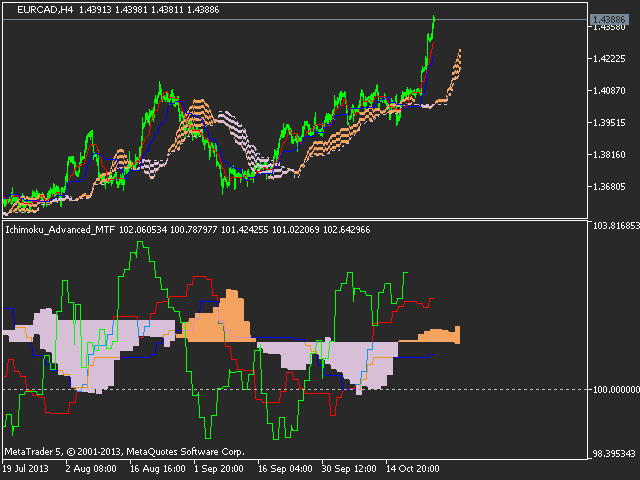
This indicator is based on the standard MT5 Ichimoku Kinko Hyo indicator but I have designed it to track the other values (RSI, CCI, Momentum, TEMA, ...) instead in a sub window.
You can use it as confirmation of other strategies, or if you are a dedicated Ichimoku user, you can use it as a fantastic adjunct to your Ichimoku charts.
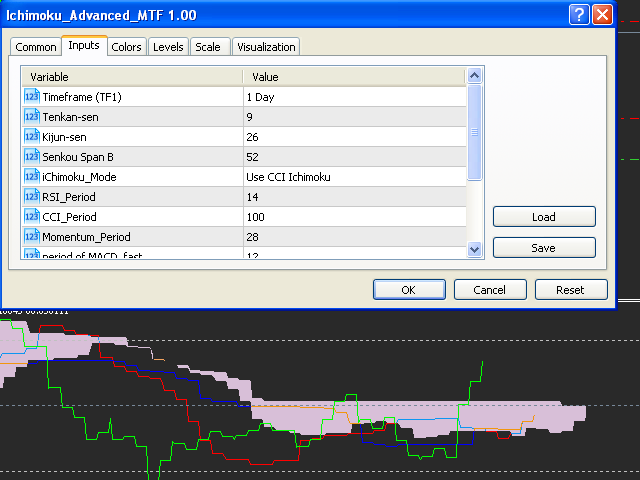
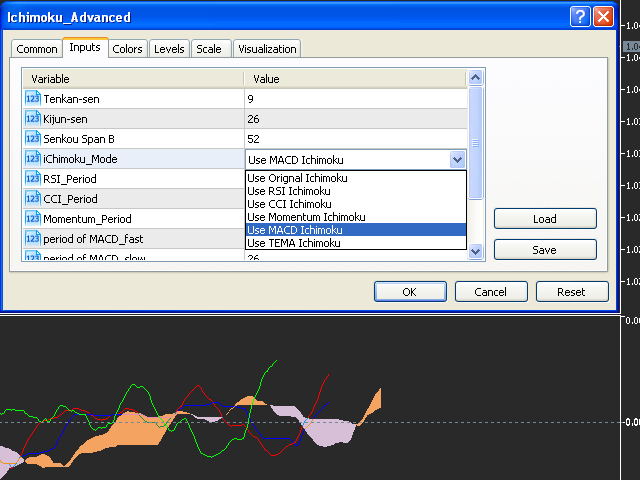
This is a professional version, you can use all Ichimoku types in Properties tab.
Multitimeframe feature was also added.
Buyers who bought this version can request adding new types instead of RSI, CCI.
Отлично