YouTube'dan Mağaza ile ilgili eğitici videoları izleyin
Bir alım-satım robotu veya gösterge nasıl satın alınır?
Uzman Danışmanınızı
sanal sunucuda çalıştırın
sanal sunucuda çalıştırın
Satın almadan önce göstergeyi/alım-satım robotunu test edin
Mağazada kazanç sağlamak ister misiniz?
Satış için bir ürün nasıl sunulur?
MetaTrader 5 için Uzman Danışmanlar ve göstergeler - 44
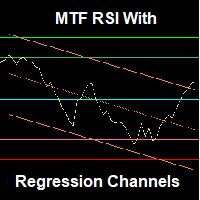
An advanced RSI indicator that displays dynamic linear regression channels in both the indicator window and the price chart, with predefined horizontal levels to detect overbought and oversold zones. Main Features (Summary): Synchronized linear regression channels on both price and RSI Multi–timeframe support Smart and ready-to-use horizontal levels Professional design with optimized performance Feedback & Support We value your experience! If you have any questions, suggestions, or encounter any
FREE
The Round Level Indicator automatically draws psychologically significant price levels directly on your chart.
These round numbers often act as key support and resistance zones across all markets and timeframes.
Round Levels are used in my automated EA: Opal This indicator works best when combined with other tools and strategies, e.g.: Price Action Strategies
Round levels often align with key support/resistance. Use it with candlestick patterns (like pin bars or engulfing bars) to confirm high
FREE

What does this indicator do? Stochastic Signal Pro analyzes market momentum using an optimized Stochastic Oscillator to detect: Overbought zones Oversold zones High-probability reversal points It automatically generates Buy and Sell signals directly on the chart. Key Features Buy & Sell arrows
No repaint signals
Works on MT5
All timeframes
All symbols (Forex, Gold, Indices, Crypto)
Beginner friendly
Lightweight & fast Alerts Included MT5 popup alert Sound alert Push notif
FREE

BTC High Definition is an EA designed to trade Bitcoin (BTCUSD) on the H1 timeframe, focused on stable execution and solid statistical performance in testing. It is optimized for IC Markets and intended for traders looking for a balanced system between trade frequency, risk control, and consistency.
Performance highlights (backtest)
Initial deposit: 300 USD
Total net profit: +6,356.40 USD
Profit Factor: 2.11
Recovery Factor: 24.98
Sharpe Ratio: 7.49
Expected Payoff: 14.99
Total trades:

PipsCounter Basic , MetaTrader 5 için geliştirilmiş bir indikatördür. Açık pozisyonların pip değişimini gerçek zamanlı olarak gösterir ve gün içindeki kapatılmış işlemlerin özetini sağlar. Tüm bilgiler, grafik ana penceresinde net ve dikkat dağıtmayan bir formatta görüntülenir. Özellikler Gerçek zamanlı pip takibi
Her piyasa tikinde, aktif pozisyonların pip farkını sürekli olarak günceller. Günlük pip toplamı
Güncel işlem gününde kapatılmış tüm işlemlerin net pip değerini gösterir. TP/SL fiyat
FREE
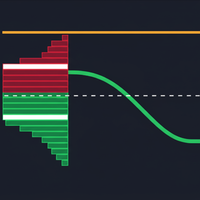
The "Volume Range Profile with Fair Value" (VRPFV) indicator is a powerful volume analysis tool designed to help traders better understand market structure and identify key price areas where significant institutional activity occurs. Instead of just looking at volume on individual candlesticks, VRPFV analyzes the distribution of volume by price level within a specific time range, providing deep insights into the "footprint" of smart money. VRPFV consists of the following core components: Upper &
FREE

Çoklu para birimi ve çoklu zaman dilimi göstergesi MACD. Kontrol paneli hem Geleneksel (gerçek) MACD'yi hem de MetaTrader'da yerleşik olan MACD'yi görüntüleyebilir.
Panelde göstergenin mevcut durumunu, MACD çizgilerinin hareket yönünü, kesişimlerini ve gösterge grafiğini içeren bir açılır pencereyi görebilirsiniz. Parametrelerde istediğiniz herhangi bir çift sembolü ve zaman dilimini belirleyebilirsiniz. Tarayıcı aynı zamanda birbirini kesen çizgiler ve Sıfır seviyesini geçen çizgiler hakkında

A useful dashboard that shows the RSI values for multiple symbols and Time-frames. It can be easily hidden/displayed with a simple click on the X top left of the dashboard. You can input upper and lower RSI values and the colours can be set to show when above/below these values. The default values are 70 and 30. You can choose whether the dashboard is displayed on the right or left of the chart. If you want to have 2 dashboards on the same chart you must input a different name for each. The sca
FREE
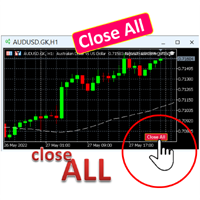
A simple button to completely close all existing open trades (both Buy and Sell) on the current chart .
Warning : Once the button is pressed, all open trades on the current chart will be deleted immediately without any more questions or dialogue.
Use this utility very carefully. We recommend that you do a trial of removing open trades on a demo account first, before trying to use this utility on a real account.
FREE

Introduction The Parabolic SAR (Stop and Reverse) indicator is a technical analysis tool designed to identify potential trend reversals and provide trailing stop-loss levels. This enhanced version of the standard Parabolic SAR for MetaTrader 5 offers improved visual clarity, customizable alerts, and an optional trend confirmation filter to assist traders in their analysis. Features Enhanced Visualization: Displays Parabolic SAR dots in two distinct colors (Lime for uptrends, Red for downtrends)
FREE

"NagaRecoil" EA: A highly durable and resilient trading solution for long-term results
The long-awaited EA "NagaRecoil" has finally been released! This EA utilizes two high-performance indicators, RSI and RFTL, to skillfully capture market trend fluctuations and determine the optimal entry point. RSI sensitively detects market overheating, and RFTL predicts future price movements. This combination provides signals for buying and selling. Furthermore, as its name suggests, "NagaRecoil" develops
FREE

Draw and Sync Objects Multiple Charts 1. Draw objects by key press. ( You must: 1. Press Function key => 2. Click where you want to draw => 3. Draw it => 4. Press ESC to complete). (If you don't want to draw after pressing function key, you must press ESC to cancel). 2. Developing : Sync selected objects to multiple charts by button. 3. Developing: Hide objects that do not belong to the current symbol (Objects drawn with this indicator will belong to the symbol they are plotted on. When your c
FREE

FVG Smart Zones – Ücretsiz Sürüm MetaTrader 5 (MT5) için Adil Değer Boşlukları (FVG) Algılama Göstergesi Sadece başka bir rastgele gösterge değil, gerçek bir ticaret aracı mı arıyorsunuz?
FVG Smart Zones – Ücretsiz Sürüm , Adil Değer Boşluklarını (FVG) otomatik olarak algılar ve grafiğinizde yüksek olasılıklı ticaret bölgelerini vurgulayarak profesyonel piyasa içgörüsü sağlar. Bu gösterge şu traderlar için tasarlanmıştır:
Akıllı Para Konseptleri (SMC)
ICT Ticaret Konseptleri
Fiyat H
FREE

Volume Calculator
This indicator shows the volume to be used in an operation based on the maximum acceptable stop value and the size of the stop. That way you will not use a calculator to calculate the volume you are going to use every time. This indicator makes your life much easier and faster. Suitable for any type of trader: Scalper, DayTrader, SwingTrader.
FREE

Gold Daily Top Bottom Engine 2026 by Arslan Rouf
Gold Daily Top Bottom Engine is a professional-grade analytical tool designed for traders who focus on market structure, precision, and high-probability reversals rather than lagging indicators.
This engine does not use traditional indicators, oscillators, or repainting logic. It is built on daily range behavior, adaptive structure analysis, and liquidity sweep concepts, presented through a clean and decision-focused smart panel.
Key Features:
FREE
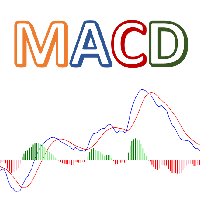
Colorful MACD is MT5 version of TradingView default MACD. This indicator has 4 different colors for MACD histogram, so it's so easy to detect fluctuations in histogram. Features: Colorful Histogram Bars Show/Hide Signal Line Show/Hide MACD Line Flexible price control Please call me if you need more input parameters or modified version of this indicator.
FREE

The Horse DCA Signal 1.26 – สุดยอดนวัตกรรมอินดิเคเตอร์สำหรับการเทรดทองคำและทุกสินทรัพย์ The Horse DCA Signal คืออินดิเคเตอร์รุ่นล่าสุดจากตระกูล WinWiFi Robot Series ที่ได้รับการออกแบบมาเพื่อยกระดับการเทรดบนแพลตฟอร์ม MT5 โดยเฉพาะ โดยเป็นการผสมผสานอัจฉริยะระหว่างกลยุทธ์ Follow Trend และ Scalping เข้าด้วยกันอย่างลงตัว คุณสมบัติเด่น: ระบบลูกศรแยกประเภทชัดเจน: ลูกศรสีทอง: บ่งบอกสภาวะตลาดช่วง Sideway เหมาะสำหรับการเทรดแบบ Swing Trade หรือ Scalping เก็บกำไรระยะสั้น (2) ลูกศรสีน้ำเงินและสีแดง: บ่งบอกส
FREE

LIVE SIGNAL - https://www.mql5.com/en/signals/2339751
CrazyGOLD-M1 is a professional Expert Advisor optimized for trading XAU/USD on the M1 (1-minute) timeframe .
Its architecture is built on ICT (Inner Circle Trader) concepts, focusing on liquidity zones and swing resistance to identify high-probability entries. The gold market has been highly unpredictable in recent years, and many traders struggle to manage it manually. CrazyGOLD-M1 provides a reliable solution by applying systematic ana

Ice Scalper Pro is a fully automated scalping robot that uses a highly effective breakout strategy, advanced money management, probabilistic analysis and advanced techniques that allow it to detect a change in trend very early. Current price $55 for the first hundred (100) buyers, final price will be $9999 . MT4 Version : https://www.mql5.com/en/market/product/94060 The strategy is executed with pending orders that are automatically triggered once the price crosses the indicated levels. Th
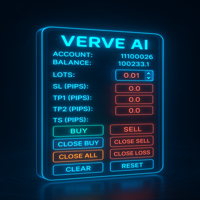
FXTrade Panel – Akıllı ve Hızlı MT5 İşlem Yöneticisi
FXTrade Panel, MetaTrader 5 için tek tıklamayla işlem yürütme ve yönetimi ile alım satım verimliliğinizi artırmak için tasarlanmış gelişmiş ama kullanımı kolay bir işlem aracıdır.
Ana Özellikler: • Hesap Genel Bakış: hesap numarası, kaldıraç, bakiye ve mevcut spread’i gösterir. • Lot Boyutu Kontrolü: sezgisel artı/eksi düğmelerle ayarlanabilir lot boyutu. • Risk Yönetimi: pip cinsinden Stop Loss (SL), Take Profit (TP1, TP2) ve Trailing
FREE

This indicator was created based on posts from forex factory thread titled There is no Magic Moving Average - You need only one - by @andose2 a.k.a Andrei Florin. If you want to know about how to use this trading strategy please go and read https://www.forexfactory.com/thread/691864-there-is-no-magic-moving-average-you.
Note: Below are extracts some of the posts .
Estabilish a trend, based on Market Cycles, then go only long in the Markup Phase and only short in the Decline phase , st
FREE
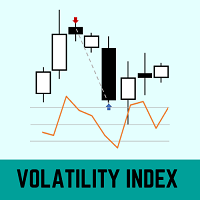
This indicator uses historical volatility and a 21-period moving average to define the price distortion in relation to the average.
The calculation of historical volatility was based on the book (Odds: The Key to 90% Winners) written by Don Fishback.
A Volatility Index with a value greater than 30 may indicate that the price is distorted from its fair price.
QUESTIONS ABOUT THE INSTALLATION OF PRODUCTS AT META TRADER You can also find some instructions on how to install a robot in the Me
FREE

Finansal piyasalarda işlem yapıyorsan, spreadin ne kadar önemli olduğunu mutlaka biliyorsundur — alış fiyatı (ask) ve satış fiyatı (bid) arasındaki bu fark, kârını ciddi şekilde etkileyebilir. Spread Size , mevcut spreadi doğrudan grafik üzerinde gösteren basit ama oldukça faydalı bir göstergedir. Artık verileri sürekli manuel olarak izlemene gerek yok — her şey gözlerinin önünde! Neden gerekli?
Spread sadece bir rakam değildir. O senin gerçek paran. Düşük spread, işleme giriş ve çıkış maliyet
FREE
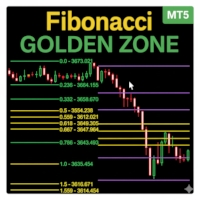
Fibonacci Sessions Göstergesi, hassas scalping ve gün içi stratejiler için tasarlanmış güçlü bir ticaret aracıdır. New York, Londra ve Asya seansları için otomatik olarak önemli Fibonacci seviyelerini çizer ve yatırımcılara ana piyasa seanslarındaki fiyat hareketlerinin net bir görünümünü sunar. Her seansta fiyatın en çok tepki verdiği benzersiz "Altın Bölgeler" vurgulanır. Bu, dönüşler, kırılmalar ve trend yönlü işlemler için son derece güvenilir bölgeler oluşturur. Gösterge, fiyatın sık sık bi
FREE

Heiken Ashi Yemeni Heiken Ashi Yemeni is a professional indicator for MetaTrader 5 that combines modified Heiken Ashi candles with two smart trend lines ( Yemen 1 & Yemen 2 ) based on advanced and complex internal calculations, providing a clearer view of the trend and reducing market noise. The indicator is designed to give traders a smooth and easy-to-read market overview , making it suitable for manual trading and trend-based strategies . Indicator Features Enhanced Heiken Ashi candles for
FREE

AlphaPrice MT5 is a trading Expert Advisor (EA) designed for the Forex market and other financial markets via the MetaTrader 5 platform. It is based on a price momentum trading strategy, allowing it to effectively capture strong price movements while minimizing risks during stagnant periods. The EA uses minimal settings, making it easy to set up quickly, and completely avoids risky methods such as martingale and grid strategies. Key Features: Momentum Trading – The EA analyzes market mom
FREE

Overview Auto Fibonacci EA is a professional trading tool designed to automatically detect swing points and draw Fibonacci retracement levels on your charts. This indicator helps traders identify potential support and resistance zones based on the golden ratio principles. Key Features Automatic Swing Detection Intelligent algorithm identifies swing high and swing low points automatically Customizable swing detection sensitivity (SwingBars parameter) Works on all timeframes: M1, M5, M15, M30, H1
FREE
The Linear Regression Candles indicator is a powerful tool that enhances traditional candlestick analysis by incorporating linear regression techniques. It helps traders visualize market trends more clearly by smoothing price movements and reducing noise. Unlike standard candles, Linear Regression Candles are dynamically calculated based on statistical regression, providing a clearer picture of the prevailing market direction.
Key Features: • Trend Identification – Highlights the overall mar
FREE

The Rapid Reaper EA is a fully automated hybrid averaging EA that trades in sequences of lot increase and multiplication on both sides of the book. The system trades using market orders with take profits set across trade groups. This EA will work on any pair but works best on GBPUSD and USDCAD on the M5 timeframe. A VPS is advisable when trading with this EA. Check the comments for back test results and optimized settings. Please note: I have made the decision to give this EA away and many more
FREE

Bias Scanner Pro identifies market direction and trend strength in real time, giving you a clear view of bullish, bearish, or neutral bias. By combining EMA crossovers with ADX trend analysis, it delivers precise market context and actionable insights for traders of any style. How It Works Bias Detection: Fast and slow EMA crossovers identify bullish, bearish, or neutral market direction. Trend Strength Confirmation: ADX measures trend intensity, confirming whether the market is trending, rangin
FREE

This EA uses two moving averages one slow and one fast, when ever they cross it checks if the RSI value is greater or lesser than 50 depending on the signal given by the Moving averages. After that it checks if the Stochastics lines are going up or down and not in the Over Bought or Over sold zone. so in total it uses an RSI, 2 Moving Averages ,Stochastics and an ATR to try to evade stop hunting.Also has a trailing function to hold the profits if price moves X pips tested on a 5 min time frame
FREE

Description:
Heikin-Ashi-like swing oscillator candles. It can be used in the same way as RSI or Stochastic.
For example: Zero crossing. Above the zero line is bullish, below the zero line is bearish.
Overbought or oversold. 100 line is the extreme bought level, -100 line is the extreme sold level.
Divergences.
Time frame: Any time frame.
Instrument: Any instrument.
FREE

MT4 Version Most indicators draw lines.
This one draws the battlefield. If you ever bought an EA or indicator based on a perfect equity curve — and then watched it bleed out live — you’re not alone.
The problem? Static logic in a dynamic market. Fibonacci Bollinger Bands adapts.
It combines Bollinger structure with customizable Fibonacci levels to mark zones of control — where price reacts, pauses, or reverses. No magic. Just logic that follows volatility. Why this tool matters It
FREE

Product Name: Auto Trend Pattern Pro [Subho - India] Short Description:
An advanced Price Action tool that automatically detects and draws Trend Channels, Wedges, and Triangles with a live Dashboard. Full Description: Auto Trend Pattern Pro is a sophisticated technical indicator designed for MetaTrader 5. It automates the complex task of drawing Trend Lines and Channels. By analyzing historical price action, the indicator identifies the most accurate "Best Fit" channels for both short-term
FREE

Think of the Super Fractal Indicator as the Bill WIlliams Indicator on Steroids. Indicator Abilities: 1. Adjust Candle around Fractal High or Low. 2. Adjust Lookback period and only plot for a specific number of history candles avoiding cluttering your trading desk. 3. The Indicator uses buffers so you call and use it from any EA.
Note : The higher the candles around Fractal, the stronger the Turning point anfd viceversa is true.
FREE

Description This technical indicator is designed to automate the analysis of market structure based on price action concepts. It identifies and labels key structural points, including Higher Highs (HH), Lower Lows (LL), Lower Highs (LH), and Higher Lows (HL), to assist traders in visualizing market trends. The indicator uses a configurable "Swing Strength" logic, checking a user-defined number of bars to the left and right of a pivot to confirm its validity. It also identifies Break of Structure
FREE

Birkaç varlıkla çalıştığınızda ve varlıklarda birkaç açık pozisyona sahip olduğunuzda, her bir aktif sorunun ne zaman kâr veya kâr verdiğini görselleştirmek biraz karmaşıktır, bu nedenle bunu akılda tutarak, varlıklardaki işlemlerin görselleştirilmesini kolaylaştırdığı bu göstergeyi geliştirdik. , burada birkaç farklı kaynak açabilecek ve her bir varlığın bireysel sonucunu görselleştirebilecek ve işinizde karar vermenizi hızlandırabileceksiniz.
FREE

Lansman Teklifi: Sınırlı süre için geçerli giriş fiyatı. Erken alıcılar, standart fiyat uygulanmadan önce özel lansman indirimiyle tam erişim elde eder. Institutional Session Sweep Stratejisi Abartılı vaatler yok, gerçekçi olmayan optimizasyonlar yok, hayaller yok. Sadece gerçek piyasa mantığına dayanan kanıtlanmış bir strateji. SessionSweep, önemli piyasa seanslarında gerçekleşen likidite süpürmelerinin ardından oluşan dönüşleri yakalamak için tasarlanmış otomatik bir işlem sistemidir. Büyük oy

DawnDuskDynamics EA DawnDuskDynamics is a sophisticated trading algorithm that leverages the well-known Morning Star and Evening Star candlestick patterns to identify potential market reversals. This Expert Advisor is designed for traders looking to automate their trading strategies on major currency pairs, ensuring a systematic approach to forex trading. Key Features: Trading Strategy : Utilizes the Morning Star and Evening Star patterns to determine entry points, enhancing the probability of
FREE

Are you tired of drawing trendlines every time you're analyzing charts? Or perhaps you would like more consistency in your technical analysis. Then this is for you. This indicator will draw trend lines automatically when dropped on a chart. How it works Works similar to standard deviation channel found on mt4 and mt5. It has 2 parameters: 1. Starting Bar 2. Number of bars for calculation The starting bar is the bar which drawing of the trend lines will begin, while the number of bars for c
FREE

GridMA Scalper EA is a semi-aggressive grid-based trading robot that combines Moving Average (MA) crossover logic with time-filtered grid entries. It is designed to capture both trending and pullback opportunities with built-in risk control mechanisms. Strategy Overview: Uses MA crossover (SMA 21) as signal Automatically opens grid entries when price moves against initial entry Supports both BUY and SELL directions Grid lot size increases using a multiplier Built-in trailing stop, breakeve
FREE

The Market Momentum indicator is based on the Volume Zone Oscillator (VZO), presented by Waleed Aly Khalil in the 2009 edition of the International Federation of Technical Analysts journal, and presents a fresh view of this market valuable data that is oftenly misunderstood and neglected: VOLUME. With this new approach of "seeing" Volume data, traders can infer more properly market behavior and increase their odds in a winning trade.
"The VZO is a leading volume oscillator; its basic usefulness
FREE

Adaptive Moving Average (AMA) is a trend indicator using moving average and market noise filter. Indicator feature are blue and red points, showing the power of trend. Recommendations for trading: Auxiliary Indicator Detecting trend Detecting power of trend Detecting potential reversal points Main indicator Shows entry points for swing trading Serves as dynamic support and resistance Recommendations for use: Any instrument Any timeframe Input parameters: Period - AMA period Fast Period - fast MA
FREE

Build your EA with Build EA Simple, with it you can build your strategy with the available indicators and tools.
Build EA Simple does not have any defined strategy, but with it you can use combinations of indicators and use them as signals or filters and build your strategy!
Build EA Simple is a simplified version of Build EA that doesn't have as many tools. Discover Build EA Pro https://www.mql5.com/pt/market/product/88859?source=Unknown%3Ahttps%3A%2F%2Fwww.mql5.com%2Fpt%2Fmarket%2Fmy
Indi
FREE

EA_XAU_PreLondon_MicroRange_FINAL
XAUUSD – Londra Öncesi Mikro Aralık Seviyesi Ticaret EA
Kısa Açıklama
EA_XAU_PreLondon_MicroRange_FINAL, Londra seansı öncesinde dar bir mikro aralık oluşturan ve yalnızca açıkça tanımlanmış fiyat seviyelerinin üzerinde kırılmaları ticaret eden, zaman aralığı tabanlı bir XAUUSD Uzman Danışmanıdır.
Odak noktası, yüksek işlem sıklığı değil, temiz piyasa yapısı, kontrollü işlem ve tutarlı risk yönetimidir.
İşlem mantığı (kavramsal)
Zaman aralığı (Pre-London)
E
FREE

Correlation Matrix Pro - Çoklu Döviz Hedge Tarayıcı Döviz çiftleri arasındaki ilişkileri gerçek zamanlı olarak anlayın! 6 döviz çifti arasındaki istatistiksel ilişkileri aynı anda görselleştirmenize yardımcı olan güçlü bir analiz aracıdır. Portföy yönetimi, risk çeşitlendirmesi ve hedge stratejileri için mükemmeldir. TEMEL ÖZELLİKLER - Logaritmik getiriler kullanan gerçek zamanlı Pearson korelasyonu - Aynı anda 6 döviz çiftini izleme - Otomatik zaman dilimi algılama - Ayarlanabilir geriye bakış
FREE
The RFOC Candle Timer 2x was created for the trader to locate himself in time, having access to the pending time for the formation of a new candle. Additionally, it is possible to include in the chart a second timer that shows the pending time for the formation of a new candle in a time period different from the current one. The user will have the option to select up to 4 different positions for the timer display ("No candle", lower left corner, lower right corner or upper right corner). In ad
FREE

Gold Storm Signals - Professional XAU/USD Trading Indicator
Gold Storm Signals is a premium multi-confirmation indicator for Gold (XAU/USD) trading on MetaTrader 5. Get precise buy/sell signals with automatic stop loss and take profit levels displayed directly on your chart.
KEY FEATURES:
- Clear Buy & Sell Signal Arrows - Automatic ATR-Based Stop Loss Calculation - Dual TP Levels (TP1 & TP2) - Complete Alert System (Push, Email, Sound) - Works on All Timeframes (M1 to D1) - No Repainting -
FREE

Trend-Based Trading Assistant PRO is a professional-grade Smart Money Concepts (SMC) and Price Action toolkit designed for MT5. It automates the detection of essential market structure shifts, allowing traders to identify high-probability trend reversals and continuation patterns without manual charting. By combining institutional-level logic with a powerful EMA trend filter, this indicator helps you stay on the right side of the market while avoiding "noise" and false signals. Core Features: A
FREE

Pip Value Calculator - Instant Risk Assessment on Your Chart This powerful and lightweight utility instantly calculates the precise monetary value for any pip movement, displaying it directly on your chart so you can assess risk and potential profit at a glance. At its core, the indicator's sophisticated calculation engine runs silently with every price tick, ensuring the information you see is always up-to-date. It automatically detects the instrument you are trading—whether it's a Forex pair,
FREE
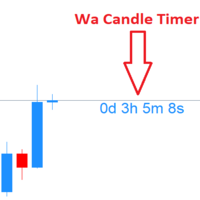
Wa Candle Timer MT5 , MT5 grafiğinizde bir sonraki mum oluşana kadar kalan süreyi gösteren güçlü ve kullanıcı dostu bir göstergedir. Mum kapanış sürelerinin farkında olmanıza yardımcı olarak daha iyi işlem yürütme ve karar verme sağlar. Temel Özellikler :
Mevcut mum için geri sayım sayacı gösterir.
Kalan süre, kullanıcı tarafından tanımlanan yüzde seviyesinin altına düştüğünde renk değiştirir.
Belirli bir yüzdeye ulaşıldığında özelleştirilebilir uyarı verir.
Yazı tipi ve renkler tama
FREE

Index Stalker EA (v1.x Series) Prop Firm Ready
Stay on the Rules
1% Risk Margin.
3% Daily Drawdown.
$10000 account.
Please Don't Hesitate to Contact me for any info you need. 1. High-Impact Product Description In the volatile currents of the NASDAQ 100, the greatest opportunities are found not through brute force, but through precision and patience. Introducing Index Stalker EA , the sophisticated trading tool engineered to silently track and execute high-probability setups with surgical accu
FREE

Introducing our innovative Expert Advisor (EA) designed to capitalize on pullback opportunities in the forex market, with the support of the Average True Range (ATR) indicator. This strategy focuses on identifying moments when the price temporarily retraces within a dominant trend, offering potential entry points with controlled risk. The ATR is a volatility indicator that measures the amplitude of price movements over a given period of time. By integrating the ATR into our EA, we can assess the
FREE
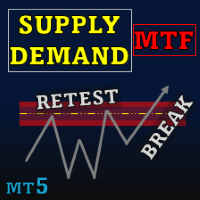
Special offer : ALL TOOLS , just $35 each! New tools will be $30 for the first week or the first 3 purchases ! Trading Tools Channel on MQL5 : Join my MQL5 channel to update the latest news from me Supply Demand Retest and Break Multi Timeframe , bu araç güçlü momentum mumlarına dayalı olarak arz ve talep bölgelerini çizer ve timeframe selector özelliği sayesinde bu bölgeleri birden fazla zaman diliminde tanımlamanızı sağlar. Retest ve break etiketleri ile özelleştirilebilir do
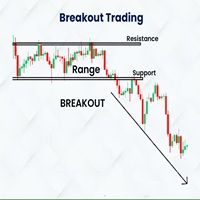
Indicador Basado en la estrategia de ruptura del rango de londres de Amaury Benedetti.
Este indicador dibuja automaticamente el rango, el maximo y minimo y sus correspondientes lineas de stoploss, entrada y takeprofit.
SE RECOMIENDA USAR EN M1 EN EL US30 (DE ACUERDO A LA ESTRATEGIA)
Los valores se pueden modificar de acuerdo a la necesidad del usuario, tambien se tienen mas configuraciones para dibujar cualquier rango en diversos horarios y con diferentes configuraciones de sl, tp, etc
Detal
FREE

Session Killzone Indicator
Indicator that helps you to identify the killzone times of both London and NewYork sessions which usually is the most times for high volatility and taking liquidity from the market. Killzone times are configurable through indicator parameters. The indicator adjusts the range of the killzones based on the daily trading range.
FREE
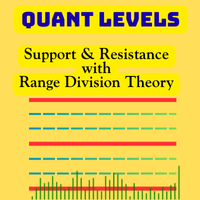
Quant Levels Indicator is a premium component of the Quantitative Trading Analysis Toolkit , designed to transform subjective trading into data-driven decision making. This advanced tool provides institutional-grade support and resistance analysis directly on your MT5 charts. " Please support our work by leaving a review ". As a thank-you gift , we’ll share a special template that helps you display signal trade history directly on your chart. Free indicator to visualize any MT5/MT4 signals i
FREE

Turn Gold Volatility into Profits — 24/7.
AI-powered XAUUSD bot with multi-strategy engine, precision SL/TP, and 10+ years of trading experience behind it.
Grew a 10K USC account to 50K USC — now it’s your turn.
Minimum Investment: $300 or 10000 USC Timeframe: H1 Symbol: Only Gold / XAUUSD We have clubbed all strategies and fine tuned the target levels. We use AI to calculate target & stop levels. We convert all indicators pattern trading signals into profit making trades. It has to be connec

75% Off until August 30, 2025.
Asset: Gold TimeFrame: Any sample .set file for XAUUSD 1 Minute is in the comment section. You can view EA Live Performance on myfxbook . SMC Candlestick Trader for MT5 is a powerful Expert Advisor built specifically for trading Gold (XAUUSD) on the any timeframe. It identifies 11 different candlestick patterns on higher timeframes (M15, M30 & H1) and executes only high-probability break of structure (BOS) or change of character (CHOCH) trades that are validated b
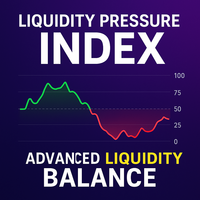
Liquidity Pressure Index (LPI) is an advanced technical indicator designed to uncover the hidden battle between buyers and sellers in the market. Unlike conventional oscillators that only rely on price movements, LPI integrates market depth (order book data), ATR-based volatility compression, and adaptive smoothing to give traders a deeper view of true liquidity dynamics.
By combining price action with volume absorption and order flow pressure, the LPI helps traders anticipate shifts in market
FREE

Automatic Trend Line Fit. This indicator automatically plots the straight line and parabolic (curved) trend to any symbol at any timeframe. The plotted straight line is a good indication of the current trend and the curved line is an indication of a change momentum or change in the current trend. Plotting the straight line over about 2/3 the number of candles as the curved line is usually a good way to determine entry and exit points as it shows the current trend and momentum of the market. This
FREE

Açılış Gap EA'sı özellikle hisse senedi fiyatlarının açılışındaki boşlukların ticareti için uygundur. Hisse senetleri genellikle düştüklerinden daha fazla yükseldikleri için sadece alış pozisyonları açılmaktadır. İşlem, işlem saatlerinin bitiminden kısa bir süre önce yapılır ve ertesi gün açıldıktan hemen sonra kapatılır. Burada oluşan boşluk daha sonra kâr olarak alınır. NVDA ile yapılan arka testte iyi karlar elde edildi. Bu EA, EA portföyünüze iyi bir katkıdır.
EA'nın avantajları:
- Mar
FREE
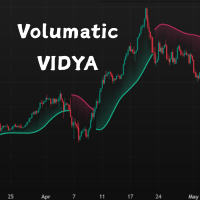
This is a custom VIDYA-based trend-following indicator for MetaTrader 5 (MT5), enhanced with ATR-band logic to adapt to market volatility. It provides dynamic trend zones and intelligent direction switching to support better trading decisions.
Unlike traditional moving averages, this indicator uses a momentum-adjusted VIDYA (Variable Index Dynamic Average) and combines it with ATR-based bands to detect trend shifts with greater precision. Features
Volatility-Adaptive Trend Logic – Uses ATR ban
FREE

Pivot Point Supertrend (corresponds to Pivot Point Super Trend indicator from Trading View) Pivot Point Period: Pivot point defined as highest high and highest low... input 2 = defining highest high and highest low with 2 bars on each side which are lower (for highest high) and are higher (for lowest low calculation) ATR Length : the ATR calculation is based on 10 periods ATR Factor: ATR multiplied by 3
FREE

Farklı döviz çiftlerinin davranışları birbirine bağlıdır. Görsel Korelasyon göstergesi, ölçeği korurken farklı araçları 1 grafikte görüntülemenize olanak tanır. Pozitif, negatif veya korelasyon olmadığını tanımlayabilirsiniz.
Bazı aletler diğerlerinden daha erken hareket etmeye başlar. Bu tür anlar üst üste bindirilen grafiklerle belirlenebilir.
Bir enstrümanı grafikte görüntülemek için Sembol alanına enstrümanın adını girmelisiniz. Version for MT4 https://www.mql5.com/tr/market/product/3306
FREE
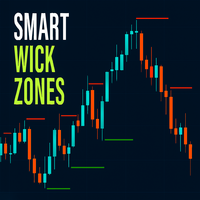
Smart Wick Zones indicator is a powerful tool designed to highlight hidden areas of price rejection and liquidity on your chart. By analyzing candle wicks (also called shadows or tails), the indicator automatically draws horizontal zones where strong buying or selling pressure has previously appeared. These wick zones often mark turning points in the market or areas where price reacts strongly, making them excellent references for support and resistance.
Instead of manually scanning candles for
FREE

>>> CHRISTMAS SALE: -60% OFF! - Promo price: $68 / Regular price $169 <<< - The promotion will end soon!
Forex Trend Hunter Live Results: https://www.mql5.com/en/signals/2302404 Forex Trend Hunter is an entirely automated trading system for the MetaTrader 4 trading terminal, developed especially for the needs of ordinary forex traders, yet also used successfully by many professional traders.
Forex Trend Hunter is perhaps the best trend-following and long-term profitable Forex robot on the ma

It is a panel that seems common, however, far beyond those of additional buttons for closing multiple orders, it is essential for those using the offline charts generators for Renko, Range, Ticks, and similars because in the Metatrader 5 does not allow the manual operation of orders in these charts that are generated synthetically. The "TRADE PANEL" makes it very easy to handle both orders executed to the market and the placing of pending orders, offering practically the same immediate action
FREE

This Drawdown monitor EA allows you to sleep relaxed and avoid blowing up your account Don't lose more money than you had planned ! This Free version of Drawdown monitor EA can be used freely and without limitations on a demo account. You can set up and test all parameters, verify that the operation meets your needs, and then purchase the licensed version to use on your live account at this link: https://www.mql5.com/en/market/product/156389
Link to the User Manual For any doubts, questions,
FREE

Overview EMA Scalper is a technical indicator designed for the MetaTrader 5 platform. This tool helps traders identify potential trading signals based on the crossover between price and an Exponential Moving Average (EMA), combined with a dynamic price channel. The indicator is suitable for scalpers or day traders and works across various timeframes and financial instruments. How It Works The indicator's logic is based on two main components: EMA Crossover: The core signal is generated when the
FREE
MetaTrader mağazası, geçmiş verilerini kullanarak test ve optimizasyon için alım-satım robotunun ücretsiz demosunu indirebileceğiniz tek mağazadır.
Uygulamaya genel bakışı ve diğer müşterilerin incelemelerini okuyun, doğrudan terminalinize indirin ve satın almadan önce alım-satım robotunu test edin. Yalnızca MetaTrader mağazasında bir uygulamayı tamamen ücretsiz olarak test edebilirsiniz.
Alım-satım fırsatlarını kaçırıyorsunuz:
- Ücretsiz alım-satım uygulamaları
- İşlem kopyalama için 8.000'den fazla sinyal
- Finansal piyasaları keşfetmek için ekonomik haberler
Kayıt
Giriş yap
Gizlilik ve Veri Koruma Politikasını ve MQL5.com Kullanım Şartlarını kabul edersiniz
Hesabınız yoksa, lütfen kaydolun
MQL5.com web sitesine giriş yapmak için çerezlerin kullanımına izin vermelisiniz.
Lütfen tarayıcınızda gerekli ayarı etkinleştirin, aksi takdirde giriş yapamazsınız.