Robots comerciales e indicadores para MetaTrader 5 - 153

ROSSI CAMPOS ULTRA TRADER EA – ¡El Guardián Inteligente de Tus Ganancias! ¿Por qué fue creado?
Las soluciones disponibles en el mercado eran complejas, pesadas o simplemente no funcionaban correctamente. Decidí crear algo ligero, preciso y confiable. Características Exclusivas: Ligero y estable — Cero bloqueos o conflictos. Configuración intuitiva — ¡Solo completa los campos y listo! Precisión milimétrica — Cálculos basados en el tick actual. Universal — Funciona en cualquier activo y marco tem
≤§≥ El indicador Position Manager de canal mágico rojo le ayuda a construir un plan de trading desde cero
y muestra todos los parámetros directamente en el gráfico.
≤§≥ Todos los productos de canal mágico rojo vienen con un manual en pdf en inglés.
Aquí está el enlace para el indicador Position Manager : https://drive.google.com/file/d/1tPoyo7EUJghH5I8fQARzbqXYh_UOn67V/view?usp=sharing
≤§≥ Si tiene algún problema con el indicador Position Manager, póngase en contacto con nosotros en redmagic
≤§≥ El Indicador de Bloques de Órdenes de canal mágico rojo escanea el gráfico en busca de bloques de órdenes utilizando varios filtros
y muestra líneas horizontales en los precios máximos y mínimos de la vela del bloque de órdenes.
≤§≥ Todos los productos de canal mágico rojo incluyen un manual en pdf en inglés.
Aquí está el enlace para el Indicador de Bloques de Órdenes : https://drive.google.com/file/d/1tPoyo7EUJghH5I8fQARzbqXYh_UOn67V/view?usp=sharing
≤§≥ Si tiene algún problema con el I
≤§≥ El Indicador de Tendencia de canal mágico rojo muestra los máximos y mínimos relevantes.
Esto le permite detectar fácilmente los retrocesos y los movimientos de continuación de tendencia.
≤§≥ Todos los productos de canal mágico rojo vienen con un manual en pdf en inglés.
Aquí está el enlace para el Indicador de Tendencia : https://drive.google.com/file/d/1tPoyo7EUJghH5I8fQARzbqXYh_UOn67V/view?usp=sharing
≤§≥ Si tiene algún problema con el Indicador de Tendencia, póngase en contacto con n

Gold Scalper Ultimate está diseñado para el scalping agresivo y el trading preciso a corto plazo en los mercados Forex. Gold Scalper Ultimate es un Asesor Experto totalmente automatizado construido para identificar señales de compra y venta de alta probabilidad utilizando trailing stops avanzados basados en ATR y análisis opcional de velas Heikin Ashi. Está optimizado para estrategias de scalping y funciona en múltiples marcos temporales con una latencia mínima. El EA incluye: Gestión avanzada d

News Expert Pro EA – Professional News Trading Expert This expert advisor is specifically designed to maximize market opportunities during high-impact news events. It comes packed with professional features that make trading smarter and more efficient: Professional Reverse Trades: News Expert Pro EA detects market movements during major news events and opens precise reverse trades to increase profit potential while minimizing risk. Continuous Operation or News Schedule: You can enable continuous

Aquí tienes la traducción al español, manteniendo el formato exacto y los términos en inglés entre paréntesis, según lo solicitado: EA de Precios Promedio de Entrada con Cierre de Órdenes (Entry Price Averages EA with Close Orders) Nota para los usuarios - Elija la herramienta adecuada para usted: * Si solo necesita una visualización visual del precio promedio (visual average price display), utilice nuestro Precios Promedio de Entrada MT5 (Entry Price Averages MT5) (si ya tiene un experto (e

️ Ichimoku Kinko Hyo System Una herramienta inteligente para un análisis de mercado preciso y eficaz Este indicador se basa en el reconocido sistema Ichimoku Kinko Hyo , que ofrece una visión completa de la estructura del mercado, su dinámica y los posibles movimientos del precio. Está diseñado para ayudar a los traders a tomar decisiones rápidas mediante señales visuales claras. Características principales: Alta precisión gracias al análisis avanzado del mercado en múltiples tempora

Concepto y Propósito El Price Compass es una poderosa herramienta de análisis técnico diseñada para funcionar como una brújula de tendencia en los mercados financieros. Evalúa la presión direccional promedio del mercado, filtrando eficazmente el ruido a corto plazo para identificar el movimiento dominante con claridad. El indicador cuantifica qué tan alejado está el precio actual de su "promedio central", proporcionando una señal precisa de orientación del mercado (Alcista, Bajista o Neutral). I

THV Keyboard Commander MT5: Rápido, preciso y totalmente controlado por teclado. Construido con una mentalidad de simplicidad y velocidad - su asistente de trading definitivo. THV Keyboard Commander MT5 es un asistente de trading potente e intuitivo que le permite abrir, cerrar o eliminar órdenes instantáneamente utilizando atajos de teclado - no más pérdidas de tiempo con clics manuales.
Puede colocar órdenes Buy/Sell Limit y Stop con sólo pulsar una tecla, y el EA calcula automáticamente los

Killzone Liquidity Sweep EA Pro
por EV Trading Labs
Este Asesor Experto se basa en conceptos institucionales (metodología Smart Money / ICT) y se centra en la identificación y ejecución de configuraciones de alta probabilidad durante las killzones de Londres y Nueva York. El sistema combina sesgo direccional, confirmación de barrido de liquidez y entradas de stop de precisión alineadas con la lógica de trading institucional. El algoritmo opera en el marco temporal M15 y sólo negocia cuando el

Configura TP y SL en Pips, Puntos o Dinero – Gestor totalmente automático de TP/SL para MT5 Este EA, simple pero potente, establece automáticamente los niveles de Take Profit y Stop Loss para tus operaciones abiertas, utilizando una de tres unidades a tu elección: Pips, Puntos o valor exacto en Dinero. ️ Características principales:
• Ajusta automáticamente TP y SL en cuanto se abren las operaciones
• Elige entre Pips, Puntos o Dinero para mayor flexibilidad
• Lógica inteligente:

TimeFrame_Matcher es un tipo de Temporizador Táctico. Descripción (RU): Los picos bruscos de volatilidad y liquidez en el mercado suelen estar ligados a un momento concreto: el cierre de las velas más altas (xx:00, xx:30, H4, H1, etc.). En esos momentos, los operadores que trabajan en distintos plazos revisan simultáneamente sus posiciones.
Para un day trader, ser cogido desprevenido por un "cruce" de este tipo significa un riesgo incontrolable.
TimeFrame_Matcher es una herramienta profesiona

TÍTULO DEL PRODUCTO:
Detector Profesional de Pinbar EA | Detección en Tiempo Real Latencia Cero | M15 M30 H1 H4 | Escáner Multi-Símbolo | Filtros de Calidad Estrictos | MetaTrader 5
DESCRIPCIÓN CORTA:
Detector de pinbar profesional con CRITERIOS ESTRICTOS para pinbars PODEROSOS únicamente. Detección INMEDIATA al cierre de vela con latencia cero. Filtra señales débiles - detecta solo rechazos de alta calidad con ratio mecha/cuerpo 3x y dominancia mecha 60%. Monitoreo multi-símbolo M15/M30/H1/H4.
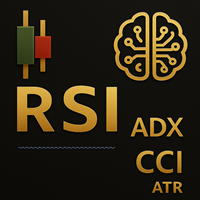
Este RSI, ADX, MA, ATR, CCI MTF Dashboard v1 - Consenso Profesional Multi-Timeframe ========================================================================
Cuadro de Múltiples Plazos (MTF) Profesional con Consenso Ponderado Inteligente Una herramienta visual potente, limpia y optimizada para CPU que combina RSI, ADX, EMA, ATR y CCI en hasta 6 marcos temporales (W1 a M5) con un motor de consenso dinámico.
Características principales: - Análisis MTF real utilizando iRSI, iADX, iMA, iATR, iCCI

Gestor de Salidas Inteligente PRO Versión Profesional - Operaciones en vivo ilimitadas en todos los pares y plazos. Pruebe la versión gratuita en cuentas demo antes de actualizar a PRO.
Visión general Smart Exit Manager PRO calcula automáticamente el nivel de precio exacto donde el cierre de todas sus posiciones logrará su objetivo de beneficio. La línea objetivo se actualiza en tiempo real a medida que abre o cierra operaciones, teniendo en cuenta las comisiones del broker y proporcionando
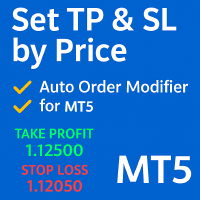
Establece TP y SL por Precio – Modificador automático de órdenes para MT5 Establece automáticamente niveles precisos de TP y SL en cualquier operación
️ Funciona con todos los pares y EAs, con filtro por símbolo o número mágico Este EA te permite definir y aplicar niveles exactos de Take Profit (TP) y Stop Loss (SL) mediante valores de precio directo (por ejemplo, 1.12345 en EURUSD). Sin puntos ni pips. Solo una gestión precisa y limpia de operaciones, en todas o filtradas por símbolo o Ma

Aquí tienes la traducción al español, manteniendo el formato y los términos ingleses entre paréntesis, según lo solicitado: El Indicador de Posiciones de Entrada Promedio (The Average Entry Positions Indicator) El Indicador de Posiciones de Entrada Promedio (The Average Entry Positions Indicator) proporciona a los traders una clara representación visual de sus precios promedio de entrada de compra y venta (average buy and sell entry prices) en el gráfico. Esta potente herramienta ahora calcula y

DESCRIPCIÓN COMPLETA DEL EXPERT ADVISOR - Eurusd Trend Pro Quantum
PROPÓSITO GENERAL EA profesional que combina estrategias de tendencia con momentum, gestionando riesgo de forma avanzada y protegiendo el capital mediante múltiples sistemas de seguridad. ESTRATEGIA DE TRADING PRINCIPAL Indicadores Utilizados: EMA Rápida (14) y EMA Lenta (28) - Para identificar tendencia Estocástico (8,3,6) - Para identificar momentum y niveles de sobrecompra/sobreventa Señales de Entrada: SEÑAL DE COM
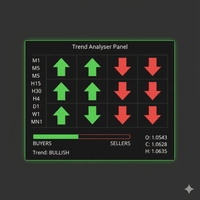
El panel de análisis de tendencias es una potente herramienta de análisis técnico todo en uno diseñada para operadores que necesitan una visión clara y consolidada del impulso del mercado en varios plazos. En lugar de saturar su gráfico con numerosos indicadores separados, esta herramienta agrega señales de cuatro osciladores clave (estocástico, RSI y CCI dual) en un panel único y fácil de leer. Calcula el sesgo direccional (Compra, Venta o Neutral) para cada marco temporal habilitado y proporci

BVCandleView es un nuevo indicador diseñado para dar a los operadores discrecionales una ventaja visual redondeando los datos de precios. Combínelo con un servicio gratuito de símbolos personalizados para mostrar gráficos de tick al estilo de Bob Volman en MetaTrader 5. Las velas redondeadas con colores dinámicos hacen que cada movimiento de tick sea instantáneamente legible. Manual rápido Instalación Coloque BVCandleView.mq5 en MQL5/Indicators . Reinicie MetaTrader 5 y adjunte el indicador a c

ChrisFX AUTOBOT - Control Semi-Automático Inteligente ChrisFX AUTO BOT es un Asesor Experto semiautomático diseñado para operadores activos que quieren mantener el control mientras se benefician de la gestión automatizada del riesgo.
Cuenta con un sistema automático de BreakEven y una gestión inteligente de cierres parciales , ofreciendo el equilibrio perfecto entre la decisión manual y la precisión algorítmica. Características principales Botones de COMPRA / VENTA directamente en el gráfico Bre

THV Smart Limit Manager MT5 - Controlador Inteligente de Órdenes Pendientes THV Smart Limit Manager MT5 es un Asesor Experto avanzado diseñado para gestionar de forma inteligente las órdenes Pendientes de Compra/Venta utilizando líneas horizontales manuales o lógica automática .
Proporciona un control total sobre la colocación de órdenes pendientes, el espaciado, el escalado de lotes, la recuperación y la gestión de riesgos, todo ello de forma sencilla y visual. Enlace para descargar la versión

ASM Scalper es un combo de tres Asesores Expertos totalmente automatizados que funciona en XAUUSD y BTCUSD. Los que trabajan juntos en tiempo real para hacer, evaluar, y optimizar continuamente las decisiones comerciales.
EA 1. Realiza dos operaciones al día, una de compra y otra de venta en XAUUSD. Podemos mantener un 3-6% de riesgo por operación, ya que tiene un buen registro de precisión y trailing rápido. Tiene muy buena racha ganadora continua y menos rachas perdedoras. EA 2. Este EA toma

" Stern " es un bot de Forex de última generación diseñado para operadores avanzados. Esta herramienta de alta tecnología es un asistente indispensable para cualquiera que desee automatizar al máximo sus procesos de negociación. El algoritmo del bot se basa en órdenes pendientes, que se colocan a una cierta distancia del precio actual y se activan sólo cuando el precio alcanza un nivel especificado. El bot también utiliza órdenes pendientes (trailing pending orders), que se activan cuando el pr

" Nibelung " es un avanzado robot de trading creado para los operadores de Forex modernos. Esta innovadora herramienta es un asistente fiable para cualquiera que busque un trading eficiente y automatizado.
El bot utiliza órdenes pendientes como uno de los elementos principales de su algoritmo. Las órdenes pendientes se colocan a una cierta distancia del precio actual y se activan sólo cuando el precio alcanza un nivel especificado. Además, cuando el precio se mueve, se activan las órdenes pend

Análisis Experto del Mercado Forex Utilizando la Teoría de las Ondas de Elliott Introducción El análisis del mercado de divisas utilizando la Teoría de las Ondas de Elliott ofrece nuevas oportunidades para predecir con precisión los movimientos de los pares de divisas. Herodoto, experto en análisis técnico, aplica este método para estudiar la dinámica de los principales pares de divisas: EUR/USD GBP/USD USD/JPY AUD/USD USD/CHF EUR/GBP EUR/JPY NZD/USD USD/CAD EUR/CHF AUD/JPY CAD/JPY Teoría de las

Sliding Block - Asesor Experto Inteligente para Forex Sliding Block es un bot de trading potente y fiable desarrollado para los traders que buscan un trading estable y totalmente automatizado. Este Asesor Experto (EA) se basa en el análisis inteligente del mercado y opera utilizando órdenes pendientes con gestión avanzada de posiciones y mecanismos de protección de múltiples capas. Gracias a su configuración flexible y arquitectura robusta, Sliding Block se adapta a diversas condiciones de merca

Indicador Dinámico del Valor del Dólar - ¡Conoce tu riesgo antes de operar! ¡Deje de adivinar y empiece a saber exactamente lo que significa cada movimiento del precio en términos reales de dólares! El Indicador Dinámico del Valor del Dólar es una herramienta esencial para los operadores profesionales que quieren visibilidad instantánea del valor monetario de los movimientos de precios para cualquier instrumento de negociación. CARACTERÍSTICAS CLAVE: CÁLCULOS DEL DÓLAR EN TIEMPO REAL: M

PRECIO DE LANZAMIENTO POR TIEMPO LIMITADO: ¡El precio actual 800 está descontado! El precio final aumentará hasta 1225 . EA Avanzado Controlado por Riesgo
Nova Stem es un Asesor Experto robusto diseñado para gestores de riesgo inteligentes y traders de firmas de propiedad. Funciona completamente automatizado en GBPJPY y utiliza M15 como gráfico base. Simplemente carga el EA en un solo gráfico y deja que la lógica de precisión maneje todo.
Bonus incluido: mándame un mensaje después de la comp
SISTEMA DE ANÁLISIS DE DOBLE MOTOR: Indicador del tamaño medio de los ticks : Mide la fuerza del movimiento de la oferta a lo largo de 6 periodos de retrospectiva personalizables (36, 96, 369, 500, 1000, 2000 ticks) Analizador de Tick Multi Timeframe : Calcula los porcentajes de presión de compra/venta a través de 6 marcos temporales diferentes (100,200,300,400,500,600 ticks) GENERACIÓN DE SEÑALES EN TIEMPO REAL: Alertas combinadas de compra/venta : Sólo se activa cuando AMBOS motores analíti

Tu compañero definitivo en el mercado de Forex. Enfocado exclusivamente en el par de trading EURCAD , Chase the Ember aprovecha el poder de M30 , el marco temporal óptimo, para navegar por las complejidades del mercado. Está meticulosamente diseñado para embarcarse en el trading de rango, profundizando en las complejidades de los movimientos y patrones del mercado. Estrategia de Chase the Ember: aunque no podemos compartir detalles exactos, aquí están los conceptos básicos: Chase the Ember utili

Forex EA Manager - Herramienta profesional de gestión de posiciones Visión general Forex EA Manager es un sofisticado Asesor Experto de MetaTrader 5 diseñado para proporcionar capacidades profesionales de gestión de posiciones para los operadores de Forex. Este EA se centra en la gestión del riesgo y la optimización del comercio a través de funciones avanzadas de gestión de órdenes. Características principales ️ Gestión de Riesgos Stop Loss y Take Profit automatizados : Niveles SL/TP config

Este EA se utiliza principalmente para el scalping de XAUUSD.
Propósito Elimina la emoción de la gestión del trading: protege automáticamente las posiciones y toma ganancias para que no tengas que tomar decisiones difíciles bajo presión.
Lo que hace ️ Stop Loss automático Establece SL basándose en máximos/mínimos recientes + margen adicional Ya no más estrés por colocación manual Beneficios parciales automáticos Dos modos: Movimiento fijo: Cierra el 50% tras un movimiento d
Swing Master Auto Pro - Detector Adaptativo de Swings Altos/Bajos ¡Convierta las oscilaciones del mercado en entradas inteligentes!
No más ajustes manuales - Swing Master Auto Pro ajusta automáticamente su sensibilidad en función de su marco de tiempo . Tanto si opera en M1 como en D1, este indicador se adapta de forma inteligente para ofrecer máximos y mínimos precisos , perfectamente equilibrados para cada gráfico. Características principales Optimización automática del marco temporal - ¡Olv

Este indicador se utiliza principalmente para hacer scalping en XAUUSD. Marca los precios de apertura, mínimo y máximo de: El día actual El día anterior La semana actual La semana anterior El mes actual El mes anterior Con base en estos niveles de precios, puedes identificar en qué niveles es probable que el precio reaccione. Si tienes alguna pregunta o solicitud, no dudes en contactarme por chat. ¡Gracias y que tengas un buen día!

️ Power Moving Average Signals Descripción general: Power Moving Average Signals es una estrategia de trading basada en la tendencia, que utiliza el cruce de dos medias móviles — una rápida y una lenta — para generar señales claras de compra y venta : Compra : cuando la media móvil rápida cruza por encima de la lenta Venta : cuando la media móvil rápida cruza por debajo de la lenta Optimizada para pares de divisas: Esta estrategia funciona especialmente bien en instrumentos del mercad

Completo indicador multitemporal de soportes y resistencias basado en el volumen Visión general VolumePoint Pro es una completa herramienta analítica creada en torno al concepto de Punto de Control (POC ), es decir, el nivel de precios en el que se produjo el mayor volumen negociado durante una sesión o un periodo concretos.
Mediante el seguimiento y la visualización de estos nodos de precios en múltiples marcos temporales, el indicador permite a los operadores identificar claramente las zonas d

BlockLongTimeFlexible - Visualizador de Bloques Temporales
Domina el Análisis Temporal del Mercado
BlockLongTimeFlexible es la herramienta definitiva para traders y analistas que necesitan visualizar y analizar períodos temporales de forma profesional e intuitiva. Crea rectángulos visuales personalizables que destacan ciclos, estacionalidades y patrones temporales directamente en tu gráfico. Manual Simple del Indicador BlockLongTimeFlexible
¿Qué Hace Este Indicador?
Crea rectángulos coloread
OptiBot Cierres Diarios MT5
Análisis Estadístico de los Cierres con Percentiles, ATR% y Gestión de Riesgos Análisis estadístico de los cierres diarios: distribución visual, percentiles de 5 niveles, ATR%, eficiencia del mercado. Interfaz profesional FR/EN. Desarrollado por OptiBot Trading, este indicador combina más de 10 métricas estadísticas basadas en los cierres diarios para ayudarte a tomar decisiones de trading objetivas y cuantitativas. ESTRATEGIAS POSIBLES CON ESTE INDICADOR OptiBot Cie

=== Atención ===== antes de empezar a usar este proyecto por favor mira el video.
este es el primer paso de todo-en-un proyecto que se actualizará día a día. Esta versión (1.01) será para el Comercio - Entrada. Usted puede tener el mercado y las órdenes pendientes - tamaño del lote - tomar ganancias y stop loss. Take profit y stop loss tienen 4 tipos diferentes que son punto - dinero - porcentaje - precio y tenemos RR para take profit. Usted puede calcular el tamaño del lote basado en puntos y

Robot ExtaGold: Un algoritmo de negociación basado en reglas
Descripción: El Robot ExtaGold es un sistema de trading automatizado que ejecuta operaciones basadas en un conjunto predefinido de reglas de análisis técnico. La estrategia prioriza la transparencia en su lógica sobre el uso de inteligencia artificial o aprendizaje automático.
Características principales:
Metodología: Las decisiones del algoritmo se basan en conceptos de análisis técnico, incluyendo el análisis de la acción del pre

Visión general Si usted opera utilizando Conceptos de Dinero Inteligente o estrategias de estructura de mercado, esta herramienta hace instantáneamente sus gráficos más limpios y su lectura de estructura mucho más fácil. Smart Leg Structure PRO identifica automáticamente el tramo de mercado más reciente, marca el máximo, el mínimo y el equilibrio, y muestra cada Fair Value Gap (FVG) y punto de oscilación en segundos. Se acabaron las suposiciones y el redibujado manual de líneas: este indicador l

GoldenPulse PRO - High Winrate es un Asesor Experto totalmente automatizado diseñado para operar con Oro (XAUUSD) con precisión y consistencia. Utiliza un marco de impulso/volatilidad patentado que se adapta a las condiciones cambiantes, centrándose en una alta tasa de ganancias y una reducción controlada, sin rejilla, martingala ni promedios arriesgados. Características principales 100% automatizado - plug & play Optimizado para XAUUSD , compatible con otros símbolos Lógica inteligente - sin m
# Lean ORB Pro V1 "The Phoenix" - Descripción del producto (Español)
** Nombre del producto:** Lean ORB Pro V1
** Descripción Breve:** Asesor Experto para MetaTrader 5 que combina la ruptura del rango de apertura con la detección de la brecha del valor justo. Diseñado para los índices de EE.UU., trabaja con varios instrumentos de negociación.
---
## Descripción completa del producto
### Descripción
Lean ORB Pro V1 es un Asesor Experto para MetaTrader 5 que combina estrategias de Apertura

Smaf (AF Suave) Siga la tendencia del mercado sin la molestia de analizar el gráfico. Simplemente conecte Smaf en el símbolo que desea operar y deje que haga lo suyo.
Funciona bien en mercados volátiles y con tendencia.
Calcula automáticamente el tamaño de los lotes en función del porcentaje de riesgo y la distancia de riesgo. Trailing stops implementados en base a la volatilidad actual Cierre automático de posiciones en caso de riesgo (compra y venta gestionada) Relación Riesgo:Recompensa 1:3

resultado en vivo:
OFERTA POR TIEMPO LIMITADO: ¡Obtén la mejor oferta antes de que suba el precio! Precio final: 990$ Conoce al Cambio de Juego: Dream Reactor Imagina un EA que hace más que solo colocar operaciones: gestiona estratégicamente cada orden para un mejor control de riesgos. Dream Reactor está diseñado para destacar en mercados volátiles, adaptándose rápidamente a los movimientos de precios. Presenta un enfoque único donde divide cada posición en múltiples órdenes más pequeñas, cada

Haven Breakout Channels - Su clave para el trading de rupturas Presentamos Haven Breakout Channels – un indicador inteligente diseñado para detectar automáticamente zonas de consolidación (canales de precios) y determinar con precisión los momentos de su ruptura. Basado en el análisis de la volatilidad, le libera de la necesidad de buscar manualmente áreas planas, permitiéndole centrarse en lo más importante: entrar en una operación al comienzo de un nuevo movimiento. Mis otros productos -> AQ

Friendly Bot es un asesor multidivisa y multifuncional que funciona en cualquier marco temporal y en cualquier condición de mercado. - El funcionamiento del robot se basa en un sistema de promediación con una progresión no geométrica de construcción de una parrilla de negociación. - Sistemas de protección incorporados: filtros especiales, control de spreads, limitación interna del tiempo de negociación. - Construcción de una red de trading teniendo en cuenta importantes niveles internos. - Posi

Exotic Bot es un asesor multifuncional que trabaja en cualquier marco temporal y en cualquier condición de mercado. El trabajo del robot se toma como un sistema de promedio con la progresión no -geométrica de la construcción de una rejilla de comercio. Sistemas de protección incorporados: filtros especiales, spreading, restricción interna del tiempo de negociación. Construcción de una parrilla de negociación, teniendo en cuenta importantes niveles internos. Posibilidad de configurar la agresivi

Trinitron Bot : Un Asesor de Operaciones Multifuncional y Multidivisa
Trinitron Bot es un sofisticado y versátil asesor de operaciones diseñado para operar sin problemas en varios plazos y condiciones de mercado.
Características principales : Sistema de Promedio con Progresión No Geométrica: Trinitron Bot utiliza un avanzado sistema de promediación que construye una parrilla de negociación basada en la progresión no geométrica, mejorando su adaptabilidad y eficiencia. Sistemas de protección i

Exorcist Bot es un asesor multidivisa y multifuncional que funciona en cualquier marco temporal y en cualquier condición de mercado. - El funcionamiento del robot se basa en un sistema de promediación con una progresión no geométrica de construcción de una parrilla de negociación. - Sistemas de protección incorporados: filtros especiales, control de spreads, limitación interna del tiempo de negociación. - Construcción de una red de trading teniendo en cuenta importantes niveles internos. - Posi

Ultima Trader es un asesor multidivisa que puede operar eficazmente en distintos marcos temporales y en una gran variedad de escenarios de mercado gracias a su avanzado sistema de promediación de progresión no geométrica. Esta característica le permite construir parrillas de negociación y determinar los momentos de entrada en el mercado con gran precisión.
Principales características de Ultima Trader : Sistemas de seguridad: El asesor está equipado con filtros especiales, control de spreads y

RiskShield Dragon - Asesor Multimoneda Automatizado
Combinando algoritmos inteligentes, robustos mecanismos de protección y una configuración flexible, **RiskShield Dragon** proporciona beneficios constantes con un riesgo mínimo.
---
## Ventajas Clave
**Multidivisa y Multihilo**: Soporta más de 20 pares de divisas (EURUSD, GBPUSD, USDJPY, AUDUSD, NZDJPY, y más) simultáneamente en cualquier marco de tiempo. * **Depósito mínimo a partir de 10.000**: Optimizado para operar con un saldo inicial

Correct Approach es un Asesor Experto multidivisa y multifuncional que funciona en cualquier marco temporal y en cualquier condición de mercado. El robot se basa en un sistema de promediación con una progresión no geométrica de la construcción de una parrilla de negociación. Sistemas de protección incorporados: filtros especiales, control de spreads, límite interno de tiempo de negociación. Construcción de una parrilla de negociación teniendo en cuenta los niveles internos importantes. Posibili

GoldDigger AI - Asesor Experto para XAUUSD GoldDigger AI es un Asesor Experto automatizado diseñado para el instrumento XAUUSD. El EA evalúa las condiciones de ruptura y tendencia utilizando canales de precios adaptativos y filtros basados en la volatilidad, y gestiona las posiciones a través de su lógica interna de control de exposición. Visión general de la estrategia Los cálculos de los canales de precios se utilizan para definir rangos dinámicos superiores e inferiores basados en la volatili

El indicador Super Trend Entry Signal es una potente herramienta de negociación diseñada para identificar puntos de entrada precisos basados en la volatilidad del mercado. Utilizando el Average True Range (ATR) como su núcleo, este indicador se ajusta dinámicamente a las condiciones actuales del mercado - ayudando a los operadores a detectar posibles oportunidades de ruptura o inversión con confianza. Características principales: - Entradas basadas en la volatilidad: Calcula las zonas de entrad
Presentación de Dzidula : Su mejor compañero de trading Libere todo el potencial de su estrategia de trading con Dzidula, un robot de trading de última generación basado en algoritmos avanzados de Q-learning. Diseñado para adaptarse y prosperar en condiciones de mercado dinámicas, esta innovadora herramienta es su clave para un trading más inteligente y rentable. Características principales: Algoritmo avanzado Q-Learning : Aproveche el poder del aprendizaje automático para tomar decisiones de t

Indicador SMC para MT5 - Opere como las instituciones Desbloquea el poder del trading institucional con el indicador Smart Money Concepts (SMC) para MetaTrader 5 . Diseñado para traders que quieren ir más allá de las estrategias minoristas, esta herramienta avanzada le ayuda a identificar con precisión y claridad los cambios en la estructura del mercado, los bloqueos de órdenes, las zonas de liquidez y las brechas de valor razonable. Características principales: Detección automática de la
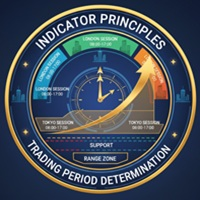
Indicador RangeZone Visión general: El comercio mundial de divisas de Este a Oeste Los mercados financieros mundiales funcionan según el principio de sesiones de negociación continuas, en las que la actividad se desplaza con el sol de un centro financiero a otro. Comprender esta dinámica es clave para operar con éxito. Cómo se mueve el trading en el mundo: Sesión asiática ( Sydney, Tokio): Abre primero y marca la pauta de la volatilidad diaria Yen japonés, dólar australiano, índices asiáticos

NextStep EA : Trading Algorítmico Avanzado para Índices Step Derivados & Más. NextStep EA es un Asesor Experto MT5 premium, optimizado de forma única para Step Index. Combina estrategias duales, análisis multi-marco de tiempo y gestión avanzada de riesgos para la negociación automatizada de índices sintéticos. Este EA funciona con cualquier broker y opera con cualquier par, incluido el ORO (XAUUSD). Póngase en contacto conmigo para las configuraciones recomendadas y las mejores configuraciones.
El indicador Trend Force es una herramienta analítica profesional diseñada para medir con precisión la fuerza de la tendencia general del mercado . Funciona en todos los pares de divisas y plazos , y es especialmente eficaz para destacar tendencias fuertes y estables sobre las que los operadores pueden actuar con confianza. Trend Force utiliza un algoritmo avanzado para medir el impulso del mercado, indicando claramente la fuerza de las tendencias alcistas o bajistas. Esto facilita la toma de de

Descripción de M-Sync EA Deje de adivinar en los días de noticias. M-Sync News Trader es una herramienta semiautomatizada creada para operadores que desean control y claridad durante eventos de gran impacto como las NFP, el IPC y las decisiones sobre tipos de interés. Le ayuda a planificar, ejecutar y gestionar un straddle de noticias profesional, colocando automáticamente órdenes Stop de compra/venta antes del evento, activando una cuando se produce la noticia y cancelando instantáneamente la o
Super Entry Signals MT5 - Entradas de tendencia que tienen sentido
Opere con estructura, no con suposiciones. Super Entry Signals MT5 encuentra oportunidades de ruptura claras y basadas en reglas en la dirección del movimiento predominante y las presenta con flechas limpias y una directriz horizontal opcional desde la vela de señal. Está diseñado para la ejecución práctica, basada en la tendencia: detectar el retroceso, confirmar la fuerza, y entrar en una ruptura decisiva - con alertas listas

HedgeGold v3.8 - Estrategia Inteligente de Cadena de Cobertura por eilyaz zenza HedgeGold es un Asesor Experto robusto, que sigue la tendencia y emplea un mecanismo dinámico de cadena de cobertura para gestionar el riesgo y capturar los movimientos del mercado a través de los principales pares de divisas y oro (XAUUSD). Utilizando un filtro EMA50, el EA sólo abre operaciones en la dirección de la tendencia. Cuando se abre una posición, coloca automáticamente órdenes de cobertura contra-direccio

Turbo Next es un robot de negociación de alto rendimiento para el mercado Forex, diseñado para automatizar las estrategias de negociación y adaptarse a las condiciones siempre cambiantes del mercado. Esta herramienta utiliza algoritmos avanzados para procesar los datos del mercado, lo que le permite identificar automáticamente los puntos óptimos de entrada y salida, minimizando los errores humanos y mejorando los resultados de las operaciones. Características principales de Turbo Next : Soporte

Si usted está cansado de tratar de mantenerse al día con el mercado impredecible, entonces es el momento de dejar que el bot Gipo Trex trabajar su magia. Este bot está diseñado para atrapar grandes oscilaciones de precios hacia arriba o hacia abajo, lo que le permite realizar en su mejor momento cuando el mercado se mueve a su favor.
Gipo Trex es una herramienta única que ayuda a los operadores a sacar el máximo partido de un mercado volátil. Con dos modos de bot diferentes, puedes encontrar l

Robot profesional Star Boticum, que implementa una estrategia de trading con diferentes indicadores y en diferentes intervalos de tiempo. Recorre todo el historial y muchos pares de divisas con una sola configuración. ¡Sistema de trading único! Puede trabajar en cualquier periodo horario, cualquier par de divisas y en el servidor de cualquier broker. Se recomienda trabajar en pares de divisas líquidos, con un spread bajo. Cuanto menor sea la comisión y el spread, mayor será el beneficio. Puede

Forex Workstation es un potente y eficaz bot de negociación de divisas diseñado para utilizar patrones, niveles de retención de precios, análisis de volatilidad y escalado del mercado. Este bot ofrece capacidades únicas para el trading automatizado y la optimización de estrategias en varios pares de divisas. Veamos las principales funciones y configuraciones de Forex Workstation: Funciones principales: - Multidivisa: Forex Workstation admite una amplia gama de pares de divisas, lo que le permite

El bot Cyberosaurus es un innovador bot de nueva generación que sirve como potente herramienta para operar en el mercado Forex clásico y con criptodivisas (para los brokers correspondientes). Opera con la mayoría de pares, por lo que es recomendable probarlo antes de utilizarlo en un par específico. Está diseñado específicamente para trabajar con estos mercados, sin posibilidad de operar con otros activos como acciones o índices.
Los principales parámetros de control del bot se presentan en un
MetaTrader Market - robots comerciales e indicadores técnicos para los trádres, disponibles directamente en el terminal.
El sistema de pago MQL5.community ha sido desarrollado para los Servicios de la plataforma MetaTrader y está disponible automáticamente para todos los usuarios registrados en el sitio web MQL5.com. Puede depositar y retirar el dinero a través de WebMoney, PayPal y tarjetas bancarias.
Está perdiendo oportunidades comerciales:
- Aplicaciones de trading gratuitas
- 8 000+ señales para copiar
- Noticias económicas para analizar los mercados financieros
Registro
Entrada
Si no tiene cuenta de usuario, regístrese
Para iniciar sesión y usar el sitio web MQL5.com es necesario permitir el uso de Сookies.
Por favor, active este ajuste en su navegador, de lo contrario, no podrá iniciar sesión.