MQL5入門(第17回):トレンド反転のためのエキスパートアドバイザーの構築

はじめに
連載「MQL5入門」の第17回へようこそ。今回は、これまでに取り上げた内容を基盤に、プロジェクトベースのアプローチを通じてMQL5スキルを実践的に磨いていきます。 第16回では三尊天井を対象に、検出から自動売買、さらにはチャート上での可視化までをおこなえるエキスパートアドバイザー(EA)を構築しました。MQL5でチャートパターンを扱う上で非常に有益な学習でした。
当初、本記事ではフラッグ、下降ウェッジや上昇ウェッジといった単一の継続または反転パターンを扱う予定でした。しかし掘り下げて調べると、これら多くのパターンには共通の構造があり、トレンドラインのブレイクまたは反転に依存していることが分かりました。したがって、特定のパターンに限定するのではなく、トレンドラインのブレイクアウトや反転を検出・取引できるEAの開発に焦点を当てます。一度これらの基本的な概念を習得すれば、少しの調整でさまざまなチャートパターンに応用可能です。
本記事では、以下の内容について解説します。
- ObjectGetValueByTime()を使用して、任意のローソク足の時刻でのトレンドラインの価格を取得する方法
- トレンドライン周辺のローソク足の構造を基に、ブレイクアウトや反転のシグナルを特定する方法
- 上昇トレンドラインと下降トレンドラインの違い、そしてそれらとプライスアクションとの関係の解釈方法
- 価格の反発やブレイクアウトを確認するために、直近ローソク足の動き(ヒゲや終値)を確認する重要性
- 古いまたは無関係なシグナルで取引を実行しないための、時間ベースの比較の実践的な利用方法
- トレンドラインとの相互作用に基づいて自動取引をおこなう、基本的かつ柔軟なEAの構築方法
1. トレンドラインの理解
チャート上の2点以上の価格を結ぶ直線をトレンドラインと呼びます。適切に配置されれば、トレンドラインは現在のトレンドや潜在的な取引機会を認識する助けになります。水平なサポート・レジスタンスとは異なり、トレンドラインは傾斜しており、市場の自然な方向性(横ばい、上昇、下降)に従います。
多くのチャートパターンは、トレンドラインによって形成されたり、トレンドラインの周囲で構築されます。そのためトレンドラインは特定のパターンを識別する上で特に重要です。たとえば、下降ウェッジや上昇ウェッジでは、価格が2本の収束するトレンドラインに挟まれ、やがてブレイクアウトが発生します。フラッグやペナントパターンにおいては、継続の動きに先立つ保ち合いゾーンをトレンドラインが定義します。
1.1. トレンドラインの種類
1.1.1.上昇トレンドライン
上昇トレンドでは、安値切り上げを結んだラインが上昇トレンドラインとして機能し、サポートレベルとなります。価格がトレンドラインを下抜けると、上昇トレンドの反転または下降の継続を示唆し、売りの機会を特定する助けとなります。また、上昇トレンドにおける押し目では、買いの機会を見つける手助けにもなります。

1.1.2. 下降トレンドライン
上昇トレンドラインは上向きに傾斜する一方、下降トレンドラインは弱気のモメンタムを示します。下降トレンドでは、2つ以上の高値切り下げを結ぶことで下降トレンドラインが形成されます。この下向きに傾いたラインはレジスタンスレベルとして機能し、市場が全体的に弱気の方向へ動いていることを示します。
短期的な価格上昇の局面では、下降トレンドラインは売りの機会を提供します。なぜなら、価格がラインに到達すると下方への反転が予測されるためです。しかし、上昇トレンドラインの場合と同様に、ブレイクアウトは重要です。価格が下降トレンドラインを上抜けした場合、下降から上昇への転換を示す可能性があり、買いの機会となることがあります。

上昇トレンドラインは上向きに傾斜する一方、下降トレンドラインは弱気のモメンタムを示します。下降トレンドでは、2つ以上の高値切り下げを結ぶことで下降トレンドラインが形成されます。この下向きに傾いたラインはレジスタンスレベルとして機能し、市場が全体的に弱気の方向へ動いていることを示します。
トレンドラインは、重要なブレイクアウトを強調することで、市場モメンタムの変化を視覚的に示し、戦略的な取引エントリーをサポートします。特定のパターンを暗記するのではなく、トレンドラインの挙動を理解することは、パターン認識の柔軟な基盤となり、特にMQL5でのEA開発など、自動化手法の構築に役立ちます。
2. プロジェクトの設定
2.1. EAの仕組み
このプロジェクトでは、チャート上のトレンドラインを利用して自動的に取引をおこなうEAを作成します。EAは市場の状態に応じて、直近のスイングハイとスイングローを分析し、正しい上昇または下降トレンドラインを生成します。
トレンドラインが確立されると、EAは価格がそのトレンドラインとどのように相互作用するかを追跡します。EAが取引をおこなうのは主に2つのシナリオです。1つ目は、価格がトレンドラインに到達して反転した場合で、EAはトレンドの方向に沿って反転を予測し取引をおこないます。2つ目は、価格がトレンドラインをブレイクし、その後反対側からリテストした場合で、EAはブレイク方向に取引をおこないます。このロジックにより、EAはウェッジ、フラッグ、トライアングル、チャネルなど、主にトレンドラインのダイナミクスに依存するさまざまなチャートパターンに対応することができます。
2.1.1. 上昇トレンドライン
2.1.1.1. 買いロジック
- EAは2つのスイングローを検出し、それらを結んで上昇トレンドラインを描画します。
- EAは価格がトレンドラインに戻って接触または接近するが、ブレイクしない動きを継続的に監視します。
- 価格がトレンドラインに接触し、直後に陽線を形成した場合、EAは反発が確認できたと判断します。
- 上昇トレンドラインからの強気反発が確認されると、EAは買い注文を出します。
- ユーザーはエントリー価格または反発したローソク足の安値からのポイント数を指定して、ストップロス(SL)を設定できます。
- ユーザーはエントリー価格からのポイント数を指定して、テイクプロフィット(TP)を設定できます。

2.1.1.2. 売りロジック
- EAは2つのスイングローを検出し、それらを結んで上昇トレンドラインを描画します。
- EAはこの上昇トレンドラインを下にブレイクする弱気の動きを継続的に監視します。
- 価格がトレンドラインを下抜けると、EAはリテストを待機します。つまり、価格が下からトレンドラインに戻って接触する動きを確認するということです。
- リテスト直後に弱気のローソク足が形成され、その安値がトレンドラインより下であれば、EAは有効なブレイクアウトと確認します。
- 弱気のリテストが確認されると、EAは売り注文を出します。
- ユーザーはエントリー価格またはリテストローソク足の高値からのポイント数を指定してSLを設定できます。
- ユーザーはエントリー価格からのポイント数を指定してTPを設定できます。

2.1.2. 下降トレンドライン
2.1.2.1. 買いロジック
- EAは2つのスイングハイを検出し、それらを結んで下降トレンドラインを描画します。
- EAは下降トレンドラインを上にブレイクする強気の動きを継続的に監視します。
- 価格がトレンドラインを上抜けると、EAはリテストを待機します。つまり、価格が上からブレイク済みのトレンドラインに戻り、接触または接近する動きを確認するということです。
- リテスト直後に陽線が形成され、その高値がトレンドラインより上であれば、EAは有効なブレイクアウトと確認します。
- 強気のリテストが確認されると、EAは買い注文を出します。
- ユーザーはエントリー価格またはリテストローソク足の安値からのポイント数を指定してSLを設定できます。
- ユーザーはエントリー価格からのポイント数を指定してTPを設定できます。

2.1.2.2. 売りロジック
- EAは2つのスイングハイを検出し、それらを結んで下降トレンドラインを描画します。
- EAは価格が下降トレンドラインに接触する動きを継続的に監視します。
- 価格がトレンドラインに接触し、直後に弱気のローソク足を形成した場合、EAは有効な反転と判断します。
- 下降トレンドラインからの弱気反発が確認されると、EAは売り注文を出します。
- ユーザーはエントリー価格または反発したローソク足の高値からのポイント数を指定してSLを設定できます。
- ユーザーはエントリー価格からのポイント数を指定してTPを設定できます。

注記 このプロジェクトで取り上げる取引戦略の主な目的は、MQL5プログラミングの概念、特にチャートパターンを扱う方法や実用的なEAを作成する方法についての理解を深めることです。本戦略は実際の資金運用や実取引を目的としたものではありません。実際の市場で手法を実装する前には、必ず包括的なバックテストをおこない、金融の専門家に相談してください。
3. 上昇トレンドラインと下降トレンドラインの識別
EAの動作について十分に議論したので、ここからは実際にプログラムとして実装を始めることができます。EAにトレンドラインを自動的に認識して描画させることが最初のステップです。EAはまずチャート上で2つの主要なスイングポイントを見つけ、それらを結んでトレンドラインを描画します。上昇トレンドラインの場合、EAは直近の2つの安値切り上げ(スイングロー)を探し、それが上昇のモメンタムを示します。
下降トレンドラインの場合は、直近の2つの高値切り下げ(スイングハイ)を探し、それが下落圧力を示します。これらのスイング位置を特定した後、EAはそれらをトレンドラインで結びます。そしてこのラインが、ブレイクアウトや反転の可能性を識別するための基準として機能します。
3.1. ローソク足データの取得
チャートパターンを扱うあらゆるプロジェクトの重要な要素はローソク足データです。これがなければ、価格構造を評価したり、スイングハイやスイングローを識別したりすることは不可能です。そのため、EAを作成する際の最初のステップは、チャートから過去のローソク足データを抽出することです。このデータには各ローソク足の始値(Open)、高値(High)、安値(Low)、終値(Close)といった重要な価格情報が含まれています。このデータを用いることで、トレンドラインを認識し、市場構造を把握し、反転またはブレイクアウトシグナルを利用して取引エントリーの可能性を見つけることが可能になります。
例// Timeframe to use for retrieving candlestick data (default is the current chart timeframe) input ENUM_TIMEFRAMES time_frame = PERIOD_CURRENT; // Number of past bars (candlesticks) to check int bars_check = 500; // Arrays to store candlestick data double close_price[]; // Stores close prices double open_price[]; // Stores open prices double low_price[]; // Stores low prices double high_price[]; // Stores high prices datetime time_price[]; // Stores time data for each candle //+------------------------------------------------------------------+ //| Expert initialization function | //+------------------------------------------------------------------+ int OnInit() { // Set arrays as series so the newest bar is index 0 ( start from the latest bar) ArraySetAsSeries(close_price, true); ArraySetAsSeries(open_price, true); ArraySetAsSeries(low_price, true); ArraySetAsSeries(high_price, true); ArraySetAsSeries(time_price, true); return(INIT_SUCCEEDED); // Signal that the EA initialized successfully } //+------------------------------------------------------------------+ //| Expert deinitialization function | //+------------------------------------------------------------------+ void OnDeinit(const int reason) { } //+------------------------------------------------------------------+ //| Expert tick function | //+------------------------------------------------------------------+ void OnTick() { // Copy the latest candlestick data into the arrays CopyOpen(_Symbol, time_frame, 1, bars_check, open_price); // Open prices CopyClose(_Symbol, time_frame, 1, bars_check, close_price); // Close prices CopyLow(_Symbol, time_frame, 1, bars_check, low_price); // Low prices CopyHigh(_Symbol, time_frame, 1, bars_check, high_price); // High prices CopyTime(_Symbol, time_frame, 1, bars_check, time_price); // Candle times }
説明
チャートパターンに反応するEAを作成するためには、過去のローソク足データを収集する必要があります。コードはこの情報を5つの配列(open、close、high、low、time)に格納します。これらの配列は、トレンドラインの描画やスイングポイント検出の基盤となります。 PERIOD_CURRENTがデフォルトとして設定されており、EAは現在のチャートの時間足を使用します。ユーザーは入力変数time_frameを利用して、EAが動作すべき時間足(例:M1、H1、D1)を選択することができます。bars_check変数は、この例では500に設定されており、過去にさかのぼって何本のローソク足を調べるかを決定します。したがって、現在形成中のローソク足を無視して、EAは直近の500本の確定済みローソク足を取得し、検証します。
これらの配列はすべて、OnInit()関数内でArraySetAsSeries(..., true);を使って準備されます。この手順は配列の並びを逆にするため重要です。これにより、インデックス0が最新の確定ローソク足、インデックス1がその直前のローソク足、という形で対応します。このインデックス方式は、トレーダーがチャートを直感的に遡って確認する方法と一致しています。
大部分のデータ取得はOnTick()メソッドでおこなわれます。この関数は、ティックごと、すなわち市場価格が変動するたびに呼び出されます。その中でEAはCopyOpen、CopyClose、CopyHigh、CopyLow、CopyTimeを使用してローソク足データを対応する配列に取得します。第3引数に値「1」を渡すことで、EAが現在形成中のローソク足を操作から除外するようにします(このローソク足はすぐに変動し、パターン検出には信頼できないためです)。第2引数には選択された時間足が指定されます。取得される情報は、bars_checkで指定されたローソク足本数分さかのぼります。
3.2. 上昇トレンドラインの識別
ローソク足データを取得した後は、価格の動きの中からスイングポイントを見つける作業に移ります。最初の目標は上昇トレンドラインを見つけることです。これは通常、市場が安値切り上げを形成しているときに現れます。つまり、まず2つの適切なスイングローを特定する必要があります。これらのスイングローは、上昇トレンドラインを描く際の基準点として使用され、EAが反発やブレイクアウトといった強気のセットアップを特定するのに役立ちます。
例
// Timeframe to use for retrieving candlestick data (default is the current chart timeframe)
input ENUM_TIMEFRAMES time_frame = PERIOD_CURRENT;
// Input to enable or disable drawing of the ascending trend line (true = allow drawing)
input bool allow_uptrend = true;
// Number of candles to look back when identifying swing lows for drawing the trend line
input int LookbackBars = 5;

// Number of past bars (candlesticks) to check
int bars_check = 500;

// Arrays to store candlestick data
double close_price[];   // Stores close prices
double open_price[];    // Stores open prices
double low_price[];     // Stores low prices
double high_price[];    // Stores high prices
datetime time_price[];  // Stores time data for each candle

double first_low;           // Price value of the first identified swing low
datetime first_low_time;    // Time when the first swing low occurred

double second_low;          // Price value of the second identified swing low
datetime second_low_time;   // Time when the second swing low occurred

string up_trend = "Up Trend";  // Label used to name the ascending trend line object on the chart

long chart_id = ChartID();     // Stores the current chart ID for referencing during object creation or manipulation

//+------------------------------------------------------------------+
//| Expert initialization function                                   |
//+------------------------------------------------------------------+
int OnInit()
  {
// Set arrays as series so the newest bar is index 0 ( start from the latest bar)
   ArraySetAsSeries(close_price, true);
   ArraySetAsSeries(open_price, true);
   ArraySetAsSeries(low_price, true);
   ArraySetAsSeries(high_price, true);
   ArraySetAsSeries(time_price, true);

   return(INIT_SUCCEEDED);  // Signal that the EA initialized successfully
  }

//+------------------------------------------------------------------+
//| Expert deinitialization function                                 |
//+------------------------------------------------------------------+
void OnDeinit(const int reason)
  {

   ObjectsDeleteAll(chart_id);

  }

//+------------------------------------------------------------------+
//| Expert tick function                                             |
//+------------------------------------------------------------------+
void OnTick()
  {
// Copy the latest candlestick data into the arrays
   CopyOpen(_Symbol, time_frame, 1, bars_check, open_price);     // Open prices
   CopyClose(_Symbol, time_frame, 1, bars_check, close_price);   // Close prices
   CopyLow(_Symbol, time_frame, 1, bars_check, low_price);       // Low prices
   CopyHigh(_Symbol, time_frame, 1, bars_check, high_price);     // High prices
   CopyTime(_Symbol, time_frame, 1, bars_check, time_price);     // Candle times

// If the user allows drawing of ascending trend line
   if(allow_uptrend)
     {
      // First loop: Find the most recent swing low (first low)
      for(int i = LookbackBars; i < bars_check - LookbackBars; i++)
        {
         // Check if current point is a swing low
         if(IsSwingLow(low_price, i, LookbackBars))
           {
            // Store price and time of the first (latest) swing low
            first_low = low_price[i];
            first_low_time = time_price[i];
            break;  // Exit loop after finding the first swing low
           }
        }

      // Second loop: Find an earlier swing low that is lower than the first low
      for(int i = LookbackBars; i < bars_check - LookbackBars; i++)
        {
         // Check for earlier swing low that is lower and occurs before the first low
         if(IsSwingLow(low_price, i, LookbackBars) && low_price[i] < first_low && time_price[i] < first_low_time)
           {
            // Store price and time of the second (older) swing low
            second_low = low_price[i];
            second_low_time = time_price[i];
            break;  // Exit loop after finding the second swing low
           }
        }

      // Create an ascending trend line from the second low to the first low
      ObjectCreate(chart_id, up_trend, OBJ_TREND, 0, second_low_time, second_low, first_low_time, first_low);
      ObjectSetInteger(chart_id, up_trend, OBJPROP_TIMEFRAMES, OBJ_NO_PERIODS);  // Temporarily hide line on all timeframes

      // If the swing structure is valid (i.e., second low is lower than first)
      if(first_low > second_low && second_low > 0)
        {
         // Extend the trend line to the right
         ObjectSetInteger(chart_id, up_trend, OBJPROP_RAY_RIGHT, true);

         // Show the trend line on all timeframes
         ObjectSetInteger(chart_id, up_trend, OBJPROP_TIMEFRAMES, OBJ_ALL_PERIODS);

         // Set visual properties: color and thickness
         ObjectSetInteger(chart_id, up_trend, OBJPROP_COLOR, clrBlue);
         ObjectSetInteger(chart_id, up_trend, OBJPROP_WIDTH, 3);
        }
     }

  }

//+------------------------------------------------------------------+
//| FUNCTION FOR LOWS                                                |
//+------------------------------------------------------------------+
bool IsSwingLow(const double &low[], int index, int lookback)
  {

   for(int i = 1; i <= lookback; i++)
     {

      if(low[index] > low[index - i] || low[index] > low[index + i])
         return false;
     }
   return true;
  }
出力

説明
スイングローを価格系列の中から見つける目的で使用されるのがIsSwingLow関数です。この関数は3つの引数を取ります。ローソク足の安値の配列「low[]」、その配列内の特定のインデックス「index」、そして左右に何本のバーを確認するかを指定するルックバック期間「lookback」です。関数内部のforループは1からlookbackまで繰り返し、現在のインデックスにある安値を、右側の「index + i」と左側の「index - i」にある安値と比較します。
現在の安値が周囲のどれかの安値より大きい場合、そのポイントはスイングローではないため関数はfalseを返します。逆に、現在の安値がルックバック範囲内のすべての周囲の安値よりも小さい場合、そのポイントがスイングローであると認識し、関数はtrueを返します。要するに、この関数は指定インデックスの安値が局所的な最小値であることを保証します。つまり、その周囲の範囲で最も低い点ということです。
トレンドラインのロジックは2つの重要な入力によって制御されます。1つ目はallow_uptrendで、ユーザーが上昇方向のトレンドラインを描画するかどうかを選択できるブール値です。これがtrueに設定されている場合、コードは2つのスイングローを探し、それらを結んでトレンドラインを生成します。2つ目はLookbackBarsで、あるポイントがスイングローかどうかを判定するために、そのポイントの左右で何本のローソク足を調べるかを指定します。IsSwingLow関数もこのルックバック値を利用します。ルックバックの値が小さいほどスイングロー判定は敏感になり、大きいほど厳しくなります(より深い押しを要求します)。
ローソク足データの中で直近の2つのスイングローの価格値はfirst_lowとsecond_lowに格納されます。対応する発生時刻はfirst_low_timeとsecond_low_timeに保存されます。その後、これらの時刻と価格のペアを使って上昇トレンドラインが描画されます。現在のチャートのIDはchart_idに、トレンドラインオブジェクトの名前(単純に「Up Trend」というラベル)はup_trendに格納されます。トレンドラインのようなグラフィカルオブジェクトを生成や変更する際には、適切なチャートコンテキストを判断するためにチャートIDが必要です。
allow_uptrendがtrueの場合、EAはまず2つの適切なスイングローを探すことから始めます。配列の範囲外アクセスを防ぐために、最初のforループはLookbackBarsから「bars_check - LookbackBars」までの範囲で価格データを走査します。各ポイントがスイングローであるかどうかを確認するためにIsSwingLow関数を使用します。直近の適切なスイングローを特定したら、その価格と時刻をfirst_lowとfirst_low_timeに記録し、ループを終了します。
最初のスイングローを特定した後、2番目のforループでIsSwingLowを使って同じ方向に探索を続けますが、このとき2つの条件が追加されます。すなわち、2番目の安値は1番目よりも低くなければならず、また1番目の安値よりも過去に発生していなければなりません。このようなポイントを見つけたら、その価格と時刻をsecond_lowとsecond_low_timeに記録し、ループを終了します。上昇トレンドラインを作成するには、EAはまず過去のより低い安値を見つけ、その後に新しいより高い安値を見つける必要があり、この2段階の探索でそれが保証されます。
両方のスイングローを特定した後、コードはObjectCreateを使って上昇トレンドラインを作成します。この関数は、対応するタイムスタンプを使ってsecond_lowとfirst_lowを結びます。ラインを描画するのが早すぎないように、最初はOBJ_NO_PERIODSを使ってすべての時間足から非表示にします。構造が適切であること(first_low > second_lowかつsecond_low > 0)が確認されると、OBJPROP_RAY_RIGHTを使ってラインを右方向に延長し、将来に向かって伸ばします。また、OBJ_ALL_PERIODSを使ってすべての時間足で表示可能にします。
トレンドラインの色は青(clrBlue)に変更され、幅は3ピクセルに設定され、視認性が向上します。これらの調整によって、トレンドラインが他のチャート要素から際立ち、簡単に識別できるようになります。
3.3. 下降トレンドラインの識別
上昇トレンドラインをスイングローを使って作成する理論を適用したので、次のステップは下降トレンドラインを見つけて描画するために同様の手順を繰り返すことです。今回はスイングローではなく、スイングハイに注目します。スイングハイは局所的な高値で、ある価格ポイントが左右の一定数のバーよりも高いときに発生します。
上昇トレンドラインのときと同様に、スイングハイを識別する関数を開発し、過去のローソク足をループして2つの正しい高値を特定します(ここでは2番目の高値が1番目よりも低い必要があります)。その後、この2点を結んで下降トレンドラインを描画します。このラインは下向きの傾きを持ち、下降トレンドを示すとともに、トレーダーが売りを検討したり価格の反発を予測したりできる潜在的なレジスタンスレベルとして機能します。
例// Timeframe to use for retrieving candlestick data (default is the current chart timeframe) input ENUM_TIMEFRAMES time_frame = PERIOD_CURRENT; // Input to enable or disable drawing of the ascending trend line (true = allow drawing) input bool allow_uptrend = true; // Number of candles to look back when identifying swing lows for drawing the trend line input int LookbackBars = 5; // Input to enable or disable drawing of the descebding trend line (true = allow drawing) input bool allow_downtrend = true; // Number of past bars (candlesticks) to check int bars_check = 500; // Arrays to store candlestick data double close_price[]; // Stores close prices double open_price[]; // Stores open prices double low_price[]; // Stores low prices double high_price[]; // Stores high prices datetime time_price[]; // Stores time data for each candle double first_low; // Price value of the first identified swing low datetime first_low_time; // Time when the first swing low occurred double second_low; // Price value of the second identified swing low datetime second_low_time; // Time when the second swing low occurred string up_trend = "Up Trend"; // Label used to name the ascending trend line object on the chart long chart_id = ChartID(); // Stores the current chart ID for referencing during object creation or manipulation double first_high; // Price value of the first identified swing high (latest high) datetime first_high_time; // Time when the first swing high occurred double second_high; // Price value of the second identified swing high (older high) datetime second_high_time; // Time when the second swing high occurred string down_trend = "Down Trend"; // Label used to name the descending trend line object on the chart //+------------------------------------------------------------------+ //| Expert initialization function | //+------------------------------------------------------------------+ int OnInit() { // Set arrays as series so the newest bar is index 0 ( start from the latest bar) ArraySetAsSeries(close_price, true); ArraySetAsSeries(open_price, true); ArraySetAsSeries(low_price, true); ArraySetAsSeries(high_price, true); ArraySetAsSeries(time_price, true); return(INIT_SUCCEEDED); // Signal that the EA initialized successfully } //+------------------------------------------------------------------+ //| Expert deinitialization function | //+------------------------------------------------------------------+ void OnDeinit(const int reason) { ObjectsDeleteAll(chart_id); } //+------------------------------------------------------------------+ //| Expert tick function | //+------------------------------------------------------------------+ void OnTick() { // Copy the latest candlestick data into the arrays CopyOpen(_Symbol, time_frame, 1, bars_check, open_price); // Open prices CopyClose(_Symbol, time_frame, 1, bars_check, close_price); // Close prices CopyLow(_Symbol, time_frame, 1, bars_check, low_price); // Low prices CopyHigh(_Symbol, time_frame, 1, bars_check, high_price); // High prices CopyTime(_Symbol, time_frame, 1, bars_check, time_price); // Candle times // If the user allows drawing of ascending trend line if(allow_uptrend) { // First loop: Find the most recent swing low (first low) for(int i = LookbackBars; i < bars_check - LookbackBars; i++) { // Check if current point is a swing low if(IsSwingLow(low_price, i, LookbackBars)) { // Store price and time of the first (latest) swing low first_low = low_price[i]; first_low_time = time_price[i]; break; // Exit loop after finding the first swing low } } // Second loop: Find an earlier swing low that is lower than the first low for(int i = LookbackBars; i < bars_check - LookbackBars; i++) { // Check for earlier swing low that is lower and occurs before the first low if(IsSwingLow(low_price, i, LookbackBars) && low_price[i] < first_low && time_price[i] < first_low_time) { // Store price and time of the second (older) swing low second_low = low_price[i]; second_low_time = time_price[i]; break; // Exit loop after finding the second swing low } } // Create an ascending trend line from the second low to the first low ObjectCreate(chart_id, up_trend, OBJ_TREND, 0, second_low_time, second_low, first_low_time, first_low); ObjectSetInteger(chart_id, up_trend, OBJPROP_TIMEFRAMES, OBJ_NO_PERIODS); // Temporarily hide line on all timeframes // If the swing structure is valid (i.e., second low is lower than first) if(first_low > second_low && second_low > 0) { // Extend the trend line to the right ObjectSetInteger(chart_id, up_trend, OBJPROP_RAY_RIGHT, true); // Show the trend line on all timeframes ObjectSetInteger(chart_id, up_trend, OBJPROP_TIMEFRAMES, OBJ_ALL_PERIODS); // Set visual properties: color and thickness ObjectSetInteger(chart_id, up_trend, OBJPROP_COLOR, clrBlue); ObjectSetInteger(chart_id, up_trend, OBJPROP_WIDTH, 3); } } // // Only proceed if drawing descending trend lines is enabled if(allow_downtrend) { // First loop: Find the most recent swing high (first high) for(int i = LookbackBars; i < bars_check - LookbackBars; i++) { // Check if the current bar is a swing high if(IsSwingHigh(high_price, i, LookbackBars)) { // Store the price and time of this latest swing high first_high = high_price[i]; first_high_time = time_price[i]; break; // Exit loop once the first swing high is found } } // Second loop: Find an earlier swing high that is higher than the first high and occurred before it for(int i = LookbackBars; i < bars_check - LookbackBars; i++) { // Check for earlier swing high that is higher and happened before the first one if(IsSwingHigh(high_price, i, LookbackBars) && high_price[i] > first_high && time_price[i] < first_high_time) { // Store the price and time of this older swing high second_high = high_price[i]; second_high_time = time_price[i]; break; // Exit loop once the second swing high is found } } // Create a trend line object from the second swing high to the first swing high ObjectCreate(chart_id, down_trend, OBJ_TREND, 0, second_high_time, second_high, first_high_time, first_high); // Initially hide the trend line across all timeframes to avoid partial drawing ObjectSetInteger(chart_id, down_trend, OBJPROP_TIMEFRAMES, OBJ_NO_PERIODS); // Validate the swing structure: // The older swing high should be higher than the later swing high to confirm a descending trend line if(first_high < second_high && second_high > 0) { // Extend the trend line indefinitely to the right for better visual guidance ObjectSetInteger(chart_id, down_trend, OBJPROP_RAY_RIGHT, true); // Make the trend line visible on all chart timeframes ObjectSetInteger(chart_id, down_trend, OBJPROP_TIMEFRAMES, OBJ_ALL_PERIODS); // Set the trend line color to dark green for clear distinction ObjectSetInteger(chart_id, down_trend, OBJPROP_COLOR, clrDarkGreen); // Set the thickness of the trend line to 3 pixels for better visibility ObjectSetInteger(chart_id, down_trend, OBJPROP_WIDTH, 3); } } } //+------------------------------------------------------------------+ //| FUNCTION FOR LOWS | //+------------------------------------------------------------------+ bool IsSwingLow(const double &low[], int index, int lookback) { for(int i = 1; i <= lookback; i++) { if(low[index] > low[index - i] || low[index] > low[index + i]) return false; } return true; } //+------------------------------------------------------------------+ //| FUNCTION FOR HIGHS | //+------------------------------------------------------------------+ bool IsSwingHigh(const double &high[], int index, int lookback) { for(int i = 1; i <= lookback; i++) { if(high[index] < high[index - i] || high[index] < high[index + i]) return false; } return true; }
出力

説明
バーの高値を、あらかじめ設定されたルックバック期間内の周囲のバーの高値と比較することで、IsSwingHigh関数は指定されたバーがスイングハイであるかどうかを判断します。バーの高値が周囲のバーのいずれよりも高ければ、局所的なピークとしてtrueを返し、そうでなければfalseを返します。チャート上の下降トレンドラインは、入力変数allow_downtrendを使って描画するか、無効化することができます。
コードはまず直近のスイングハイ(first_high)を探し、その価格と時刻を記録して下降トレンドラインを決定します。その後、first_highよりも過去に発生し、かつ高値がより高いスイングハイ(second_high)を探します。これら2点を結んだトレンドラインは「Down Trend」(下降トレンド)と呼ばれます。 直近のスイングハイが過去の高値より低ければ、下降トレンドが確認されます。このラインは高値切り下げを結び、判別しやすいスタイルで描画され、チャート上で将来に向かって延長されます。このロジックは本質的に上昇トレンドラインの逆であり、上昇トレンドラインは安値切り上げを結んで上昇トレンドを示します。
4. トレンドラインのブレイクアウトおよび反転に基づく取引の実行
前の章では、価格チャート上の主要なスイングポイントを用いて、上昇および下降のトレンドラインをプログラムで構築する方法について説明しました。本章では、その基礎を踏まえ、トレンドラインのブレイクアウトや反転に基づいて取引を実行する方法について解説します。具体的には、価格が特定のトレンドラインを越えた場合や反転した場合を認識する方法、およびこれらの指標を効率的に取引のエントリーやエグジットに活用する方法に焦点を当てます。
4.1. 上昇トレンドライン
これまで、上昇トレンドラインを構築するために、最初と2番目のスイングローの識別に集中してきました。しかし、どのタイミングで市場がブレイクアウトし、トレンドラインをリテストする可能性があるのか、あるいはトレンドラインに接触して反転するのかは、どのように判断すればよいでしょうか。価格がトレンドラインとどのように相互作用するかに基づいて取引判断をおこなうため、この段階は不可欠です。MQL5には、任意の時点またはバーインデックスでのトレンドラインの価格レベルを取得できる組み込み関数があるため、このプロセスは比較的容易になっています。
このセクションでは、価格が上昇トレンドラインに接近または交差した場合を認識する方法を説明します。サポートでの反発を狙う場合や、ブレイクアウト&リテストでのエントリーを狙う場合のツールについて、MQL5が提供する機能を確認します。ブレイクアウトや反転は通常直近のローソク足で発生するため、チャート上の直近4本のバーを重点的に検証します。これらの直近バーには、トレンドラインが突破されたかされなかったかのサインが現れることが多いです。
したがって、チャート全体の履歴を確認するのではなく、直近の4本のバーがブレイクアウトまたは反転の条件を満たすかを慎重に検証します。この戦略により、新しい市場の動きに迅速に対応し、情報に基づいた取引判断を下すことが可能になります。以下では、この論理をMQL5でプログラム的に実装する方法を解説します。
例double t_line_value; // Ascending trend line price level at the time of the most recent bar (not the ticking bar) double t1_line_value; // Ascending trend line price level at the time of the second most recent bar double t2_line_value; // Ascending trend line price level at the time of the third most recent bar double t3_line_value; // Ascending trend line price level at the time of the fourth most recent bar
if(allow_uptrend)
  {
// First loop: Find the most recent swing low (first low)
   for(int i = LookbackBars; i < bars_check - LookbackBars; i++)
     {
      // Check if current point is a swing low
      if(IsSwingLow(low_price, i, LookbackBars))
        {
         // Store price and time of the first (latest) swing low
         first_low = low_price[i];
         first_low_time = time_price[i];
         break;  // Exit loop after finding the first swing low
        }
     }

// Second loop: Find an earlier swing low that is lower than the first low
   for(int i = LookbackBars; i < bars_check - LookbackBars; i++)
     {
      // Check for earlier swing low that is lower and occurs before the first low
      if(IsSwingLow(low_price, i, LookbackBars) && low_price[i] < first_low && time_price[i] < first_low_time)
        {
         // Store price and time of the second (older) swing low
         second_low = low_price[i];
         second_low_time = time_price[i];
         break;  // Exit loop after finding the second swing low
        }
     }

// Create an ascending trend line from the second low to the first low
   ObjectCreate(chart_id, up_trend, OBJ_TREND, 0, second_low_time, second_low, first_low_time, first_low);
   ObjectSetInteger(chart_id, up_trend, OBJPROP_TIMEFRAMES, OBJ_NO_PERIODS);  // Temporarily hide line on all timeframes

// If the swing structure is valid (i.e., second low is lower than first)
   if(first_low > second_low && second_low > 0)
     {
      // Extend the trend line to the right
      ObjectSetInteger(chart_id, up_trend, OBJPROP_RAY_RIGHT, true);

      // Show the trend line on all timeframes
      ObjectSetInteger(chart_id, up_trend, OBJPROP_TIMEFRAMES, OBJ_ALL_PERIODS);

      // Set visual properties: color and thickness
      ObjectSetInteger(chart_id, up_trend, OBJPROP_COLOR, clrBlue);
      ObjectSetInteger(chart_id, up_trend, OBJPROP_WIDTH, 3);


      // Get the price values of the trend line at the corresponding times of the four most recent bars
      t_line_value = ObjectGetValueByTime(chart_id, up_trend, time_price[0], 0);   // Current bar
      t1_line_value = ObjectGetValueByTime(chart_id, up_trend, time_price[1], 0);  // One bar ago
      t2_line_value = ObjectGetValueByTime(chart_id, up_trend, time_price[2], 0);  // Two bars ago
      t3_line_value = ObjectGetValueByTime(chart_id, up_trend, time_price[3], 0);  // Three bars ago

      Comment("Ascending trend tine value for the last 4 Bars",
              "\nBar 0: ",  DoubleToString(t_line_value, _Digits),
              "\nBar 1: ", DoubleToString(t1_line_value, _Digits),
              "\nBar 2: ",  DoubleToString(t2_line_value, _Digits),
              "\nBar 3: ",  DoubleToString(t3_line_value, _Digits));

     }
  }
出力

説明
トレンドラインの値を取得するには、ObjectGetValueByTime()関数を使用します。この関数は指定したチャートオブジェクト(この場合はトレンドライン)の特定の時刻での価格レベルを返します。これにより、直近の各バーの終値時点でトレンドラインがどこにあるかを判定できます。
この目的のために、4つの異なる変数を使用します。最新の確定済みバー(バー0、現在形成中のバーではない)におけるトレンドライン値はt_line_valueに格納されます。直近の1本前のバー(バー1)での値はt1_line_valueに格納されます。さらに、2本前と3本前のバーのトレンドライン値は、それぞれt2_line_valueとt3_line_valueに格納されます。
なお、time_price[0]を「バー0」と呼んでいますが、実際にはチャート上では右から2番目のバーとして表示されます。これは、右端の最終バー(未確定バー)はまだ形成中で閉じていないため、分析には使用しないからです。先ほどコード内で使用したCopyTime()関数でも同様に、インデックス1からコピーを開始し、未確定バーを避けて信頼性の高いデータを取得していました。 レビューやデバッグのため、コードはこれらのトレンドライン値をComment()関数でチャート上に直接表示します。これにより、直近バーに対するトレンドラインの動きを確認できます。この出力はチャートウィンドウの左上に表示されます。特に、トレンドラインがブレイクアウトや反転の場所になっているかどうかを判断するのに役立ちます。
4.1.1. 上昇トレンドライン取引実行
直近のバーのトレンドライン値を正確に取得できるようになったので、次のステップとして、ブレイクアウトまたは反転のタイミングで取引を実行するロジックを定義します。直近のバーのトレンドライン値と実際の価格動き(ローソク足の終値や高値・安値など)を比較することで、トレンドライン上で何が起きているかを判定できます。
4.1.1.1. 反転
直近のバーのトレンドライン値を取得できるため、反転シグナルに基づく取引を実行するロジックを作成します。市場がトレンドラインで反転しているかどうかを判断するため、現在のバーの価格を対応するトレンドライン値と比較します。 トレンドラインでの反発は一見簡単に思えますが、正確に実装するのはやや難しいです。反転は多くの構造を持ち、微妙な場合もあります。ローソク足全体がトレンドライン上にある場合もあれば、ヒゲだけがラインに触れて上方に確定する場合もあります。また、価格が一時的にラインを下回り、急激に反転することもあります。これはフェイクブレイクアウトと呼ばれます。
こうしたバリエーションにより、真の反転を正確に識別するためのパラメータは複雑になります。現在のローソク足の位置に加えて、複数のローソク足がトレンドラインとどのように相互作用しているかも考慮する必要があります。これには、陽線パターンなどの補助的な指標で確認したり、トレンドラインを大きく下回る終値がないことを確認したり、直近のローソク足の安値がラインに触れて反発しているかを確認したりする作業が含まれます。こうした条件を重ねてプログラムすることで、誤シグナルを最小限に抑え、トレンドラインでの反転検出を正確におこなうことができます。
以下に有効な反転条件をいくつか示します。
上昇トレンドラインでのヒゲの反発と陽線による強気反転 
ご覧の通り、ローソク足は、ヒゲが上昇トレンドラインに触れただけで瞬時に上方向に反転しました。これは、価格がトレンドラインをサポートとして試した際に、迅速に反発(拒絶)されたことを示しています。反転はさらに、同じローソク足が後に陽線として確定した事実によって裏付けられます。重要なサポートレベルで買い手の強い反応が見られることから、ヒゲがトレンドラインに触れつつ、実体が逆方向に大きく確定するこのような価格動きは、買い取引をおこなうための正当な条件といえます。
陰線のヒゲがトレンドラインに触れた後の陽線による確認

上図では、陰線のヒゲが上昇トレンドラインに触れ、そのローソク足はトレンドラインより上で確定しています。しかし、この陰線だけでは反転エントリーの条件は満たされません。直後に形成された陽線が反転の確認となります。この陽線は、トレンドライン接触後に買い手が介入したことを示しており、買い取引をおこなう正当な条件といえます。反転を検証するためには、必ず陽線の存在が必要です。
複数の陰線確定後における陽線による反転確認

ヒゲが上昇トレンドラインに触れた陰線が、トレンドラインを上回って確定しました。次のローソク足も陰線でしたが、ラインを上回って確定しました。反転エントリーの条件を満たす陽線が形成されたのは、3本目のローソク足でした。このセットアップが示すように、市場はトレンドラインに従いましたが、強気が主導権を握るまでには数本のローソク足を要しました。最後の陽線によって、買い取引の可能性が確認されます。
フェイクブレイクアウトからの即時陽線による反転 
最初に上昇トレンドラインに触れたローソク足がラインを下回って確定した場合、ブレイクの可能性が示唆されます。しかし、直後に出現したローソク足は大陽線で、トレンドラインを上回って確定しました。この即座の反応は非常に重要です。なぜなら、トレンドライン接触直後に形成された陽線が反転の根拠となるからです。わずかに下抜けしたものの、即時の陽線反応により市場は依然としてトレンドラインをサポートとして認識していることが確認できます。したがって、これは買い取引の正当なセットアップとなります。
トレンドラインでの反転を無効にする特定の条件が存在する一方で、正当化される条件も多くあります。これらの無効な条件を把握することで、誤った取引や誤アラートを回避できます。また、類似または繰り返し発生するシグナルによって短時間に複数の取引が実行されるのを防ぐためにも不可欠です。これにより、取引手法の規律を保ち、過剰取引を防ぐことができます。
確認済みブレイクアウト後の無効な反転

上昇トレンドラインは、すでに2本の陰線によって突破されています。そのため、たとえ陽線が最終的にトレンドラインを上回って確定したとしても、もはや正当な反転の指標とは見なされません。構造がすでに破られているため、ブレイクアウトは確定と判断されます。以降の陽線の動きは、単なるノイズやリテストの可能性と見なされ、正当なエントリーとは考えられません。
複数反転における重複取引シグナルの防止

前図に示された3本の陽線はいずれも、上昇トレンドラインにヒゲが触れた後に上方向へ反転しています。アルゴリズムは、適切な条件でこれらのパターンをフィルタリングしていなければ、同じ大きな反転の一部であっても、接触ごとに複数の取引を実行してしまう可能性があります。このような状況では、最初の有効なシグナルのみで取引を実行するロジックを作成することが重要です。
このロジックは、他の類似の状況についても十分に検討・確認する必要があります。適切に処理されなければ、エントリーの遅れ、取引の重複、あるいは誤シグナルの原因となる可能性があります。正当な反転状況を検証することに加え、密集したシグナルの中で不要な重複取引が発生しないよう、厳格な検証条件を設定することが不可欠です。
例
#include <Trade/Trade.mqh>
CTrade trade;
int MagicNumber = 532127;


// Timeframe to use for retrieving candlestick data (default is the current chart timeframe)
input ENUM_TIMEFRAMES time_frame = PERIOD_CURRENT;
// Input to enable or disable drawing of the ascending trend line (true = allow drawing)
input bool allow_uptrend = true;
// Number of candles to look back when identifying swing lows for drawing the trend line
input int LookbackBars = 5;

// Input to enable or disable drawing of the descebding trend line (true = allow drawing)
input bool allow_downtrend = true;
input bool allow_break_out = true;    // Enable or disable trade execution on trend line breakout (true = allow)
input bool allow_reversal = true;     // Enable or disable trade execution on trend line reversal (true = allow)
input double lot_size = 0.6;          // Lot size for each trade
input double sl_points = 10;          // Stop Loss in points from entry price
input double tp_points = 50;          // Take Profit in points from entry price

// Number of past bars (candlesticks) to check
int bars_check = 500;

// Arrays to store candlestick data
double close_price[];   // Stores close prices
double open_price[];    // Stores open prices
double low_price[];     // Stores low prices
double high_price[];    // Stores high prices
datetime time_price[];  // Stores time data for each candle

double first_low;           // Price value of the first identified swing low
datetime first_low_time;    // Time when the first swing low occurred

double second_low;          // Price value of the second identified swing low
datetime second_low_time;   // Time when the second swing low occurred
string up_trend = "Up Trend";  // Label used to name the ascending trend line object on the chart
long chart_id = ChartID();     // Stores the current chart ID for referencing during object creation or manipulation
double first_high;          // Price value of the first identified swing high (latest high)
datetime first_high_time;   // Time when the first swing high occurred
double second_high;         // Price value of the second identified swing high (older high)
datetime second_high_time;  // Time when the second swing high occurred
string down_trend = "Down Trend";  // Label used to name the descending trend line object on the chart
double t_line_value;   // Ascending trend line price level at the time of the most recent bar (not the ticking bar)
double t1_line_value;  // Ascending trend line price level at the time of the second most recent bar
double t2_line_value;  // Ascending trend line price level at the time of the third most recent bar
double t3_line_value;  // Ascending trend line price level at the time of the fourth most recent bar

// Time boundary used to limit lookback for valid reversal setups
datetime lookbackf_time;

datetime lastTradeBarTime = 0;

//+------------------------------------------------------------------+
//| Expert initialization function                                   |
//+------------------------------------------------------------------+
int OnInit()
  {
// Set arrays as series so the newest bar is index 0 ( start from the latest bar)
   ArraySetAsSeries(close_price, true);
   ArraySetAsSeries(open_price, true);
   ArraySetAsSeries(low_price, true);
   ArraySetAsSeries(high_price, true);
   ArraySetAsSeries(time_price, true);

   trade.SetExpertMagicNumber(MagicNumber);

   return(INIT_SUCCEEDED);  // Signal that the EA initialized successfully
  }

//+------------------------------------------------------------------+
//| Expert deinitialization function                                 |
//+------------------------------------------------------------------+
void OnDeinit(const int reason)
  {

   ObjectsDeleteAll(chart_id);

  }

//+------------------------------------------------------------------+
//| Expert tick function                                             |
//+------------------------------------------------------------------+
void OnTick()
  {
// Copy the latest candlestick data into the arrays
   CopyOpen(_Symbol, time_frame, 1, bars_check, open_price);     // Open prices
   CopyClose(_Symbol, time_frame, 1, bars_check, close_price);   // Close prices
   CopyLow(_Symbol, time_frame, 1, bars_check, low_price);       // Low prices
   CopyHigh(_Symbol, time_frame, 1, bars_check, high_price);     // High prices
   CopyTime(_Symbol, time_frame, 1, bars_check, time_price);     // Candle times

   double ask_price = SymbolInfoDouble(_Symbol,SYMBOL_ASK);
   datetime currentBarTime = iTime(_Symbol, time_frame, 0);

// If the user allows drawing of ascending trend line
   if(allow_uptrend)
     {
      // First loop: Find the most recent swing low (first low)
      for(int i = LookbackBars; i < bars_check - LookbackBars; i++)
        {
         // Check if current point is a swing low
         if(IsSwingLow(low_price, i, LookbackBars))
           {
            // Store price and time of the first (latest) swing low
            first_low = low_price[i];
            first_low_time = time_price[i];
            lookbackf_time = time_price[i - 3];

            break;  // Exit loop after finding the first swing low
           }
        }

      // Second loop: Find an earlier swing low that is lower than the first low
      for(int i = LookbackBars; i < bars_check - LookbackBars; i++)
        {
         // Check for earlier swing low that is lower and occurs before the first low
         if(IsSwingLow(low_price, i, LookbackBars) && low_price[i] < first_low && time_price[i] < first_low_time)
           {
            // Store price and time of the second (older) swing low
            second_low = low_price[i];
            second_low_time = time_price[i];
            break;  // Exit loop after finding the second swing low
           }
        }

      // Create an ascending trend line from the second low to the first low
      ObjectCreate(chart_id, up_trend, OBJ_TREND, 0, second_low_time, second_low, first_low_time, first_low);
      ObjectSetInteger(chart_id, up_trend, OBJPROP_TIMEFRAMES, OBJ_NO_PERIODS);  // Temporarily hide line on all timeframes

      // If the swing structure is valid (i.e., second low is lower than first)
      if(first_low > second_low && second_low > 0)
        {
         // Extend the trend line to the right
         ObjectSetInteger(chart_id, up_trend, OBJPROP_RAY_RIGHT, true);

         // Show the trend line on all timeframes
         ObjectSetInteger(chart_id, up_trend, OBJPROP_TIMEFRAMES, OBJ_ALL_PERIODS);

         // Set visual properties: color and thickness
         ObjectSetInteger(chart_id, up_trend, OBJPROP_COLOR, clrBlue);
         ObjectSetInteger(chart_id, up_trend, OBJPROP_WIDTH, 3);

         // Get the price values of the trend line at the corresponding times of the four most recent bars
         t_line_value = ObjectGetValueByTime(chart_id, up_trend, time_price[0], 0);   // Current bar
         t1_line_value = ObjectGetValueByTime(chart_id, up_trend, time_price[1], 0);  // One bar ago
         t2_line_value = ObjectGetValueByTime(chart_id, up_trend, time_price[2], 0);  // Two bars ago
         t3_line_value = ObjectGetValueByTime(chart_id, up_trend, time_price[3], 0);  // Three bars ago

         // Number of bars between the valid bullish confirmation candle and current time
         int no_bars = 0;

         // Loop through the last 4 bars to check for reversal wick touch on the trend line
         for(int i = 0; i <= 3; i++)
           {
            // Condition: Wick of the candle touches below the trend line but opens above it (indicating a potential reversal zone)
            if(low_price[i] < ObjectGetValueByTime(chart_id, up_trend, time_price[i], 0) &&
               open_price[i] > ObjectGetValueByTime(chart_id, up_trend, time_price[i], 0))
              {
               // Check if there's a bullish confirmation candle after the wick touch (within or immediately after)
               for(int j = i; j >= 0; j--)
                 {
                  // Bullish candle that closed above the trend line
                  if(close_price[j] > open_price[j] &&
                     close_price[j] > ObjectGetValueByTime(chart_id, up_trend, time_price[j], 0))
                    {
                     // Count how many bars ago this confirmation occurred
                     no_bars = Bars(_Symbol, time_frame, time_price[j], TimeCurrent());
                     break;
                    }
                 }
               break; // Exit after first valid reversal zone is found
              }
           }

         // Check whether a similar wick touch (reversal) happened recently to avoid repeated signals
         bool prev_touch = false;

         if((low_price[1] < t1_line_value && close_price[1] > open_price[1]) ||  // Bar 1 had reversal wick and bullish body
            (low_price[2] < t2_line_value && close_price[2] > open_price[2]))    // Bar 2 had reversal wick and bullish body
           {
            prev_touch = true;  // Flag that a recent touch already occurred
           }

         // Final condition for executing a BUY trade on a reversal setup
         if(
            // One of the recent 4 bars touched and rejected the trend line (wick below, open above), AND
            ((low_price[0] < t_line_value && open_price[0] > t_line_value) ||
             (low_price[1] < t1_line_value && open_price[1] > t1_line_value) ||
             (low_price[2] < t2_line_value && open_price[2] > t2_line_value) ||
             (low_price[3] < t3_line_value && open_price[3] > t3_line_value))
            &&
            // Current candle must be bullish and close above the trend line
            (close_price[0] > open_price[0]) && close_price[0] > t_line_value
            &&
            // The bullish confirmation must occur within 3 bars
            (no_bars < 3)
            &&
            // No recent wick reversal signal already processed
            prev_touch == false
            &&
            // The signal must be more recent than the lookback time threshold
            (time_price[3] > lookbackf_time)
            &&
            // Reversal signals are allowed and this signal is not duplicated from the same bar
            (allow_reversal == true && currentBarTime != lastTradeBarTime)
         )
           {
            // Execute BUY trade with defined lot size, SL and TP
            trade.Buy(lot_size, _Symbol, ask_price, ask_price - sl_points, ask_price + tp_points);
            lastTradeBarTime = currentBarTime; // Update last trade bar time to avoid duplicate signals
           }
        }
     }

//
// Only proceed if drawing descending trend lines is enabled
   if(allow_downtrend)
     {
      // First loop: Find the most recent swing high (first high)
      for(int i = LookbackBars; i < bars_check - LookbackBars; i++)
        {
         // Check if the current bar is a swing high
         if(IsSwingHigh(high_price, i, LookbackBars))
           {
            // Store the price and time of this latest swing high
            first_high = high_price[i];
            first_high_time = time_price[i];

            break;  // Exit loop once the first swing high is found
           }
        }

      // Second loop: Find an earlier swing high that is higher than the first high and occurred before it
      for(int i = LookbackBars; i < bars_check - LookbackBars; i++)
        {
         // Check for earlier swing high that is higher and happened before the first one
         if(IsSwingHigh(high_price, i, LookbackBars) && high_price[i] > first_high && time_price[i] < first_high_time)
           {
            // Store the price and time of this older swing high
            second_high = high_price[i];
            second_high_time = time_price[i];

            break;  // Exit loop once the second swing high is found
           }
        }

      // Create a trend line object from the second swing high to the first swing high
      ObjectCreate(chart_id, down_trend, OBJ_TREND, 0, second_high_time, second_high, first_high_time, first_high);

      // Initially hide the trend line across all timeframes to avoid partial drawing
      ObjectSetInteger(chart_id, down_trend, OBJPROP_TIMEFRAMES, OBJ_NO_PERIODS);

      // Validate the swing structure:
      // The older swing high should be higher than the later swing high to confirm a descending trend line
      if(first_high < second_high && second_high > 0)
        {
         // Extend the trend line indefinitely to the right for better visual guidance
         ObjectSetInteger(chart_id, down_trend, OBJPROP_RAY_RIGHT, true);

         // Make the trend line visible on all chart timeframes
         ObjectSetInteger(chart_id, down_trend, OBJPROP_TIMEFRAMES, OBJ_ALL_PERIODS);

         // Set the trend line color to dark green for clear distinction
         ObjectSetInteger(chart_id, down_trend, OBJPROP_COLOR, clrDarkGreen);

         // Set the thickness of the trend line to 3 pixels for better visibility
         ObjectSetInteger(chart_id, down_trend, OBJPROP_WIDTH, 3);

        }
     }
  }

//+------------------------------------------------------------------+
//| FUNCTION FOR LOWS                                                |
//+------------------------------------------------------------------+
bool IsSwingLow(const double &low[], int index, int lookback)
  {

   for(int i = 1; i <= lookback; i++)
     {

      if(low[index] > low[index - i] || low[index] > low[index + i])
         return false;
     }
   return true;
  }

//+------------------------------------------------------------------+
//| FUNCTION FOR HIGHS                                               |
//+------------------------------------------------------------------+
bool IsSwingHigh(const double &high[], int index, int lookback)
  {

   for(int i = 1; i <= lookback; i++)
     {
      if(high[index] < high[index - i] || high[index] < high[index + i])
         return false;
     }
   return true;
  }
出力


説明
MQL5で取引の発注や管理に使用されるCTrade クラスにアクセスするには、まず取引ライブラリTrade.mqhをインクルードします。Buy()やSell()のような関数で取引操作をおこなうために、CTradeオブジェクトであるtradeが構築されます。特定のEAが実行する取引を他の取引と区別するために、コンピュータはEAに一意のMagicNumberを割り当てます。この値はSetExpertMagicNumber()を使用して設定されます。
次に、いくつかの入力パラメータが指定されます。これにより、ユーザーはメインコードを変更せずにEAの動作を調整できます。たとえば、下落トレンド時の取引許可、ブレイクアウトパターンでの取引、または反転パターンでの取引を制御するために、オン/オフスイッチであるallow_downtrend、allow_break_out、allow_reversalが使用されます。さらに、sl_pointsとtp_pointsはエントリー価格からのストップロスおよびテイクプロフィットの距離(ポイント単位)を指定し、lot_sizeパラメータはポジションサイズを決定します。
タイミング制御には、lookbackf_timeとlastTradeBarTimeの2つの変数が使用されます。lookbackf_timeはソフトウェアが正当な反転パターンを検索する過去の期間を決定します。この期間以前のパターンは無視されます。重複または繰り返しのシグナルを排除するために、lastTradeBarTime 変数は同じローソク足上で複数回の取引がおこなわれないように制御します。
int no_bars = 0;
for(int i = 0; i <= 3; i++)
  {
   if(low_price[i] < ObjectGetValueByTime(chart_id, up_trend, time_price[i], 0) &&
      open_price[i] > ObjectGetValueByTime(chart_id, up_trend, time_price[i], 0))
     {
      for(int j = i; j >= 0; j--)
        {
         if(close_price[j] > open_price[j] &&
            close_price[j] > ObjectGetValueByTime(chart_id, up_trend, time_price[j], 0))
           {
            no_bars = Bars(_Symbol, time_frame, time_price[j], TimeCurrent());
            break;
           }
        }
      break;
     }
  }
ここでは、最新の4本のローソク足(バー0〜3)をスキャンし、反転シグナルを示す可能性のあるヒゲの動きを確認します。具体的には、安値がトレンドラインを下回ったものの、始値は上回った場合です。これは、トレンドラインが拒否されたことを示しています。このようなローソク足が確認されると、内部ループで強気の確認ローソク足を探します。確認ローソク足とは、始値とトレンドラインの両方を上回って確定したローソク足です。見つかった場合、Bars()を使って何本前のバーで確認がおこなわれたかを算出し、その結果をno_barsに保存します。
bool prev_touch = false;
if((low_price[1] < t1_line_value && close_price[1] > open_price[1]) ||
   (low_price[2] < t2_line_value && close_price[2] > open_price[2])) {
    prev_touch = true;
}
このブロックでは、ローソク足1または2がすでにトレンドラインに触れ、陽線として確定しているかどうかを判定します。これは、重複や早すぎる警告を防ぐためです。いずれかの条件が満たされると prev_touchがtrueに設定されます。これは、最近すでに反転が発生していた可能性があり、現在のバーでの新たなシグナルは無視すべきことを示しています。
if(
   ((low_price[0] < t_line_value && open_price[0] > t_line_value) ||
    (low_price[1] < t1_line_value && open_price[1] > t1_line_value) ||
    (low_price[2] < t2_line_value && open_price[2] > t2_line_value) ||
    (low_price[3] < t3_line_value && open_price[3] > t3_line_value))
   &&
   (close_price[0] > open_price[0]) && close_price[0] > t_line_value
   &&
   (no_bars < 3)
   &&
   prev_touch == false
   &&
   (time_price[3] > lookbackf_time)
   &&
   (allow_reversal == true && currentBarTime != lastTradeBarTime)
)
  {
   trade.Buy(lot_size, _Symbol, ask_price, ask_price - sl_points, ask_price + tp_points);
   lastTradeBarTime = currentBarTime;
  }
まず、直近4本のローソク足のうち少なくとも1本がヒゲの動きを示しているかを確認します。ヒゲの動きとは、価格がトレンドラインに触れたものの始値は上回っている状態で、反発の可能性を示唆します。次に、現在のローソク足が陽線であり、かつトレンドラインを上回って確定していることを確認し、シグナルを強化します。最後に、以前に確認された陽線の確認ローソク足が直近3本以内に発生していることを要求し、このセットアップがまだ有効であることを保証します。この条件ブロックは、反転の買い取引を実行すべきかどうかを、複数の重要な基準をチェックすることで判断します。
アルゴリズムは、同様のヒゲ接触シグナルが最近検出されていないことを確認します。そのため、prev_touch は false である必要があり、重複したエントリーを防ぎます。さらに、セットアップが指定されたlookbackf_timeよりも新しいことを確認し、プログラムが正当なシグナルとして受け入れる範囲を制限します。
最後に、currentBarTimeがlastTradeBarTimeと等しくないことを確認することで、重複を防ぎ、反転取引が許可されていること(allow_reversalがtrue)および同じローソク足で取引がすでにおこなわれていないことを確認します。これらすべての条件が満たされると、指定されたロットサイズ、ストップロス、テイクプロフィットの値で買い注文が実行されます。同じローソク足での追加取引を防ぐため、lastTradeBarTimeは現在のバーの時間に更新されます。
4.1.1.2. ブレイクアウトとリテスト
上昇トレンドライン周辺のブレイクアウト&リテストのセットアップは、反転と同様の注文基準に従います。価格はトレンドラインを下回った後、現在はレジスタンスとして機能している破られたサポートをリテストするために後退する可能性があります。このリテストは、実体のあるローソク足でも、ヒゲだけでトレンドラインに触れる場合でも発生する可能性があります。リテストが成功し、価格が拒否された場合には、売り注文を出すことでブレイクアウトを確認できます。

例
// If the user allows drawing of ascending trend line
if(allow_uptrend)
  {
// First loop: Find the most recent swing low (first low)
   for(int i = LookbackBars; i < bars_check - LookbackBars; i++)
     {
      // Check if current point is a swing low
      if(IsSwingLow(low_price, i, LookbackBars))
        {
         // Store price and time of the first (latest) swing low
         first_low = low_price[i];
         first_low_time = time_price[i];
         lookbackf_time = time_price[i - 3];

         break;  // Exit loop after finding the first swing low
        }
     }

// Second loop: Find an earlier swing low that is lower than the first low
   for(int i = LookbackBars; i < bars_check - LookbackBars; i++)
     {
      // Check for earlier swing low that is lower and occurs before the first low
      if(IsSwingLow(low_price, i, LookbackBars) && low_price[i] < first_low && time_price[i] < first_low_time)
        {
         // Store price and time of the second (older) swing low
         second_low = low_price[i];
         second_low_time = time_price[i];
         break;  // Exit loop after finding the second swing low
        }
     }

// Create an ascending trend line from the second low to the first low
   ObjectCreate(chart_id, up_trend, OBJ_TREND, 0, second_low_time, second_low, first_low_time, first_low);
   ObjectSetInteger(chart_id, up_trend, OBJPROP_TIMEFRAMES, OBJ_NO_PERIODS);  // Temporarily hide line on all timeframes

// If the swing structure is valid (i.e., second low is lower than first)
   if(first_low > second_low && second_low > 0)
     {
      // Extend the trend line to the right
      ObjectSetInteger(chart_id, up_trend, OBJPROP_RAY_RIGHT, true);

      // Show the trend line on all timeframes
      ObjectSetInteger(chart_id, up_trend, OBJPROP_TIMEFRAMES, OBJ_ALL_PERIODS);

      // Set visual properties: color and thickness
      ObjectSetInteger(chart_id, up_trend, OBJPROP_COLOR, clrBlue);
      ObjectSetInteger(chart_id, up_trend, OBJPROP_WIDTH, 3);


      // Get the price values of the trend line at the corresponding times of the four most recent bars
      t_line_value = ObjectGetValueByTime(chart_id, up_trend, time_price[0], 0);   // Current bar
      t1_line_value = ObjectGetValueByTime(chart_id, up_trend, time_price[1], 0);  // One bar ago
      t2_line_value = ObjectGetValueByTime(chart_id, up_trend, time_price[2], 0);  // Two bars ago
      t3_line_value = ObjectGetValueByTime(chart_id, up_trend, time_price[3], 0);  // Three bars ago

      // Number of bars between the valid bullish confirmation candle and current time
      int no_bars = 0;

      // Loop through the last 4 bars to check for reversal wick touch on the trend line
      for(int i = 0; i <= 3; i++)
        {
         // Condition: Wick of the candle touches below the trend line but opens above it (indicating a potential reversal zone)
         if(low_price[i] < ObjectGetValueByTime(chart_id, up_trend, time_price[i], 0) &&
            open_price[i] > ObjectGetValueByTime(chart_id, up_trend, time_price[i], 0))
           {
            // Check if there's a bullish confirmation candle after the wick touch (within or immediately after)
            for(int j = i; j >= 0; j--)
              {
               // Bullish candle that closed above the trend line
               if(close_price[j] > open_price[j] &&
                  close_price[j] > ObjectGetValueByTime(chart_id, up_trend, time_price[j], 0))
                 {
                  // Count how many bars ago this confirmation occurred
                  no_bars = Bars(_Symbol, time_frame, time_price[j], TimeCurrent());
                  break;
                 }
              }
            break; // Exit after first valid reversal zone is found
           }
        }

      // Check whether a similar wick touch (reversal) happened recently to avoid repeated signals
      bool prev_touch = false;

      if((low_price[1] < t1_line_value && close_price[1] > open_price[1]) ||  // Bar 1 had reversal wick and bullish body
         (low_price[2] < t2_line_value && close_price[2] > open_price[2]))    // Bar 2 had reversal wick and bullish body
        {
         prev_touch = true;  // Flag that a recent touch already occurred
        }

      // Final condition for executing a BUY trade on a reversal setup
      if(
         // One of the recent 4 bars touched and rejected the trend line (wick below, open above), AND
         ((low_price[0] < t_line_value && open_price[0] > t_line_value) ||
          (low_price[1] < t1_line_value && open_price[1] > t1_line_value) ||
          (low_price[2] < t2_line_value && open_price[2] > t2_line_value) ||
          (low_price[3] < t3_line_value && open_price[3] > t3_line_value))
         &&
         // Current candle must be bullish and close above the trend line
         (close_price[0] > open_price[0]) && close_price[0] > t_line_value
         &&
         // The bullish confirmation must occur within 3 bars
         (no_bars < 3)
         &&
         // No recent wick reversal signal already processed
         prev_touch == false
         &&
         // The signal must be more recent than the lookback time threshold
         (time_price[3] > lookbackf_time)
         &&
         // Reversal signals are allowed and this signal is not duplicated from the same bar
         (allow_reversal == true && currentBarTime != lastTradeBarTime)
      )
        {
         // Execute BUY trade with defined lot size, SL and TP
         trade.Buy(lot_size, _Symbol, ask_price, ask_price - sl_points, ask_price + tp_points);
         lastTradeBarTime = currentBarTime; // Update last trade bar time to avoid duplicate signals
        }

      //BREAKOUT AND RETEST

      // Flag to track whether a recent bearish wick rejection (touch) already occurred
      bool prev_touch2 = false;

      // Check the last 2 bars to see if a candle had its high wick above the trend line,
      // but closed bearishly below the open - indicating a possible rejection
      if((high_price[1] > t1_line_value && close_price[1] < open_price[1]) ||
         (high_price[2] > t2_line_value && close_price[2] < open_price[2] && open_price[2] < t2_line_value))
        {
         prev_touch2 = true; // Set flag to avoid duplicate signals
        }

      // Variable to store how many bars ago the bearish confirmation candle appeared
      int no_bars2 = 0;

      // Loop through the last 4 candles to detect a wick rejection of the trend line (retest)
      for(int i = 0; i <= 3; i++)
        {
         // Condition: Candle wick (high) goes above the trend line, but the open is below it
         if(high_price[i] > ObjectGetValueByTime(chart_id, up_trend, time_price[i], 0) &&
            open_price[i] < ObjectGetValueByTime(chart_id, up_trend, time_price[i], 0))
           {
            // Search backward from that bar for a bearish confirmation candle
            for(int j = i; j >= 0; j--)
              {
               // Bearish candle that also closed below the trend line
               if(close_price[j] < open_price[j] &&
                  close_price[j] < ObjectGetValueByTime(chart_id, up_trend, time_price[j], 0))
                 {
                  // Count bars between that confirmation and now
                  no_bars2 = Bars(_Symbol, time_frame, time_price[j], TimeCurrent());
                  break; // Exit inner loop
                 }
              }
            break; // Exit outer loop after first valid retest
           }
        }

      // Final conditions to confirm a breakout and retest sell setup:
      // 1. One of the last 4 candles had a wick above the trend line but opened below it
      // 2. Current candle is bearish and closed below the trend line
      // 3. There was no recent similar signal (prev_touch2 == false)
      // 4. The bearish confirmation occurred within the last 3 bars
      // 5. Breakout trades are allowed and this signal is not from the same bar as the last trade
      if(((high_price[1] >= t1_line_value && open_price[1] < t1_line_value) ||
          (high_price[2] >= t2_line_value && open_price[2] < t2_line_value) ||
          (high_price[3] >= t3_line_value && open_price[3] < t3_line_value) ||
          (high_price[0] >= t_line_value)) &&
         (close_price[0] < t_line_value && close_price[0] < open_price[0] && open_price[1] < t1_line_value) &&
         prev_touch2 == false &&
         (no_bars2 < 3) &&
         (allow_break_out == true && currentBarTime != lastTradeBarTime))
        {
         // All conditions met - place SELL trade with defined SL and TP
         trade.Sell(lot_size, _Symbol, ask_price, ask_price + sl_points, ask_price - tp_points);

         // Update timestamp to prevent duplicate signals from the same bar
         lastTradeBarTime = currentBarTime;
        }
     }
  }
出力


説明
コードはまず、prev_touch2というブール型変数を宣言します。この変数は、最近すでに陰線のヒゲでの反発(フェイクブレイクアウト)が発生していないかを検知するフラグとして機能します。このフラグの目的は、同じセットアップから複数の取引シグナルが誤って発生するのを防ぐことです。これにより、誤シグナルを減らし、エキスパートアドバイザーが新しい有効なセットアップにのみ反応するようになります。
次に、アルゴリズムは直近2本のローソク足(high_price[1]とhigh_price[2])を分析して、トレンドラインでの陰線のヒゲによる反発の兆候を探します。具体的には、ローソク足の高値が最終的に始値を下回って確定しているか(売り圧力があり、ブレイクアウトを維持できなかったことを示す)、あるいは一時的にトレンドラインを上抜けたか(潜在的なブレイクアウト試行の可能性)を確認します。反発を確認するために、2本目のバー([2])では始値もトレンドライン以下であることを条件に追加します。これらの条件のいずれかが満たされると、prev_touch2はtrueに設定されます。
トレンドラインにヒゲが触れた後、変数no_bars2が初期化され、確認用の陰線が何本前に出現したかを記録します。この情報は、シグナルがまだ有効であり、リテストが最近おこなわれたことを確認するうえで重要です。
その後、コードは直近4本のローソク足を繰り返しループでチェックします。目的は、ヒゲ(高値)がトレンドラインを越えたものの始値は下回っていたローソク足を見つけることです。これは、価格がトレンドラインを試したものの、きれいにブレイクできなかったことを示します。該当ローソク足を見つけると、ネストされたループで過去にさかのぼり、確認用の陰線を探します。確認用の陰線とは、始値とトレンドラインの両方を下回って確定したローソク足です。この確認ローソク足が見つかれば、Bars()メソッドを使って何本前に出現したかを算出し、その結果をno_bars2に保存します。計算負荷を減らすため、有効なシグナルが検出されるとループは早期終了します。
最後に、売り取引を実行するかどうかを判断するための複合条件を評価します。条件は次の通りです。
- 直近4本のローソク足のうちいずれかのヒゲがトレンドラインを上抜けしたが始値は下回っていた。
- 現在のローソク足が陰線であり、トレンドラインと自身の始値の両方を下回って確定している。
- 同様のシグナルが以前に発生していない (prev_touch2 == false)
- 確認用の陰線が直近3本以内に発生している。
- 取引が許可されており(allow_break_out == true)、同じバーからの重複取引ではない(currentBarTime != lastTradeBarTime)。
これらすべての条件が満たされる場合、指定されたロットサイズ、ストップロス、テイクプロフィットで売り注文が実行されます。同じシグナルから再度取引がおこなわれないよう、lastTradeBarTimeは現在のバーの時間に更新されます。
4.1.2. 下降トレンドライン取引執行
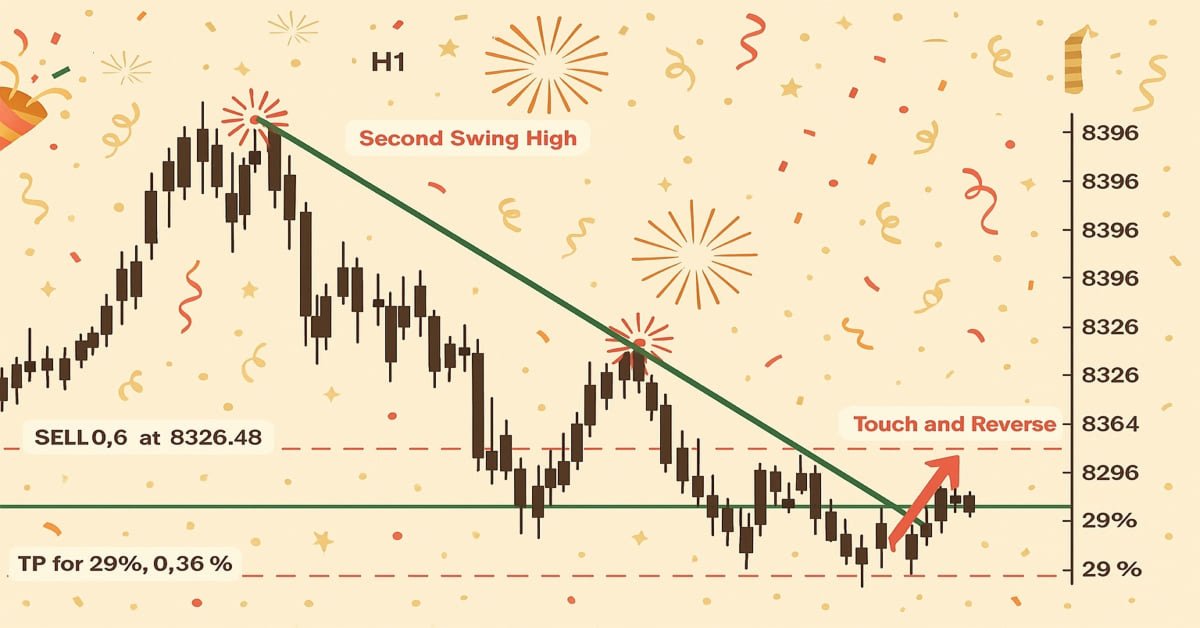
このセクションでは、下降トレンドラインでのブレイクアウトと反転の可能性を探ります。考え方は、上昇トレンドラインの場合とほぼ逆です。重複を避けるため、ここではあまり詳しくは説明しません。方法論や構造はほぼ同一だからです。注目すべきは、反転時の陰線セットアップおよびブレイクアウトやリテスト時の陽線セットアップです。下降トレンドラインはレジスタンスとして機能するため、これが主な違いとなります。
例
// Only proceed if drawing descending trend lines is enabled
if(allow_downtrend)
  {
// First loop: Find the most recent swing high (first high)
   for(int i = LookbackBars; i < bars_check - LookbackBars; i++)
     {
      // Check if the current bar is a swing high
      if(IsSwingHigh(high_price, i, LookbackBars))
        {
         // Store the price and time of this latest swing high
         first_high = high_price[i];
         first_high_time = time_price[i];

         break;  // Exit loop once the first swing high is found
        }
     }

// Second loop: Find an earlier swing high that is higher than the first high and occurred before it
   for(int i = LookbackBars; i < bars_check - LookbackBars; i++)
     {
      // Check for earlier swing high that is higher and happened before the first one
      if(IsSwingHigh(high_price, i, LookbackBars) && high_price[i] > first_high && time_price[i] < first_high_time)
        {
         // Store the price and time of this older swing high
         second_high = high_price[i];
         second_high_time = time_price[i];

         break;  // Exit loop once the second swing high is found
        }
     }

// Create a trend line object from the second swing high to the first swing high
   ObjectCreate(chart_id, down_trend, OBJ_TREND, 0, second_high_time, second_high, first_high_time, first_high);

// Initially hide the trend line across all timeframes to avoid partial drawing
   ObjectSetInteger(chart_id, down_trend, OBJPROP_TIMEFRAMES, OBJ_NO_PERIODS);

// Validate the swing structure:
// The older swing high should be higher than the later swing high to confirm a descending trend line
   if(first_high < second_high && second_high > 0)
     {
      // Extend the trend line indefinitely to the right for better visual guidance
      ObjectSetInteger(chart_id, down_trend, OBJPROP_RAY_RIGHT, true);

      // Make the trend line visible on all chart timeframes
      ObjectSetInteger(chart_id, down_trend, OBJPROP_TIMEFRAMES, OBJ_ALL_PERIODS);

      // Set the trend line color to dark green for clear distinction
      ObjectSetInteger(chart_id, down_trend, OBJPROP_COLOR, clrDarkGreen);

      // Set the thickness of the trend line to 3 pixels for better visibility
      ObjectSetInteger(chart_id, down_trend, OBJPROP_WIDTH, 3);

      //REVERSAL

      td_line_value = ObjectGetValueByTime(chart_id,down_trend,time_price[0],0);
      td1_line_value = ObjectGetValueByTime(chart_id,down_trend,time_price[1],0);
      td2_line_value = ObjectGetValueByTime(chart_id,down_trend,time_price[2],0);
      td3_line_value = ObjectGetValueByTime(chart_id,down_trend,time_price[3],0);

      int no_bars = 0;

      for(int i = 0; i <= 3; i++)
        {

         if(high_price[i] > ObjectGetValueByTime(chart_id,down_trend,time_price[i],0) && open_price[i] < ObjectGetValueByTime(chart_id,down_trend,time_price[i],0)
           )
           {

            for(int j = i; j >= 0; j--)
              {

               if(close_price[j] < open_price[j] && close_price[j] < ObjectGetValueByTime(chart_id,down_trend,time_price[j],0))
                 {

                  no_bars = Bars(_Symbol,time_frame,time_price[j],TimeCurrent());

                  break;

                 }

              }
            break;

           }

        }

      bool prev_touch = false;

      if((high_price[1] > td1_line_value && close_price[1] < open_price[1])
         ||
         (high_price[2] > td2_line_value && close_price[2] < open_price[2])
        )
        {

         prev_touch = true;

        }

      if(((high_price[1] >= td1_line_value && open_price[1] < td1_line_value) || (high_price[2] >= td2_line_value && open_price[2] < td2_line_value)
          || (high_price[3] >= td3_line_value && open_price[3] < td3_line_value) || (high_price[0] >= td_line_value))
         && (close_price[0] < td_line_value && close_price[0] < open_price[0] && open_price[1] < td1_line_value)
         && (no_bars < 3)
         && prev_touch == false
         && (allow_reversal == true  && currentBarTime != lastTradeBarTime)
        )
        {

         trade.Sell(lot_size,_Symbol,ask_price,ask_price + sl_points, ask_price - tp_points);
         lastTradeBarTime = currentBarTime;

        }

      //BREAKOUT AMD RETEST

      // Flag to track whether a recent bullish wick rejection (touch) already occurred
      bool prev_touch2 = false;

      // Check the last 2 candles for bullish rejection from below the descending trend line
      // A bullish rejection occurs when the low goes below the trend line but closes above the open (bullish candle)
      if((low_price[1] < td1_line_value && close_price[1] > open_price[1]) ||
         (low_price[2] < td2_line_value && close_price[2] > open_price[2] && open_price[2] > td2_line_value))
        {
         prev_touch2 = true; // Set flag to prevent duplicate signals from the same type of setup
        }

      // Variable to hold how many bars ago a bullish confirmation candle occurred after wick rejection
      int no_bars2 = 0;

      // Loop through the last 4 candles to detect a wick rejection of the descending trend line
      for(int i = 0; i <= 3; i++)
        {
         // Condition: Candle wick (low) goes below the trend line, but the open is above it
         if(low_price[i] < ObjectGetValueByTime(chart_id, down_trend, time_price[i], 0) &&
            open_price[i] > ObjectGetValueByTime(chart_id, down_trend, time_price[i], 0))
           {
            // Look backward for a bullish confirmation candle that closes above the trend line
            for(int j = i; j >= 0; j--)
              {
               if(close_price[j] > open_price[j] &&
                  close_price[j] > ObjectGetValueByTime(chart_id, down_trend, time_price[j], 0))
                 {
                  // Count how many bars ago that bullish confirmation happened
                  no_bars2 = Bars(_Symbol, time_frame, time_price[j], TimeCurrent());
                  break; // Exit inner loop once confirmation is found
                 }
              }
            break; // Exit outer loop after the first valid retest is processed
           }
        }

      // Final conditions to confirm a breakout or retest for a BUY setup on descending trend line:
      // 1. One of the last 4 candles had a wick below the trend line but opened above it
      // 2. Current candle is bullish and closed above the trend line
      // 3. A valid bullish confirmation occurred within the last 3 bars
      // 4. No recent similar touch detected (prev_touch2 == false)
      // 5. Candle timestamps are valid (not too far back)
      // 6. Breakout trading is allowed, and this bar is not the same as the last trade bar
      if(
         ((low_price[0] < td_line_value && open_price[0] > td_line_value) ||
          (low_price[1] < td1_line_value && open_price[1] > td1_line_value) ||
          (low_price[2] < td2_line_value && open_price[2] > td2_line_value) ||
          (low_price[3] < td3_line_value && open_price[3] > td3_line_value)) &&
         (close_price[0] > open_price[0]) && close_price[0] > td_line_value &&
         (no_bars2 < 3) &&
         prev_touch2 == false &&
         (time_price[3] > lookbackfd_time) &&
         (allow_break_out == true && currentBarTime != lastTradeBarTime)
      )
        {
         // All conditions met - place a BUY trade with defined SL and TP
         trade.Buy(lot_size, _Symbol, ask_price, ask_price - sl_points, ask_price + tp_points);

         // Update the last trade time to avoid repeated trades from the same bar
         lastTradeBarTime = currentBarTime;
        }
     }
  }
出力


説明
このセクションでは、下降トレンドラインのブレイクアウトや反発に基づく買い取引のロジック が実装されています。まず、最近すでに陽線のヒゲでの反発が発生していないかを確認するために、prev_touch2というブール型変数を構築します。これにより、同じシグナルで重複した取引が発生するのを防ぐことができます。次に、直近2本のローソク足を確認し、下降トレンドラインを下抜けたものの始値を上回って確定した陽線のヒゲが存在するかを調べます。該当する場合、prev_touch2はtrueに設定されます。
その後、正当な確認用の陽線が出現してから何本のローソク足が経過したかを、no_bars2という変数に保存します。リテストの可能性を確認するために、直近4本のローソク足をチェックし、下降トレンドラインを下回ったヒゲがあるかつ始値は上回っているローソク足を探します。そのようなヒゲでの反発が見つかれば、該当ローソク足から過去にさかのぼり、下降トレンドラインと始値の両方を上回って確定した陽線確認ローソク足を探します。見つかった場合、確認ローソク足をno_bars2に保存し、何本前に出現したかを算出します。
最後に、正当な買いセットアップかどうかを確認するために、複数の条件を統合します。直近4本のローソク足のうち、トレンドラインを上回って始まったもののヒゲが下回っていたローソク足があるかを確認します。また、現在のローソク足がトレンドラインを上回って確定した陽線であること、確認用の陽線が直近3本以内に出現していることも検証します。
加えて、時間軸が適切であること、ブレイクアウト取引が許可されていること、シグナルが前回の取引と同じローソク足からではないこと、そして最近の反発 (prev_touch2)が記録されていないことを確認します。これらすべての条件が満たされる場合、EAは指定されたロットサイズ、ストップロス、テイクプロフィットの値で買い注文を実行します。同じローソク足から重複した取引がおこなわれないよう、lastTradeBarTimeは現在のバーの時間に更新されます。
結論
この記事で扱った内容を通して、トレンドラインを用いたあらゆるチャートパターンに対応するための基礎知識を身につけることができました。チャンネルや上昇・下降トレンドラインに関わる価格動向を取得し、それを比較して、明確なブレイクアウトや反転条件に基づいて取引を実行する方法を学びました。この知識は実践的に応用され、トレンドラインとの相互作用をリアルタイムで自動的に検出・反応するEAの構築に活かされています。このロジックは非常に柔軟で、トライアングルやウェッジ、さらにはダブルトップやダブルボトムなど、他のチャートパターンにも応用可能です。
MetaQuotes Ltdにより英語から翻訳されました。
元の記事: https://www.mql5.com/en/articles/18259
警告: これらの資料についてのすべての権利はMetaQuotes Ltd.が保有しています。これらの資料の全部または一部の複製や再プリントは禁じられています。
この記事はサイトのユーザーによって執筆されたものであり、著者の個人的な見解を反映しています。MetaQuotes Ltdは、提示された情報の正確性や、記載されているソリューション、戦略、または推奨事項の使用によって生じたいかなる結果についても責任を負いません。

- 無料取引アプリ
- 8千を超えるシグナルをコピー
- 金融ニュースで金融マーケットを探索
こんにちは
あなたのEaはボラティリティのデリバティブで機能しますか?
この記事をありがとう。神のご加護を。
どういたしまして、温かいお言葉ありがとうございます。