MQL5 简介(第 17 部分):构建趋势反转 EA 交易

概述
欢迎回到 MQL5入门系列第 17 部分!本部分继续以我们迄今为止探索的一切为基础,使用我们标志性的基于项目的方法,通过现实世界的例子帮助您提高 MQL5 技能。 在第 16 部分中,我们重点介绍了头肩形态,构建了一个能够自动检测该形态、进行交易甚至在图表上可视化该形态的 EA 交易。这是学习如何在 MQL5 中使用图表形态的好方法。
本文最初打算使用单一的延续或反转形态,例如旗形、下降楔形或上升楔形。然而,当我深入研究后,我发现了一些关键的东西:很多这样的形态都有相似的结构,并且经常依赖于趋势线的突破或反转。因此,本节将重点开发一个能够识别和交易趋势线突破和反转情况的 EA 交易,而不是将自己局限于单一模式。稍作调整,掌握这些基本概念后,你就可以将它们应用于各种图表形态。
在本文中,您将学习:
- 如何使用 ObjectGetValueByTime() 获取给定烛形时刻趋势线的确切价格值。
- 根据趋势线附近的柱形结构,识别潜在的突破和反转信号。
- 上升趋势线和下降趋势线的区别,以及如何解读它们与价格走势的相互作用。
- 关于检查近期烛形行为(如影线和收盘价)以确认价格拒绝或突破的重要性。
- 利用基于时间的比较来避免根据过时或不相关的信号执行交易。
- 如何构建一个基本但灵活的 EA 交易,使其能够根据与趋势线的交互自动进行交易。
1.理解趋势线
在图表上,穿过两个或多个价格点的直线称为趋势线。如果定位得当,它可以帮助您识别当前的趋势和可能的交易机会。趋势线是倾斜的,遵循市场的自然方向,可能是横向、向上或向下,而不是既定的水平支撑和阻力位。
由于许多图表形态是由趋势线构建或围绕趋势线创建的,因此趋势线对于识别某些形态尤为重要。例如,价格被挤压在两条收敛的趋势线之间,直到在下跌或上涨的楔形中出现突破。在旗形和三角旗形形态中,趋势线定义了行情延续之前的盘整区域。
1.1.趋势线的类型
1.1.1.上升趋势线
在上升趋势中,上升趋势线通过连接更高的低点作为支撑位。它可以帮助您在价格跌破它时识别可能的卖出机会,表明潜在的趋势逆转或更深的衰退,以及在回调期间的买入机会。

1.1.2.下降趋势线
下降趋势线表示看跌势头,而上升趋势线则表示向上的方向。在下跌的市场中,它是通过连接两个或多个较低的高点而产生的。作为阻力位,这条向下倾斜的线表明市场正朝着看跌的方向发展。
在短暂的价格上涨期间,下降趋势线提供了卖出机会,因为它们预测一旦价格触及该线,价格就会下跌。然而,突破很重要,上升趋势线也是如此。价格可能预示着从下行趋势向上行趋势的转变,如果突破下跌趋势线,则可能出现买入机会。

下降趋势线表示看跌势头,而上升趋势线则表示向上的方向。在下跌的市场中,它是通过连接两个或多个较低的高点而产生的。作为阻力位,这条向下倾斜的线表明市场正朝着看跌的方向发展。
通过强调经常表明市场势头变化的重大突破,趋势线提供了视觉清晰度和战术交易入场点。理解趋势线行为,而不是死记硬背特定的模式,为形态识别提供了多功能的基础,并且在开发自动化技术(例如 MQL5 中的 EA 交易)时特别有帮助。
2.设置项目
2.1.EA 的工作原理
在这个项目中,我们将创建一个 EA 交易,利用图表的趋势线自动进行交易。根据市场状况,EA 通过分析近期的高点和低点来创建合格的上升或下降趋势线。
该 EA 会跟踪价格与已建立的趋势线之间的相互作用。主要有两种情况需要进行交易。该 EA 会先顺势交易,预期价格触及趋势线后会发生反转。其次,EA 将识别突破-回测形态,并在价格突破趋势线并从相反方向回测时,在突破方向上进行交易。基于这种逻辑,EA 可以与各种图表形态一起使用,包括楔形、旗形、三角形和通道,所有这些形态主要取决于趋势线的动态。
2.1.1.上升趋势线
2.1.1.1.买入逻辑
- 该 EA 将检测到两个波动低点,并在它们之间绘制一条上升趋势线。
- 该 EA 会持续监控价格走势,观察其是否回落到趋势线附近,但不会突破趋势线。
- 当价格触及趋势线并立即形成阳线时,EA 会将其视为有效的反弹。
- 当确认价格从上升趋势线反弹后,EA 会设置买入订单。
- 用户可以指定止损点位低于入场价格或反弹烛形的最低价的点数。
- 用户可以指定高于入场价格的止盈点数。

2.1.1.2.卖出逻辑
- 该 EA 将检测到两个波动低点,并在它们之间绘制一条上升趋势线。
- 它会持续监测价格是否跌破这条上升趋势线。
- 一旦价格跌破趋势线,EA 就会等待回测 —— 即价格从下方回落并触及趋势线。
- 如果在回测之后立即形成一根阴线,且最低价低于趋势线,则 EA 会将此视为有效的突破和确认。
- 一旦确认出现看跌回测,EA 就会设置卖出订单。
- 用户可以将止损点数指定为高于入场价格或高于回测烛形最高价的点数。
- 用户还可以指定低于入场价格的止盈点数。

2.1.2.下降趋势线
2.1.2.1.买入逻辑
- 该 EA 将检测到两个波动高点,并在它们之间绘制一条下降趋势线。
- 它持续监测下行趋势线上方的看涨突破。
- 一旦价格突破趋势线,EA 就会等待回测 —— 即价格从上方回落并触及或接近被突破的趋势线。
- 如果在回测之后立即形成一根阳线,且最高价高于趋势线,则 EA 会将此视为有效的突破和确认。
- 当看涨回测得到确认后,EA 会设置买入订单。
- 用户可以将入场价格或回测蜡烛图最低价下方的点数指定为止损 (SL)。
- 用户还可以指定止盈点(TP),以高于入场价格的点数表示。

2.1.2.2.卖出逻辑
- 该 EA 将检测到两个波动高点,并在它们之间绘制一条下降趋势线。
- 它持续监测触及下降趋势线的价格变动。
- 当价格触及趋势线并立即形成阴线时,EA 会将其视为有效的反转信号。
- 在确认从下降趋势线出现看跌反弹后,EA 发出卖出订单。
- 用户可以指定高于入场价格或反弹烛形最高点的点数作为止损点 (SL)。
- 用户还可以指定止盈点(TP),以低于入场价格的点数表示。

请注意: 本项目将探讨一种交易策略,其主要目标是提高您对 MQL5 编程理念的理解,特别是如何处理图表形态和创建有用的 EA 交易。它不适用于真实资金交易或实时交易。在将任何技术应用于真实市场之前,务必进行全面的回测,并向金融专家寻求建议。
3.识别上升和下降趋势线
既然我们已经彻底讨论了 EA 交易的运行方式,现在就可以开始以编程方式将其付诸实践了。让 EA 能够自动识别和绘制趋势线是第一步。EA 会先在图表上找到两个重要的转折点,然后再绘制趋势线。它会寻找最近两个更高的低点(波动低点),这表明上升势头,从而形成上升趋势线。
它将寻找最近的两个较低高点(波动高点),这表示下行压力,从而形成下降趋势线。确定这些波动位置后,EA 会将它们与趋势线连接起来。然后,这条线就成为识别可能突破或反转机会的基准线。
3.1.获取柱形数据
任何涉及图表形态的项目,其关键组成部分都是柱形数据。如果没有它,就无法评估价格结构或识别价格波动的高点和低点。因此,从图表中提取历史柱形数据是创建我们 EA 的第一步。该数据包含重要的价格详情,例如每根烛形的开盘价、最高价、最低价和收盘价。利用这些数据,我们将能够识别趋势线、现货市场结构,并利用反转或突破信号来发现可能的交易入场点。
示例:// Timeframe to use for retrieving candlestick data (default is the current chart timeframe) input ENUM_TIMEFRAMES time_frame = PERIOD_CURRENT; // Number of past bars (candlesticks) to check int bars_check = 500; // Arrays to store candlestick data double close_price[]; // Stores close prices double open_price[]; // Stores open prices double low_price[]; // Stores low prices double high_price[]; // Stores high prices datetime time_price[]; // Stores time data for each candle //+------------------------------------------------------------------+ //| Expert initialization function | //+------------------------------------------------------------------+ int OnInit() { // Set arrays as series so the newest bar is index 0 ( start from the latest bar) ArraySetAsSeries(close_price, true); ArraySetAsSeries(open_price, true); ArraySetAsSeries(low_price, true); ArraySetAsSeries(high_price, true); ArraySetAsSeries(time_price, true); return(INIT_SUCCEEDED); // Signal that the EA initialized successfully } //+------------------------------------------------------------------+ //| Expert deinitialization function | //+------------------------------------------------------------------+ void OnDeinit(const int reason) { } //+------------------------------------------------------------------+ //| Expert tick function | //+------------------------------------------------------------------+ void OnTick() { // Copy the latest candlestick data into the arrays CopyOpen(_Symbol, time_frame, 1, bars_check, open_price); // Open prices CopyClose(_Symbol, time_frame, 1, bars_check, close_price); // Close prices CopyLow(_Symbol, time_frame, 1, bars_check, low_price); // Low prices CopyHigh(_Symbol, time_frame, 1, bars_check, high_price); // High prices CopyTime(_Symbol, time_frame, 1, bars_check, time_price); // Candle times }
解释:
要创建能够对图表形态做出反应的 EA,必须收集历史柱形数据。该代码将此信息存储在五个数组中:开盘价、收盘价、最高价、最低价和时间。这些数组是绘制趋势线和检测波动点的基础。 默认设置为 PERIOD_CURRENT 时,EA 将使用当前图表的时间周期。用户可以使用输入变量 time_frame 选择 EA 应该运行的时间周期(例如,M1、H1、D1)。bars_check 变量(在本例中设置为 500)决定了应该检查前面多少根烛形。因此,EA 会忽略当前正在形成的烛形,检索并检查最近 500 根已完成的烛形。
这些数组都是在 OnInit() 函数中使用 ArraySetAsSeries(..., true); 设置的。因为它会翻转数组顺序,所以这一步至关重要,因为它使索引 0 与最近完成的烛形相关联,索引 1 与它之前的烛形相关联,依此类推。这种索引编制方法从最近的价格走势开始,向前推算,符合交易者直观地分析图表的方式。
OnTick() 方法中是大部分数据检索发生的地方。该函数会在每次价格变动时激活,或者说,每当市场价格发生变化时激活。其中,EA 使用 CopyOpen、CopyClose、CopyHigh、CopyLow 和 CopyTime 将烛形数据提取到相应的数组中。第一个选项保证 EA 不会选择当前正在形成的烛形(因为它变化很快,不可靠,无法用于形态发现),第二个论点是选择的时间周期。获取的信息可以追溯到 bars_check 烛形。
3.2.识别上升趋势线
获取到柱形数据后,下一步就是寻找价格走势中的波动点。我们的首要目标是找到一条上升趋势线,这条趋势线通常出现在市场创下更高低点时。这意味着必须先找到两个合格的低点。为了帮助 EA 识别可能的看涨形态,例如沿着该上升支撑位的反弹或突破,这些波动低点将作为绘制上升趋势线的锚点。
示例:
// Timeframe to use for retrieving candlestick data (default is the current chart timeframe)
input ENUM_TIMEFRAMES time_frame = PERIOD_CURRENT;
// Input to enable or disable drawing of the ascending trend line (true = allow drawing)
input bool allow_uptrend = true;
// Number of candles to look back when identifying swing lows for drawing the trend line
input int LookbackBars = 5;

// Number of past bars (candlesticks) to check
int bars_check = 500;

// Arrays to store candlestick data
double close_price[];   // Stores close prices
double open_price[];    // Stores open prices
double low_price[];     // Stores low prices
double high_price[];    // Stores high prices
datetime time_price[];  // Stores time data for each candle

double first_low;           // Price value of the first identified swing low
datetime first_low_time;    // Time when the first swing low occurred

double second_low;          // Price value of the second identified swing low
datetime second_low_time;   // Time when the second swing low occurred

string up_trend = "Up Trend";  // Label used to name the ascending trend line object on the chart

long chart_id = ChartID();     // Stores the current chart ID for referencing during object creation or manipulation

//+------------------------------------------------------------------+
//| Expert initialization function                                   |
//+------------------------------------------------------------------+
int OnInit()
  {
// Set arrays as series so the newest bar is index 0 ( start from the latest bar)
   ArraySetAsSeries(close_price, true);
   ArraySetAsSeries(open_price, true);
   ArraySetAsSeries(low_price, true);
   ArraySetAsSeries(high_price, true);
   ArraySetAsSeries(time_price, true);

   return(INIT_SUCCEEDED);  // Signal that the EA initialized successfully
  }

//+------------------------------------------------------------------+
//| Expert deinitialization function                                 |
//+------------------------------------------------------------------+
void OnDeinit(const int reason)
  {

   ObjectsDeleteAll(chart_id);

  }

//+------------------------------------------------------------------+
//| Expert tick function                                             |
//+------------------------------------------------------------------+
void OnTick()
  {
// Copy the latest candlestick data into the arrays
   CopyOpen(_Symbol, time_frame, 1, bars_check, open_price);     // Open prices
   CopyClose(_Symbol, time_frame, 1, bars_check, close_price);   // Close prices
   CopyLow(_Symbol, time_frame, 1, bars_check, low_price);       // Low prices
   CopyHigh(_Symbol, time_frame, 1, bars_check, high_price);     // High prices
   CopyTime(_Symbol, time_frame, 1, bars_check, time_price);     // Candle times

// If the user allows drawing of ascending trend line
   if(allow_uptrend)
     {
      // First loop: Find the most recent swing low (first low)
      for(int i = LookbackBars; i < bars_check - LookbackBars; i++)
        {
         // Check if current point is a swing low
         if(IsSwingLow(low_price, i, LookbackBars))
           {
            // Store price and time of the first (latest) swing low
            first_low = low_price[i];
            first_low_time = time_price[i];
            break;  // Exit loop after finding the first swing low
           }
        }

      // Second loop: Find an earlier swing low that is lower than the first low
      for(int i = LookbackBars; i < bars_check - LookbackBars; i++)
        {
         // Check for earlier swing low that is lower and occurs before the first low
         if(IsSwingLow(low_price, i, LookbackBars) && low_price[i] < first_low && time_price[i] < first_low_time)
           {
            // Store price and time of the second (older) swing low
            second_low = low_price[i];
            second_low_time = time_price[i];
            break;  // Exit loop after finding the second swing low
           }
        }

      // Create an ascending trend line from the second low to the first low
      ObjectCreate(chart_id, up_trend, OBJ_TREND, 0, second_low_time, second_low, first_low_time, first_low);
      ObjectSetInteger(chart_id, up_trend, OBJPROP_TIMEFRAMES, OBJ_NO_PERIODS);  // Temporarily hide line on all timeframes

      // If the swing structure is valid (i.e., second low is lower than first)
      if(first_low > second_low && second_low > 0)
        {
         // Extend the trend line to the right
         ObjectSetInteger(chart_id, up_trend, OBJPROP_RAY_RIGHT, true);

         // Show the trend line on all timeframes
         ObjectSetInteger(chart_id, up_trend, OBJPROP_TIMEFRAMES, OBJ_ALL_PERIODS);

         // Set visual properties: color and thickness
         ObjectSetInteger(chart_id, up_trend, OBJPROP_COLOR, clrBlue);
         ObjectSetInteger(chart_id, up_trend, OBJPROP_WIDTH, 3);
        }
     }

  }

//+------------------------------------------------------------------+
//| FUNCTION FOR LOWS                                                |
//+------------------------------------------------------------------+
bool IsSwingLow(const double &low[], int index, int lookback)
  {

   for(int i = 1; i <= lookback; i++)
     {

      if(low[index] > low[index - i] || low[index] > low[index + i])
         return false;
     }
   return true;
  }
输出:

解释:
IsSwingLow 函数的目的是找到价格序列中的波动低点。它需要三个参数:一个低价数组 (low[])、该数组中的某个索引 (index) 以及一个回溯数,该回溯数指定要检查左右两侧的柱形数量。方法内部的 for 循环从 1 迭代到回溯值(lookback)。它将当前索引处的最低价与 index + i(右)和 index - i(左)处的最低价进行比较,每次迭代都如此。
如果当前低点高于任何附近的低点,则该函数返回 false,表示该点不是波动低点。如果当前低点低于回溯范围内所有附近的低点,则该函数返回 true,表示发现了波动低点。从本质上讲,它保证了指定索引的低点是一个局部最小值。也就是说,它是周围区域的最低点。
趋势线逻辑由两个基本输入控制。第一个参数 allow_uptrend 是一个布尔值,允许用户选择是否按升序绘制趋势线。如果设置为 true,则代码将尝试找到两个波动低点并创建连接它们的趋势线。LookbackBars 是第二个输入,它指定要检查某个点左右两侧的多少根烛形,以确定它是否是波动低点。IsSwingLow 函数使用相同的 lookback 值。波动低点要求会随着数值的降低而变得更加敏感,随着数值的升高而变得更加严格(需要更大的跌幅)。
在烛形数据中找到的最近两个波动低点的价格值分别存储在变量 first_low 和 second_low 中。发生此类波动低点的时间值分别存储在 first_low_time 和 second_low_time 中。接下来将使用这些时间-价格对绘制上升趋势线。当前图表的 ID 存储在 chart_id 中,趋势线对象的名称(一个简单的标签:“Up Trend”)存储在 up_trend 变量中。生成或更改趋势线等图形对象时,需要图表 ID 来确定合适的图表上下文。
当 allow_uptrend 为 true 时,EA 首先会寻找两个合格的波动低点。为了防止访问超出数组范围的元素,第一个 for 循环遍历 LookbackBars 到 bars_check - LookbackBars 之间的价格数据。为了确定每个点是否为波动低点,它使用了 IsSwingLow 函数。在确定最近的合格低点后,它会将价格和时间记录在 first_low 和 first_low_time 中,然后结束循环。
在识别出第一个低点之后,第二个 for 循环使用 IsSwingLow 继续沿同一方向扫描,但这次它增加了两个要求:第二个低点必须低于第一个低点,并且它必须比第一个低点出现得更早。找到这样的点后,它会将价格和时间存储在 second_low 和 second_low_time 中,然后跳出循环。为了创建上升趋势线,EA 必须首先发现一个更早的、更低的低点,然后再发现一个更新的、更高的低点,这是通过两步搜索来保证的。
然后,该代码在识别出两个波动低点后,使用 ObjectCreate 构建上升趋势线。该函数使用各自的时间戳,将图表的 second_low 和 first_low 连接起来。为了防止过早画线,首先使用 OBJ_NO_PERIODS 将其完全隐藏。在确认结构正确(first_low > second_low 并且 second_low > 0)之后,使用 OBJPROP_RAY_RIGHT 将线向右延伸,使其在时间上向前投射。OBJ_ALL_PERIODS 也用于使其可在所有时间周期内查看。
趋势线的颜色改为蓝色(clrBlue),宽度设置为 3 像素,以提高视觉清晰度。这些改进使趋势线从其他图表元素中脱颖而出,并使其在图表上易于识别。
3.3.识别下降趋势线
下一步是重复类似的步骤来定位和绘制下降趋势线,现在我们已经成功地运用了利用波动低点创建上升趋势线的理论。不过这一次,我们将重点关注价格波动的高点,而不是低点。波动高点是指价格点高于左右两侧预定数量的周围柱形时出现的局部最高点。
我们将开发一个函数来识别波动高点,遍历历史烛形以识别两个合格的高点(第二个高点低于第一个高点),然后绘制一条下降趋势线连接这两个点,就像我们绘制上升趋势线一样。由于这条线向下倾斜,它将指示下降趋势,并可能成为交易者想要卖出或预期价格会受到拒绝的阻力位。
示例:// Timeframe to use for retrieving candlestick data (default is the current chart timeframe) input ENUM_TIMEFRAMES time_frame = PERIOD_CURRENT; // Input to enable or disable drawing of the ascending trend line (true = allow drawing) input bool allow_uptrend = true; // Number of candles to look back when identifying swing lows for drawing the trend line input int LookbackBars = 5; // Input to enable or disable drawing of the descebding trend line (true = allow drawing) input bool allow_downtrend = true; // Number of past bars (candlesticks) to check int bars_check = 500; // Arrays to store candlestick data double close_price[]; // Stores close prices double open_price[]; // Stores open prices double low_price[]; // Stores low prices double high_price[]; // Stores high prices datetime time_price[]; // Stores time data for each candle double first_low; // Price value of the first identified swing low datetime first_low_time; // Time when the first swing low occurred double second_low; // Price value of the second identified swing low datetime second_low_time; // Time when the second swing low occurred string up_trend = "Up Trend"; // Label used to name the ascending trend line object on the chart long chart_id = ChartID(); // Stores the current chart ID for referencing during object creation or manipulation double first_high; // Price value of the first identified swing high (latest high) datetime first_high_time; // Time when the first swing high occurred double second_high; // Price value of the second identified swing high (older high) datetime second_high_time; // Time when the second swing high occurred string down_trend = "Down Trend"; // Label used to name the descending trend line object on the chart //+------------------------------------------------------------------+ //| Expert initialization function | //+------------------------------------------------------------------+ int OnInit() { // Set arrays as series so the newest bar is index 0 ( start from the latest bar) ArraySetAsSeries(close_price, true); ArraySetAsSeries(open_price, true); ArraySetAsSeries(low_price, true); ArraySetAsSeries(high_price, true); ArraySetAsSeries(time_price, true); return(INIT_SUCCEEDED); // Signal that the EA initialized successfully } //+------------------------------------------------------------------+ //| Expert deinitialization function | //+------------------------------------------------------------------+ void OnDeinit(const int reason) { ObjectsDeleteAll(chart_id); } //+------------------------------------------------------------------+ //| Expert tick function | //+------------------------------------------------------------------+ void OnTick() { // Copy the latest candlestick data into the arrays CopyOpen(_Symbol, time_frame, 1, bars_check, open_price); // Open prices CopyClose(_Symbol, time_frame, 1, bars_check, close_price); // Close prices CopyLow(_Symbol, time_frame, 1, bars_check, low_price); // Low prices CopyHigh(_Symbol, time_frame, 1, bars_check, high_price); // High prices CopyTime(_Symbol, time_frame, 1, bars_check, time_price); // Candle times // If the user allows drawing of ascending trend line if(allow_uptrend) { // First loop: Find the most recent swing low (first low) for(int i = LookbackBars; i < bars_check - LookbackBars; i++) { // Check if current point is a swing low if(IsSwingLow(low_price, i, LookbackBars)) { // Store price and time of the first (latest) swing low first_low = low_price[i]; first_low_time = time_price[i]; break; // Exit loop after finding the first swing low } } // Second loop: Find an earlier swing low that is lower than the first low for(int i = LookbackBars; i < bars_check - LookbackBars; i++) { // Check for earlier swing low that is lower and occurs before the first low if(IsSwingLow(low_price, i, LookbackBars) && low_price[i] < first_low && time_price[i] < first_low_time) { // Store price and time of the second (older) swing low second_low = low_price[i]; second_low_time = time_price[i]; break; // Exit loop after finding the second swing low } } // Create an ascending trend line from the second low to the first low ObjectCreate(chart_id, up_trend, OBJ_TREND, 0, second_low_time, second_low, first_low_time, first_low); ObjectSetInteger(chart_id, up_trend, OBJPROP_TIMEFRAMES, OBJ_NO_PERIODS); // Temporarily hide line on all timeframes // If the swing structure is valid (i.e., second low is lower than first) if(first_low > second_low && second_low > 0) { // Extend the trend line to the right ObjectSetInteger(chart_id, up_trend, OBJPROP_RAY_RIGHT, true); // Show the trend line on all timeframes ObjectSetInteger(chart_id, up_trend, OBJPROP_TIMEFRAMES, OBJ_ALL_PERIODS); // Set visual properties: color and thickness ObjectSetInteger(chart_id, up_trend, OBJPROP_COLOR, clrBlue); ObjectSetInteger(chart_id, up_trend, OBJPROP_WIDTH, 3); } } // // Only proceed if drawing descending trend lines is enabled if(allow_downtrend) { // First loop: Find the most recent swing high (first high) for(int i = LookbackBars; i < bars_check - LookbackBars; i++) { // Check if the current bar is a swing high if(IsSwingHigh(high_price, i, LookbackBars)) { // Store the price and time of this latest swing high first_high = high_price[i]; first_high_time = time_price[i]; break; // Exit loop once the first swing high is found } } // Second loop: Find an earlier swing high that is higher than the first high and occurred before it for(int i = LookbackBars; i < bars_check - LookbackBars; i++) { // Check for earlier swing high that is higher and happened before the first one if(IsSwingHigh(high_price, i, LookbackBars) && high_price[i] > first_high && time_price[i] < first_high_time) { // Store the price and time of this older swing high second_high = high_price[i]; second_high_time = time_price[i]; break; // Exit loop once the second swing high is found } } // Create a trend line object from the second swing high to the first swing high ObjectCreate(chart_id, down_trend, OBJ_TREND, 0, second_high_time, second_high, first_high_time, first_high); // Initially hide the trend line across all timeframes to avoid partial drawing ObjectSetInteger(chart_id, down_trend, OBJPROP_TIMEFRAMES, OBJ_NO_PERIODS); // Validate the swing structure: // The older swing high should be higher than the later swing high to confirm a descending trend line if(first_high < second_high && second_high > 0) { // Extend the trend line indefinitely to the right for better visual guidance ObjectSetInteger(chart_id, down_trend, OBJPROP_RAY_RIGHT, true); // Make the trend line visible on all chart timeframes ObjectSetInteger(chart_id, down_trend, OBJPROP_TIMEFRAMES, OBJ_ALL_PERIODS); // Set the trend line color to dark green for clear distinction ObjectSetInteger(chart_id, down_trend, OBJPROP_COLOR, clrDarkGreen); // Set the thickness of the trend line to 3 pixels for better visibility ObjectSetInteger(chart_id, down_trend, OBJPROP_WIDTH, 3); } } } //+------------------------------------------------------------------+ //| FUNCTION FOR LOWS | //+------------------------------------------------------------------+ bool IsSwingLow(const double &low[], int index, int lookback) { for(int i = 1; i <= lookback; i++) { if(low[index] > low[index - i] || low[index] > low[index + i]) return false; } return true; } //+------------------------------------------------------------------+ //| FUNCTION FOR HIGHS | //+------------------------------------------------------------------+ bool IsSwingHigh(const double &high[], int index, int lookback) { for(int i = 1; i <= lookback; i++) { if(high[index] < high[index - i] || high[index] < high[index + i]) return false; } return true; }
输出:

解释:
IsSwingHigh 函数通过将一根柱形的最高价格与预定回溯期内附近柱子的最高价格进行比较,来确定给定的柱形是否为波动高点。如果柱形的最高点大于任何一个相邻柱形的最高点,则返回 true,确认存在局部峰值;否则,返回 false。可以使用输入变量 allow_downtrend 来绘制或禁用图表上的下降趋势线。
代码首先查找最近的高点(或 first_high),并记录其价格和时间,以确定下降趋势线。然后它会寻找早于第一个高点且更高的第二个高点(second_high)。因此,连接这两个地方的趋势线被称为“Down Trend”。 当最近的波动高点低于前一个高点时,下降趋势线变得清晰,证实了下降趋势。它连接较低的高点,采用醒目的样式,并在图表上向前延伸。这种逻辑本质上与上升趋势线相反,上升趋势线将更高的低点连接起来,显示上升趋势。
4.基于趋势线突破和反转执行交易
我们在上一章讨论了如何使用价格图表的重要波动点,以编程方式构建上升趋势线和下降趋势线。在此基础上,本章将讨论如何根据趋势线突破和反转执行交易。我们将重点研究如何识别价格何时突破某些趋势线或反转走势,以及如何利用这些指标有效地进场或退出交易。
4.1.上升趋势线
到目前为止,我们只专注于确定第一和第二个波动低点,以构建上升趋势线。但是,我们如何确定市场何时突破并可能重新测试趋势线,或者何时触及趋势线并反转呢?要根据价格与趋势线的互动情况来制定交易决策,这一阶段至关重要。得益于内置函数,我们可以获取任何给定时间或柱形索引的趋势线价格水平,MQL5 简化了这一过程。
为了做出更明智的交易决策,本节将介绍如何识别价格何时接近或穿过上升趋势线。我们将探讨 MQL5 提供的工具,无论您是想捕捉支撑位反弹还是突破和回测入场点。我们将重点分析图表上的最后四根柱形,因为突破和反转通常发生在最近的柱形中。在大多数情况下,这些最近的柱形图将显示趋势线是否被突破或得到维持。
因此,我们将仔细检查最近的四根柱形是否满足突破或反转的要求,而不是查看完整的图表历史记录。我们可以通过这种策略对新的市场走势做出反应,并做出明智的交易决策。在接下来的部分中,我们将使用 MQL5 以编程方式实现这一推理。
示例:double t_line_value; // Ascending trend line price level at the time of the most recent bar (not the ticking bar) double t1_line_value; // Ascending trend line price level at the time of the second most recent bar double t2_line_value; // Ascending trend line price level at the time of the third most recent bar double t3_line_value; // Ascending trend line price level at the time of the fourth most recent bar
if(allow_uptrend)
  {
// First loop: Find the most recent swing low (first low)
   for(int i = LookbackBars; i < bars_check - LookbackBars; i++)
     {
      // Check if current point is a swing low
      if(IsSwingLow(low_price, i, LookbackBars))
        {
         // Store price and time of the first (latest) swing low
         first_low = low_price[i];
         first_low_time = time_price[i];
         break;  // Exit loop after finding the first swing low
        }
     }

// Second loop: Find an earlier swing low that is lower than the first low
   for(int i = LookbackBars; i < bars_check - LookbackBars; i++)
     {
      // Check for earlier swing low that is lower and occurs before the first low
      if(IsSwingLow(low_price, i, LookbackBars) && low_price[i] < first_low && time_price[i] < first_low_time)
        {
         // Store price and time of the second (older) swing low
         second_low = low_price[i];
         second_low_time = time_price[i];
         break;  // Exit loop after finding the second swing low
        }
     }

// Create an ascending trend line from the second low to the first low
   ObjectCreate(chart_id, up_trend, OBJ_TREND, 0, second_low_time, second_low, first_low_time, first_low);
   ObjectSetInteger(chart_id, up_trend, OBJPROP_TIMEFRAMES, OBJ_NO_PERIODS);  // Temporarily hide line on all timeframes

// If the swing structure is valid (i.e., second low is lower than first)
   if(first_low > second_low && second_low > 0)
     {
      // Extend the trend line to the right
      ObjectSetInteger(chart_id, up_trend, OBJPROP_RAY_RIGHT, true);

      // Show the trend line on all timeframes
      ObjectSetInteger(chart_id, up_trend, OBJPROP_TIMEFRAMES, OBJ_ALL_PERIODS);

      // Set visual properties: color and thickness
      ObjectSetInteger(chart_id, up_trend, OBJPROP_COLOR, clrBlue);
      ObjectSetInteger(chart_id, up_trend, OBJPROP_WIDTH, 3);


      // Get the price values of the trend line at the corresponding times of the four most recent bars
      t_line_value = ObjectGetValueByTime(chart_id, up_trend, time_price[0], 0);   // Current bar
      t1_line_value = ObjectGetValueByTime(chart_id, up_trend, time_price[1], 0);  // One bar ago
      t2_line_value = ObjectGetValueByTime(chart_id, up_trend, time_price[2], 0);  // Two bars ago
      t3_line_value = ObjectGetValueByTime(chart_id, up_trend, time_price[3], 0);  // Three bars ago

      Comment("Ascending trend tine value for the last 4 Bars",
              "\nBar 0: ",  DoubleToString(t_line_value, _Digits),
              "\nBar 1: ", DoubleToString(t1_line_value, _Digits),
              "\nBar 2: ",  DoubleToString(t2_line_value, _Digits),
              "\nBar 3: ",  DoubleToString(t3_line_value, _Digits));

     }
  }
输出:

解释:
ObjectGetValueByTime() 函数用于获取指定图表对象(在本例中为趋势线)在特定时间的价格水平,从而获取趋势线的值。这样我们就可以确定最近每根柱形关闭时的趋势线位置。
为此,我们采用了四个不同的变量。趋势线在第 0 根柱(即最近完成的柱,而不是正在积极构建的柱(通常称为 “ticking bar”))处的值存储在变量 t_line_value 中。第 1 根柱(或紧邻最新一根柱的前一根柱)的趋势线水平存储在变量 t1_line_value 中。第 2 根和第 3 根柱的趋势线值分别反映出两个和三个周期前收盘的柱线值,它们分别存储在 t2_line_value 和 t3_line_value 中。
需要注意的是,尽管我们将 time_price[0] 称为“第 0 柱”,但它实际上在图表上显示为从右数第二个柱。这是因为我们在分析中不使用最右边的最后一根柱,因为它仍在上涨,尚未收盘。我们在代码前面使用 CopyTime() 函数的方式,从索引 1 开始复制,跳过当前(未关闭的)柱以获得更可靠的数据,也与这种形态一致。 为了便于审查或调试,代码使用 Comment() 函数将这些趋势线值直接打印到图表上。此输出结果可让您观察趋势线相对于最新柱形的变化情况,并显示在图表窗口的左上角区域。它对于判断趋势线是突破点还是反转点尤其有帮助。
4.1.1.上升趋势线交易执行
下一步是提供决定何时执行交易的逻辑,无论是突破还是反转,现在我们已经知道如何精确提取最近关闭的柱形的趋势线值。现在,我们可以通过将最近几根柱形的趋势线值与实际价格走势(例如柱形收盘价或最低价/最高价)进行比较,来确定趋势线正在发生什么。
4.1.1.1.反转
现在,我们需要具体说明如何根据反转信号进行交易的逻辑,因为我们现在知道如何获得不同柱形时间点的趋势线价格值。为了确定市场是否遵循了趋势线并正在逆转,将当前柱形价格与相应的趋势线值进行比较。 即使这个概念看起来很简单,也要留意趋势线附近的反弹。准确地实现起来可能有点困难。反转可以有多种结构,而且往往很微妙。有时,烛形的整个实体可能会落在趋势线上;而有时,烛形可能只是沿着趋势线走,并在趋势线上方收盘。有时价格甚至会跌破某个水平,然后剧烈反弹,这种现象被称为假突破。
由于这些差异,准确识别真正反转所需的参数可能会变得复杂。除了当前烛形的位置之外,还应该考虑几根烛形与趋势线的相互作用方式。这可能包括使用看涨烛形等辅助指标进行验证,确保没有大幅收盘价低于趋势线,并查看最近烛形的低点是否触及或反弹该线。为了最大限度地减少错误信号,这些分层条件需要仔细的编程逻辑,并且使使用趋势线进行反转检测变得更加复杂。
以下是一些有效的反转条件:
上升趋势线处的影线拒绝和看涨反转: 
正如你所看到的,烛形在只有影线触及上升趋势线后立即向上反转。这证明,当价格挑战作为支撑的趋势线时,很快就遭到了拒绝。这一反转趋势还得到了以下事实的支持:同一根柱形后来收盘时变成了一根阳线。因为它显示买家在关键支撑位有强烈的反应,这种影线与趋势线相互作用,但实体却急剧朝相反方向收盘的价格走势,是进行买入交易的合理要求。
阴线触及下影线后,紧接着出现阳线确认:

上图中,一根阴线的影线触及了上升趋势线,并且该根阴线的收盘价高于该趋势线。然而,由于这根蜡烛是阴线,因此并不能立即满足反转入场的需求,紧随其后的阳线提供了确认。这根阳线是执行买入交易的合格条件,因为它表明买家在触及趋势线后已经入场。要验证反转,必须出现一根阳线。
多次下跌收盘后才会确认出现看涨反转:

当阴线的影线触及上升趋势线时,阴线收盘价即高于上升趋势线。尽管也是看跌的,但下一根柱形收盘价高于趋势线。直到第三根柱形才形成符合反转入场条件的看涨柱形。市场遵循趋势线,但多头用了几根柱形才占据主导地位,正如这组柱形所示。最后一根阳线确认了可能的买入交易。
假突破反转,随后立即出现看涨确认: 
第一个触及上升趋势线的柱形收盘价低于该趋势线,这可能预示着一个潜在的突破。然而,随后出现的柱形是一根强劲的阳线,收盘价高于趋势线。这种迅速反应至关重要,因为触及之后立即出现的看涨柱形支持了反转。市场仍将趋势线视为支撑,即时看涨反应证明了这一点,尽管有短暂的收盘价低于趋势线。因此,这是一个合格的买入交易设置。
有一些特殊情况会使趋势线反转无效,正如有很多情况会使趋势线反转合理一样。由于这些不正确的情况,我们可以避开糟糕的交易和错误的警报。它们对于防止在短时间内执行由类似或重复信号提示的几笔交易也至关重要。这使我们能够保持稳健的策略,防止过度交易。
确认突破后无效反转:

上升趋势线已被两根阴线穿过,即使最终收于趋势线之上,阳线也不再被视为有效的反转指标。由于结构已经被突破,因此突破被视为已确认。任何进一步的上涨行情都被视为噪音或可能的重新测试,不被视为合格的入场时机。
防止在多次反转中出现重复交易信号:

上图中的三根阳线,每根都有一根影线在向上反转之前触及上升趋势线。即使所有交易都属于同一大反转行情的一部分,但如果没有合适的条件来过滤这些形态,算法可能会对每一次触碰执行多次交易。在这种情况下,至关重要的是要建立一种逻辑,将交易执行限制在第一个有效信号上。
你的逻辑需要进行彻底的审查和考虑,以应用于这种情况以及其他一些类似情况。如果处理不当,可能会导致入场延迟、重复交易或发出错误信号。除了验证合格的反转情况外,还必须制定严格的验证要求,以避免在信号密集时进行不必要的或重复的交易执行。
示例:
#include <Trade/Trade.mqh>
CTrade trade;
int MagicNumber = 532127;


// Timeframe to use for retrieving candlestick data (default is the current chart timeframe)
input ENUM_TIMEFRAMES time_frame = PERIOD_CURRENT;
// Input to enable or disable drawing of the ascending trend line (true = allow drawing)
input bool allow_uptrend = true;
// Number of candles to look back when identifying swing lows for drawing the trend line
input int LookbackBars = 5;

// Input to enable or disable drawing of the descebding trend line (true = allow drawing)
input bool allow_downtrend = true;
input bool allow_break_out = true;    // Enable or disable trade execution on trend line breakout (true = allow)
input bool allow_reversal = true;     // Enable or disable trade execution on trend line reversal (true = allow)
input double lot_size = 0.6;          // Lot size for each trade
input double sl_points = 10;          // Stop Loss in points from entry price
input double tp_points = 50;          // Take Profit in points from entry price

// Number of past bars (candlesticks) to check
int bars_check = 500;

// Arrays to store candlestick data
double close_price[];   // Stores close prices
double open_price[];    // Stores open prices
double low_price[];     // Stores low prices
double high_price[];    // Stores high prices
datetime time_price[];  // Stores time data for each candle

double first_low;           // Price value of the first identified swing low
datetime first_low_time;    // Time when the first swing low occurred

double second_low;          // Price value of the second identified swing low
datetime second_low_time;   // Time when the second swing low occurred
string up_trend = "Up Trend";  // Label used to name the ascending trend line object on the chart
long chart_id = ChartID();     // Stores the current chart ID for referencing during object creation or manipulation
double first_high;          // Price value of the first identified swing high (latest high)
datetime first_high_time;   // Time when the first swing high occurred
double second_high;         // Price value of the second identified swing high (older high)
datetime second_high_time;  // Time when the second swing high occurred
string down_trend = "Down Trend";  // Label used to name the descending trend line object on the chart
double t_line_value;   // Ascending trend line price level at the time of the most recent bar (not the ticking bar)
double t1_line_value;  // Ascending trend line price level at the time of the second most recent bar
double t2_line_value;  // Ascending trend line price level at the time of the third most recent bar
double t3_line_value;  // Ascending trend line price level at the time of the fourth most recent bar

// Time boundary used to limit lookback for valid reversal setups
datetime lookbackf_time;

datetime lastTradeBarTime = 0;

//+------------------------------------------------------------------+
//| Expert initialization function                                   |
//+------------------------------------------------------------------+
int OnInit()
  {
// Set arrays as series so the newest bar is index 0 ( start from the latest bar)
   ArraySetAsSeries(close_price, true);
   ArraySetAsSeries(open_price, true);
   ArraySetAsSeries(low_price, true);
   ArraySetAsSeries(high_price, true);
   ArraySetAsSeries(time_price, true);

   trade.SetExpertMagicNumber(MagicNumber);

   return(INIT_SUCCEEDED);  // Signal that the EA initialized successfully
  }

//+------------------------------------------------------------------+
//| Expert deinitialization function                                 |
//+------------------------------------------------------------------+
void OnDeinit(const int reason)
  {

   ObjectsDeleteAll(chart_id);

  }

//+------------------------------------------------------------------+
//| Expert tick function                                             |
//+------------------------------------------------------------------+
void OnTick()
  {
// Copy the latest candlestick data into the arrays
   CopyOpen(_Symbol, time_frame, 1, bars_check, open_price);     // Open prices
   CopyClose(_Symbol, time_frame, 1, bars_check, close_price);   // Close prices
   CopyLow(_Symbol, time_frame, 1, bars_check, low_price);       // Low prices
   CopyHigh(_Symbol, time_frame, 1, bars_check, high_price);     // High prices
   CopyTime(_Symbol, time_frame, 1, bars_check, time_price);     // Candle times

   double ask_price = SymbolInfoDouble(_Symbol,SYMBOL_ASK);
   datetime currentBarTime = iTime(_Symbol, time_frame, 0);

// If the user allows drawing of ascending trend line
   if(allow_uptrend)
     {
      // First loop: Find the most recent swing low (first low)
      for(int i = LookbackBars; i < bars_check - LookbackBars; i++)
        {
         // Check if current point is a swing low
         if(IsSwingLow(low_price, i, LookbackBars))
           {
            // Store price and time of the first (latest) swing low
            first_low = low_price[i];
            first_low_time = time_price[i];
            lookbackf_time = time_price[i - 3];

            break;  // Exit loop after finding the first swing low
           }
        }

      // Second loop: Find an earlier swing low that is lower than the first low
      for(int i = LookbackBars; i < bars_check - LookbackBars; i++)
        {
         // Check for earlier swing low that is lower and occurs before the first low
         if(IsSwingLow(low_price, i, LookbackBars) && low_price[i] < first_low && time_price[i] < first_low_time)
           {
            // Store price and time of the second (older) swing low
            second_low = low_price[i];
            second_low_time = time_price[i];
            break;  // Exit loop after finding the second swing low
           }
        }

      // Create an ascending trend line from the second low to the first low
      ObjectCreate(chart_id, up_trend, OBJ_TREND, 0, second_low_time, second_low, first_low_time, first_low);
      ObjectSetInteger(chart_id, up_trend, OBJPROP_TIMEFRAMES, OBJ_NO_PERIODS);  // Temporarily hide line on all timeframes

      // If the swing structure is valid (i.e., second low is lower than first)
      if(first_low > second_low && second_low > 0)
        {
         // Extend the trend line to the right
         ObjectSetInteger(chart_id, up_trend, OBJPROP_RAY_RIGHT, true);

         // Show the trend line on all timeframes
         ObjectSetInteger(chart_id, up_trend, OBJPROP_TIMEFRAMES, OBJ_ALL_PERIODS);

         // Set visual properties: color and thickness
         ObjectSetInteger(chart_id, up_trend, OBJPROP_COLOR, clrBlue);
         ObjectSetInteger(chart_id, up_trend, OBJPROP_WIDTH, 3);

         // Get the price values of the trend line at the corresponding times of the four most recent bars
         t_line_value = ObjectGetValueByTime(chart_id, up_trend, time_price[0], 0);   // Current bar
         t1_line_value = ObjectGetValueByTime(chart_id, up_trend, time_price[1], 0);  // One bar ago
         t2_line_value = ObjectGetValueByTime(chart_id, up_trend, time_price[2], 0);  // Two bars ago
         t3_line_value = ObjectGetValueByTime(chart_id, up_trend, time_price[3], 0);  // Three bars ago

         // Number of bars between the valid bullish confirmation candle and current time
         int no_bars = 0;

         // Loop through the last 4 bars to check for reversal wick touch on the trend line
         for(int i = 0; i <= 3; i++)
           {
            // Condition: Wick of the candle touches below the trend line but opens above it (indicating a potential reversal zone)
            if(low_price[i] < ObjectGetValueByTime(chart_id, up_trend, time_price[i], 0) &&
               open_price[i] > ObjectGetValueByTime(chart_id, up_trend, time_price[i], 0))
              {
               // Check if there's a bullish confirmation candle after the wick touch (within or immediately after)
               for(int j = i; j >= 0; j--)
                 {
                  // Bullish candle that closed above the trend line
                  if(close_price[j] > open_price[j] &&
                     close_price[j] > ObjectGetValueByTime(chart_id, up_trend, time_price[j], 0))
                    {
                     // Count how many bars ago this confirmation occurred
                     no_bars = Bars(_Symbol, time_frame, time_price[j], TimeCurrent());
                     break;
                    }
                 }
               break; // Exit after first valid reversal zone is found
              }
           }

         // Check whether a similar wick touch (reversal) happened recently to avoid repeated signals
         bool prev_touch = false;

         if((low_price[1] < t1_line_value && close_price[1] > open_price[1]) ||  // Bar 1 had reversal wick and bullish body
            (low_price[2] < t2_line_value && close_price[2] > open_price[2]))    // Bar 2 had reversal wick and bullish body
           {
            prev_touch = true;  // Flag that a recent touch already occurred
           }

         // Final condition for executing a BUY trade on a reversal setup
         if(
            // One of the recent 4 bars touched and rejected the trend line (wick below, open above), AND
            ((low_price[0] < t_line_value && open_price[0] > t_line_value) ||
             (low_price[1] < t1_line_value && open_price[1] > t1_line_value) ||
             (low_price[2] < t2_line_value && open_price[2] > t2_line_value) ||
             (low_price[3] < t3_line_value && open_price[3] > t3_line_value))
            &&
            // Current candle must be bullish and close above the trend line
            (close_price[0] > open_price[0]) && close_price[0] > t_line_value
            &&
            // The bullish confirmation must occur within 3 bars
            (no_bars < 3)
            &&
            // No recent wick reversal signal already processed
            prev_touch == false
            &&
            // The signal must be more recent than the lookback time threshold
            (time_price[3] > lookbackf_time)
            &&
            // Reversal signals are allowed and this signal is not duplicated from the same bar
            (allow_reversal == true && currentBarTime != lastTradeBarTime)
         )
           {
            // Execute BUY trade with defined lot size, SL and TP
            trade.Buy(lot_size, _Symbol, ask_price, ask_price - sl_points, ask_price + tp_points);
            lastTradeBarTime = currentBarTime; // Update last trade bar time to avoid duplicate signals
           }
        }
     }

//
// Only proceed if drawing descending trend lines is enabled
   if(allow_downtrend)
     {
      // First loop: Find the most recent swing high (first high)
      for(int i = LookbackBars; i < bars_check - LookbackBars; i++)
        {
         // Check if the current bar is a swing high
         if(IsSwingHigh(high_price, i, LookbackBars))
           {
            // Store the price and time of this latest swing high
            first_high = high_price[i];
            first_high_time = time_price[i];

            break;  // Exit loop once the first swing high is found
           }
        }

      // Second loop: Find an earlier swing high that is higher than the first high and occurred before it
      for(int i = LookbackBars; i < bars_check - LookbackBars; i++)
        {
         // Check for earlier swing high that is higher and happened before the first one
         if(IsSwingHigh(high_price, i, LookbackBars) && high_price[i] > first_high && time_price[i] < first_high_time)
           {
            // Store the price and time of this older swing high
            second_high = high_price[i];
            second_high_time = time_price[i];

            break;  // Exit loop once the second swing high is found
           }
        }

      // Create a trend line object from the second swing high to the first swing high
      ObjectCreate(chart_id, down_trend, OBJ_TREND, 0, second_high_time, second_high, first_high_time, first_high);

      // Initially hide the trend line across all timeframes to avoid partial drawing
      ObjectSetInteger(chart_id, down_trend, OBJPROP_TIMEFRAMES, OBJ_NO_PERIODS);

      // Validate the swing structure:
      // The older swing high should be higher than the later swing high to confirm a descending trend line
      if(first_high < second_high && second_high > 0)
        {
         // Extend the trend line indefinitely to the right for better visual guidance
         ObjectSetInteger(chart_id, down_trend, OBJPROP_RAY_RIGHT, true);

         // Make the trend line visible on all chart timeframes
         ObjectSetInteger(chart_id, down_trend, OBJPROP_TIMEFRAMES, OBJ_ALL_PERIODS);

         // Set the trend line color to dark green for clear distinction
         ObjectSetInteger(chart_id, down_trend, OBJPROP_COLOR, clrDarkGreen);

         // Set the thickness of the trend line to 3 pixels for better visibility
         ObjectSetInteger(chart_id, down_trend, OBJPROP_WIDTH, 3);

        }
     }
  }

//+------------------------------------------------------------------+
//| FUNCTION FOR LOWS                                                |
//+------------------------------------------------------------------+
bool IsSwingLow(const double &low[], int index, int lookback)
  {

   for(int i = 1; i <= lookback; i++)
     {

      if(low[index] > low[index - i] || low[index] > low[index + i])
         return false;
     }
   return true;
  }

//+------------------------------------------------------------------+
//| FUNCTION FOR HIGHS                                               |
//+------------------------------------------------------------------+
bool IsSwingHigh(const double &high[], int index, int lookback)
  {

   for(int i = 1; i <= lookback; i++)
     {
      if(high[index] < high[index - i] || high[index] < high[index + i])
         return false;
     }
   return true;
  }
输出:


解释:
要访问用于在 MQL5 中进行和管理交易的 CTrade 类,代码首先包含交易库 Trade.mqh。就像 Buy() 和 Sell() 执行交易操作一样,会构造一个名为 trade 的 CTrade 对象。为了区分此特定 EA 交易执行的交易与其他交易,计算机为该 EA 交易分配一个唯一的幻数(MagicNumber)。SetExpertMagicNumber() 用于设置此值。
然后指定若干输入参数。这些功能允许用户在不更改主代码的情况下改变 EA 的行为。例如,为了规范是否允许在下跌趋势、突破形态或反转形态下进行交易,可以开关 allow_downtrend、allow_break_out 和 allow_reversal。sl_points 和 tp_points 指定止损点和止盈点与入场价之间的点数距离,而 lot_size 参数则确定每个仓位的大小。
为了进行时机控制,使用了两个变量:lookbackf_time 和 lastTradeBarTime。软件应该回溯搜索合法逆向配置的时间长短由 lookbackf_time 决定。此时之前的任何配置都将被忽略。为了帮助消除冗余或重复的信号,使用 lastTradeBarTime 变量来防止对同一根烛形进行多次交易。
int no_bars = 0;
for(int i = 0; i <= 3; i++)
  {
   if(low_price[i] < ObjectGetValueByTime(chart_id, up_trend, time_price[i], 0) &&
      open_price[i] > ObjectGetValueByTime(chart_id, up_trend, time_price[i], 0))
     {
      for(int j = i; j >= 0; j--)
        {
         if(close_price[j] > open_price[j] &&
            close_price[j] > ObjectGetValueByTime(chart_id, up_trend, time_price[j], 0))
           {
            no_bars = Bars(_Symbol, time_frame, time_price[j], TimeCurrent());
            break;
           }
        }
      break;
     }
  }
本部分扫描了最新的四根烛形(第 0 至 3 根烛形),以查看其中是否有任何蜡烛显示出影线行为,从而发出反转信号:最低价跌破趋势线,但开盘价保持在趋势线上方。这意味着趋势线已被否定。一旦识别出这样的烛形,内部循环就会寻找看涨确认烛形,即收盘价高于开盘价和趋势线的烛形。如果找到,则使用 Bars() 函数确定确认发生在多少根柱之前,并将结果保存在 no_bars 中。
bool prev_touch = false;
if((low_price[1] < t1_line_value && close_price[1] > open_price[1]) ||
   (low_price[2] < t2_line_value && close_price[2] > open_price[2])) {
    prev_touch = true;
}
该模块用于确定第 1 根柱或第 2 根柱是否已经触及趋势线并收于阳线,以防止重复或过早发出警告。如果两个条件中的任何一个为 true,则 Prev_touch 设置为 true,这表明最近可能发生过反转,并且应该忽略当前柱上的另一个信号。
if(
   ((low_price[0] < t_line_value && open_price[0] > t_line_value) ||
    (low_price[1] < t1_line_value && open_price[1] > t1_line_value) ||
    (low_price[2] < t2_line_value && open_price[2] > t2_line_value) ||
    (low_price[3] < t3_line_value && open_price[3] > t3_line_value))
   &&
   (close_price[0] > open_price[0]) && close_price[0] > t_line_value
   &&
   (no_bars < 3)
   &&
   prev_touch == false
   &&
   (time_price[3] > lookbackf_time)
   &&
   (allow_reversal == true && currentBarTime != lastTradeBarTime)
)
  {
   trade.Buy(lot_size, _Symbol, ask_price, ask_price - sl_points, ask_price + tp_points);
   lastTradeBarTime = currentBarTime;
  }
首先,它验证最近四根柱中至少有一根出现了影线行为,即价格触及趋势线但开盘价高于趋势线,这表明可能存在一个阻力区;然后,它要求当前柱为阳线且收盘价高于趋势线,从而加强信号;最后,它要求之前识别出的阳线确认柱形出现在最近三根柱内,以确保该设置仍然有效。该条件块通过检查一些重要标准来验证是否应该执行反转买入交易。
该算法验证最近是否检测到类似的基于影线的触碰信号,因此 prev_touch 必须为 false 以防止重复输入。此外,它还确保设置比提供的 lookbackf_time 更新,从而限制程序接受的合格信号范围。
最后,通过验证 currentBarTime 不等于 lastTradeBarTime,可以防止重复交易,并验证是否允许反转交易(allow_reversal 为 true),以及是否已在同一根烛形上进行过交易。如果满足所有要求,则会执行指定手数、止损价和止盈价的买入订单。为了防止在同一根柱上进行更多交易,lastTradeBarTime 会更新为当前柱的时间。
4.1.1.2.突破和重新测试
围绕上升趋势线的突破和回测设置遵循与反转类似的下单标准。价格跌破趋势线后,可能会回落重新测试已失效的支撑位(该支撑位目前已转化为阻力位)。一根完整的柱形,或者仅仅是一根影线触及趋势线,都可能触发这种回测。如果回测成功且价格被拒绝,则可以通过下卖单来确认突破。

示例:
// If the user allows drawing of ascending trend line
if(allow_uptrend)
  {
// First loop: Find the most recent swing low (first low)
   for(int i = LookbackBars; i < bars_check - LookbackBars; i++)
     {
      // Check if current point is a swing low
      if(IsSwingLow(low_price, i, LookbackBars))
        {
         // Store price and time of the first (latest) swing low
         first_low = low_price[i];
         first_low_time = time_price[i];
         lookbackf_time = time_price[i - 3];

         break;  // Exit loop after finding the first swing low
        }
     }

// Second loop: Find an earlier swing low that is lower than the first low
   for(int i = LookbackBars; i < bars_check - LookbackBars; i++)
     {
      // Check for earlier swing low that is lower and occurs before the first low
      if(IsSwingLow(low_price, i, LookbackBars) && low_price[i] < first_low && time_price[i] < first_low_time)
        {
         // Store price and time of the second (older) swing low
         second_low = low_price[i];
         second_low_time = time_price[i];
         break;  // Exit loop after finding the second swing low
        }
     }

// Create an ascending trend line from the second low to the first low
   ObjectCreate(chart_id, up_trend, OBJ_TREND, 0, second_low_time, second_low, first_low_time, first_low);
   ObjectSetInteger(chart_id, up_trend, OBJPROP_TIMEFRAMES, OBJ_NO_PERIODS);  // Temporarily hide line on all timeframes

// If the swing structure is valid (i.e., second low is lower than first)
   if(first_low > second_low && second_low > 0)
     {
      // Extend the trend line to the right
      ObjectSetInteger(chart_id, up_trend, OBJPROP_RAY_RIGHT, true);

      // Show the trend line on all timeframes
      ObjectSetInteger(chart_id, up_trend, OBJPROP_TIMEFRAMES, OBJ_ALL_PERIODS);

      // Set visual properties: color and thickness
      ObjectSetInteger(chart_id, up_trend, OBJPROP_COLOR, clrBlue);
      ObjectSetInteger(chart_id, up_trend, OBJPROP_WIDTH, 3);


      // Get the price values of the trend line at the corresponding times of the four most recent bars
      t_line_value = ObjectGetValueByTime(chart_id, up_trend, time_price[0], 0);   // Current bar
      t1_line_value = ObjectGetValueByTime(chart_id, up_trend, time_price[1], 0);  // One bar ago
      t2_line_value = ObjectGetValueByTime(chart_id, up_trend, time_price[2], 0);  // Two bars ago
      t3_line_value = ObjectGetValueByTime(chart_id, up_trend, time_price[3], 0);  // Three bars ago

      // Number of bars between the valid bullish confirmation candle and current time
      int no_bars = 0;

      // Loop through the last 4 bars to check for reversal wick touch on the trend line
      for(int i = 0; i <= 3; i++)
        {
         // Condition: Wick of the candle touches below the trend line but opens above it (indicating a potential reversal zone)
         if(low_price[i] < ObjectGetValueByTime(chart_id, up_trend, time_price[i], 0) &&
            open_price[i] > ObjectGetValueByTime(chart_id, up_trend, time_price[i], 0))
           {
            // Check if there's a bullish confirmation candle after the wick touch (within or immediately after)
            for(int j = i; j >= 0; j--)
              {
               // Bullish candle that closed above the trend line
               if(close_price[j] > open_price[j] &&
                  close_price[j] > ObjectGetValueByTime(chart_id, up_trend, time_price[j], 0))
                 {
                  // Count how many bars ago this confirmation occurred
                  no_bars = Bars(_Symbol, time_frame, time_price[j], TimeCurrent());
                  break;
                 }
              }
            break; // Exit after first valid reversal zone is found
           }
        }

      // Check whether a similar wick touch (reversal) happened recently to avoid repeated signals
      bool prev_touch = false;

      if((low_price[1] < t1_line_value && close_price[1] > open_price[1]) ||  // Bar 1 had reversal wick and bullish body
         (low_price[2] < t2_line_value && close_price[2] > open_price[2]))    // Bar 2 had reversal wick and bullish body
        {
         prev_touch = true;  // Flag that a recent touch already occurred
        }

      // Final condition for executing a BUY trade on a reversal setup
      if(
         // One of the recent 4 bars touched and rejected the trend line (wick below, open above), AND
         ((low_price[0] < t_line_value && open_price[0] > t_line_value) ||
          (low_price[1] < t1_line_value && open_price[1] > t1_line_value) ||
          (low_price[2] < t2_line_value && open_price[2] > t2_line_value) ||
          (low_price[3] < t3_line_value && open_price[3] > t3_line_value))
         &&
         // Current candle must be bullish and close above the trend line
         (close_price[0] > open_price[0]) && close_price[0] > t_line_value
         &&
         // The bullish confirmation must occur within 3 bars
         (no_bars < 3)
         &&
         // No recent wick reversal signal already processed
         prev_touch == false
         &&
         // The signal must be more recent than the lookback time threshold
         (time_price[3] > lookbackf_time)
         &&
         // Reversal signals are allowed and this signal is not duplicated from the same bar
         (allow_reversal == true && currentBarTime != lastTradeBarTime)
      )
        {
         // Execute BUY trade with defined lot size, SL and TP
         trade.Buy(lot_size, _Symbol, ask_price, ask_price - sl_points, ask_price + tp_points);
         lastTradeBarTime = currentBarTime; // Update last trade bar time to avoid duplicate signals
        }

      //BREAKOUT AND RETEST

      // Flag to track whether a recent bearish wick rejection (touch) already occurred
      bool prev_touch2 = false;

      // Check the last 2 bars to see if a candle had its high wick above the trend line,
      // but closed bearishly below the open - indicating a possible rejection
      if((high_price[1] > t1_line_value && close_price[1] < open_price[1]) ||
         (high_price[2] > t2_line_value && close_price[2] < open_price[2] && open_price[2] < t2_line_value))
        {
         prev_touch2 = true; // Set flag to avoid duplicate signals
        }

      // Variable to store how many bars ago the bearish confirmation candle appeared
      int no_bars2 = 0;

      // Loop through the last 4 candles to detect a wick rejection of the trend line (retest)
      for(int i = 0; i <= 3; i++)
        {
         // Condition: Candle wick (high) goes above the trend line, but the open is below it
         if(high_price[i] > ObjectGetValueByTime(chart_id, up_trend, time_price[i], 0) &&
            open_price[i] < ObjectGetValueByTime(chart_id, up_trend, time_price[i], 0))
           {
            // Search backward from that bar for a bearish confirmation candle
            for(int j = i; j >= 0; j--)
              {
               // Bearish candle that also closed below the trend line
               if(close_price[j] < open_price[j] &&
                  close_price[j] < ObjectGetValueByTime(chart_id, up_trend, time_price[j], 0))
                 {
                  // Count bars between that confirmation and now
                  no_bars2 = Bars(_Symbol, time_frame, time_price[j], TimeCurrent());
                  break; // Exit inner loop
                 }
              }
            break; // Exit outer loop after first valid retest
           }
        }

      // Final conditions to confirm a breakout and retest sell setup:
      // 1. One of the last 4 candles had a wick above the trend line but opened below it
      // 2. Current candle is bearish and closed below the trend line
      // 3. There was no recent similar signal (prev_touch2 == false)
      // 4. The bearish confirmation occurred within the last 3 bars
      // 5. Breakout trades are allowed and this signal is not from the same bar as the last trade
      if(((high_price[1] >= t1_line_value && open_price[1] < t1_line_value) ||
          (high_price[2] >= t2_line_value && open_price[2] < t2_line_value) ||
          (high_price[3] >= t3_line_value && open_price[3] < t3_line_value) ||
          (high_price[0] >= t_line_value)) &&
         (close_price[0] < t_line_value && close_price[0] < open_price[0] && open_price[1] < t1_line_value) &&
         prev_touch2 == false &&
         (no_bars2 < 3) &&
         (allow_break_out == true && currentBarTime != lastTradeBarTime))
        {
         // All conditions met - place SELL trade with defined SL and TP
         trade.Sell(lot_size, _Symbol, ask_price, ask_price + sl_points, ask_price - tp_points);

         // Update timestamp to prevent duplicate signals from the same bar
         lastTradeBarTime = currentBarTime;
        }
     }
  }
输出:


解释:
代码首先声明一个名为 prev_touch2 的布尔变量,该变量用作标志,以检测最近是否已经发生过看跌影线拒绝(假突破)。此标志的目的是防止算法对已处理过的类似设置触发多个交易信号。这有助于减少错误信号,并确保 EA 交易只对最新的有效设置做出反应。
然后,该算法通过分析前两根烛形(high_price[1] 和 high_price[2])来寻找趋势线处看跌拒绝的迹象。它具体考察的是,烛形的最高价最终是否收于开盘价之下,表明看跌压力和突破无法持续;或者它是否短暂突破了趋势线,表明可能存在突破尝试。为了验证拒绝,它为第二根柱([2])添加了一个条件,以确保开盘价同样低于趋势线。如果满足以下任何条件,则 Prev_touch2 设置为 true。
当一根烛形的影线触及趋势线后,变量 no_bars2 被初始化,以指示多少根烛形之前出现了看跌确认烛形。这些数据对于确认信号是否仍然真实以及复测是否为近期进行至关重要。
之后,代码进入循环,重复前四个烛形。目标是找到一根影线(最高点)穿过趋势线但开盘价低于趋势线的烛形;这表明价格尝试突破趋势线,但未能干净利落地突破。找到这样的烛形后,嵌套循环会从它向后搜索看跌确认信号,即收盘价低于当时开盘价和趋势线的烛形。如果发现此确认,则使用 Bars() 方法确定该烛形出现于多少根柱之前,并将结果存储在 no_bars2 中。为了节省计算量,一旦检测到有效信号,循环就会提前结束。
最后,该代码会评估一系列组合条件,以确定是否进行卖出交易。这些条件检查的是:
- 最后四根柱中有一根的影线在最高点高于趋势线,但开盘价低于趋势线。
- 当前柱为阴线,收盘价低于趋势线和开盘价。
- 之前没有标记过类似的信号(prev_touch2 == false)。
- 看跌确认烛形最近出现(在最近 3 根柱内)。
- 交易被允许(allow_break_out == true),并且它不是从同一根K线重复的(currentBarTime != lastTradeBarTime)。
如果满足所有要求,则执行指定手数、止损价和止盈价的卖出交易。为了防止再次使用同一信号进行交易,当前柱的时间会被保存到 lastTradeBarTime 中。
4.1.2.下降趋势线交易执行
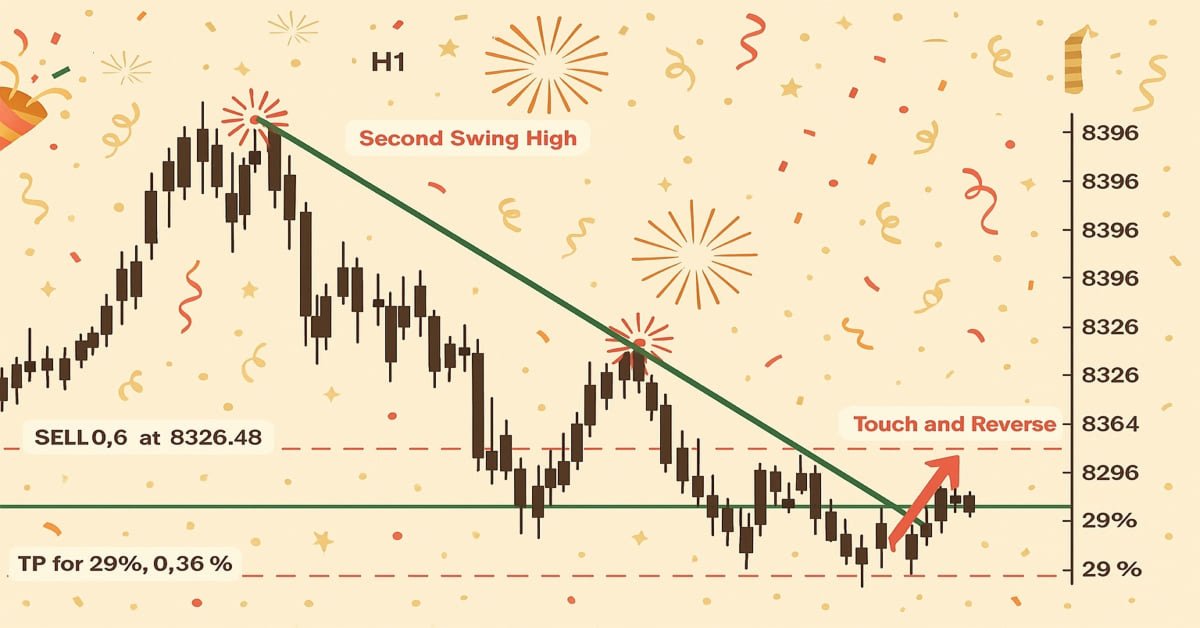
本节我们将寻找下降趋势线上的突破和反转机会。其推理方式与我们处理上升趋势线时所采用的方法正好相反。为了避免不必要的重复,我们在这里就不深入探讨了,因为方法和结构都相当相同。我们将关注反转时的看跌形态和突破及回测时的看涨形态,因为下降趋势线起到了阻力作用。这是主要区别。
示例:
// Only proceed if drawing descending trend lines is enabled
if(allow_downtrend)
  {
// First loop: Find the most recent swing high (first high)
   for(int i = LookbackBars; i < bars_check - LookbackBars; i++)
     {
      // Check if the current bar is a swing high
      if(IsSwingHigh(high_price, i, LookbackBars))
        {
         // Store the price and time of this latest swing high
         first_high = high_price[i];
         first_high_time = time_price[i];

         break;  // Exit loop once the first swing high is found
        }
     }

// Second loop: Find an earlier swing high that is higher than the first high and occurred before it
   for(int i = LookbackBars; i < bars_check - LookbackBars; i++)
     {
      // Check for earlier swing high that is higher and happened before the first one
      if(IsSwingHigh(high_price, i, LookbackBars) && high_price[i] > first_high && time_price[i] < first_high_time)
        {
         // Store the price and time of this older swing high
         second_high = high_price[i];
         second_high_time = time_price[i];

         break;  // Exit loop once the second swing high is found
        }
     }

// Create a trend line object from the second swing high to the first swing high
   ObjectCreate(chart_id, down_trend, OBJ_TREND, 0, second_high_time, second_high, first_high_time, first_high);

// Initially hide the trend line across all timeframes to avoid partial drawing
   ObjectSetInteger(chart_id, down_trend, OBJPROP_TIMEFRAMES, OBJ_NO_PERIODS);

// Validate the swing structure:
// The older swing high should be higher than the later swing high to confirm a descending trend line
   if(first_high < second_high && second_high > 0)
     {
      // Extend the trend line indefinitely to the right for better visual guidance
      ObjectSetInteger(chart_id, down_trend, OBJPROP_RAY_RIGHT, true);

      // Make the trend line visible on all chart timeframes
      ObjectSetInteger(chart_id, down_trend, OBJPROP_TIMEFRAMES, OBJ_ALL_PERIODS);

      // Set the trend line color to dark green for clear distinction
      ObjectSetInteger(chart_id, down_trend, OBJPROP_COLOR, clrDarkGreen);

      // Set the thickness of the trend line to 3 pixels for better visibility
      ObjectSetInteger(chart_id, down_trend, OBJPROP_WIDTH, 3);

      //REVERSAL

      td_line_value = ObjectGetValueByTime(chart_id,down_trend,time_price[0],0);
      td1_line_value = ObjectGetValueByTime(chart_id,down_trend,time_price[1],0);
      td2_line_value = ObjectGetValueByTime(chart_id,down_trend,time_price[2],0);
      td3_line_value = ObjectGetValueByTime(chart_id,down_trend,time_price[3],0);

      int no_bars = 0;

      for(int i = 0; i <= 3; i++)
        {

         if(high_price[i] > ObjectGetValueByTime(chart_id,down_trend,time_price[i],0) && open_price[i] < ObjectGetValueByTime(chart_id,down_trend,time_price[i],0)
           )
           {

            for(int j = i; j >= 0; j--)
              {

               if(close_price[j] < open_price[j] && close_price[j] < ObjectGetValueByTime(chart_id,down_trend,time_price[j],0))
                 {

                  no_bars = Bars(_Symbol,time_frame,time_price[j],TimeCurrent());

                  break;

                 }

              }
            break;

           }

        }

      bool prev_touch = false;

      if((high_price[1] > td1_line_value && close_price[1] < open_price[1])
         ||
         (high_price[2] > td2_line_value && close_price[2] < open_price[2])
        )
        {

         prev_touch = true;

        }

      if(((high_price[1] >= td1_line_value && open_price[1] < td1_line_value) || (high_price[2] >= td2_line_value && open_price[2] < td2_line_value)
          || (high_price[3] >= td3_line_value && open_price[3] < td3_line_value) || (high_price[0] >= td_line_value))
         && (close_price[0] < td_line_value && close_price[0] < open_price[0] && open_price[1] < td1_line_value)
         && (no_bars < 3)
         && prev_touch == false
         && (allow_reversal == true  && currentBarTime != lastTradeBarTime)
        )
        {

         trade.Sell(lot_size,_Symbol,ask_price,ask_price + sl_points, ask_price - tp_points);
         lastTradeBarTime = currentBarTime;

        }

      //BREAKOUT AMD RETEST

      // Flag to track whether a recent bullish wick rejection (touch) already occurred
      bool prev_touch2 = false;

      // Check the last 2 candles for bullish rejection from below the descending trend line
      // A bullish rejection occurs when the low goes below the trend line but closes above the open (bullish candle)
      if((low_price[1] < td1_line_value && close_price[1] > open_price[1]) ||
         (low_price[2] < td2_line_value && close_price[2] > open_price[2] && open_price[2] > td2_line_value))
        {
         prev_touch2 = true; // Set flag to prevent duplicate signals from the same type of setup
        }

      // Variable to hold how many bars ago a bullish confirmation candle occurred after wick rejection
      int no_bars2 = 0;

      // Loop through the last 4 candles to detect a wick rejection of the descending trend line
      for(int i = 0; i <= 3; i++)
        {
         // Condition: Candle wick (low) goes below the trend line, but the open is above it
         if(low_price[i] < ObjectGetValueByTime(chart_id, down_trend, time_price[i], 0) &&
            open_price[i] > ObjectGetValueByTime(chart_id, down_trend, time_price[i], 0))
           {
            // Look backward for a bullish confirmation candle that closes above the trend line
            for(int j = i; j >= 0; j--)
              {
               if(close_price[j] > open_price[j] &&
                  close_price[j] > ObjectGetValueByTime(chart_id, down_trend, time_price[j], 0))
                 {
                  // Count how many bars ago that bullish confirmation happened
                  no_bars2 = Bars(_Symbol, time_frame, time_price[j], TimeCurrent());
                  break; // Exit inner loop once confirmation is found
                 }
              }
            break; // Exit outer loop after the first valid retest is processed
           }
        }

      // Final conditions to confirm a breakout or retest for a BUY setup on descending trend line:
      // 1. One of the last 4 candles had a wick below the trend line but opened above it
      // 2. Current candle is bullish and closed above the trend line
      // 3. A valid bullish confirmation occurred within the last 3 bars
      // 4. No recent similar touch detected (prev_touch2 == false)
      // 5. Candle timestamps are valid (not too far back)
      // 6. Breakout trading is allowed, and this bar is not the same as the last trade bar
      if(
         ((low_price[0] < td_line_value && open_price[0] > td_line_value) ||
          (low_price[1] < td1_line_value && open_price[1] > td1_line_value) ||
          (low_price[2] < td2_line_value && open_price[2] > td2_line_value) ||
          (low_price[3] < td3_line_value && open_price[3] > td3_line_value)) &&
         (close_price[0] > open_price[0]) && close_price[0] > td_line_value &&
         (no_bars2 < 3) &&
         prev_touch2 == false &&
         (time_price[3] > lookbackfd_time) &&
         (allow_break_out == true && currentBarTime != lastTradeBarTime)
      )
        {
         // All conditions met - place a BUY trade with defined SL and TP
         trade.Buy(lot_size, _Symbol, ask_price, ask_price - sl_points, ask_price + tp_points);

         // Update the last trade time to avoid repeated trades from the same bar
         lastTradeBarTime = currentBarTime;
        }
     }
  }
输出:


解释:
本节实现了根据下降趋势线的突破或拒绝来执行买入交易的逻辑。为了确定最近是否已经发生了看涨影线拒绝,我们首先构建一个名为 prev_touch2 的布尔变量。这样做可以避免使用相同的信号进行重复交易。接下来,我们查看最后两根烛形,以确定它们是否有任何烛形的影线最终收盘呈阳线(即高于开盘价),尽管它们向下穿过了下降趋势线。如果发现此类情况,则将 prev_touch2 设置为 true。
自出现合法看涨确认蜡烛以来的烛形数量将存储在名为 no_bars2 的变量中。为了确定是否可能出现回测,我们查看了最近四根柱,看看是否有任何一根柱的影线低于下降趋势线,而开盘价高于下降趋势线。接下来,我们从该烛形向后回溯,寻找看涨确认烛形,即收盘价高于下降趋势线及其开盘价的烛形(如果发现影线拒绝现象)。一旦找到确认烛形,我们将它保存在 no_bars2 中,并确定它出现在多少根柱之前。
为了验证合格的买入配置,我们最后整合了多个条件。我们查看前四根柱中是否有任何一根开盘价高于趋势线,但影线低于趋势线。我们还验证了当前烛形收盘价高于趋势线,呈阳线(收盘价高于开盘价),并且阳线确认出现在前三根柱内。
同样,我们还要确保时间周期合格,允许突破交易,信号不是来自与前一笔交易相同的烛形,并且之前没有记录到最近的拒绝(prev_touch2)。如果满足所有条件,EA 将使用指定的交易手数、止损价和止盈价来执行买入交易。它还会修改 lastTradeBarTime,以避免从同一根烛形进行重复交易。
结论
通过本文中介绍的所有内容,您现在已经掌握了使用任何涉及趋势线的图表形态的基础知识。从通道到上升和下降趋势线,您已经学习了如何检索趋势线值并将其与价格走势进行比较,以及如何根据明确的突破或反转条件执行交易。我们将这些知识实际应用于构建一个 EA 交易,该系统可以自动检测并实时响应趋势线交互。这种逻辑具有很强的适应性,这意味着你可以将其应用于其他图表形态,例如三角形、楔形,甚至是双顶或双底。
本文由MetaQuotes Ltd译自英文
原文地址: https://www.mql5.com/en/articles/18259
注意: MetaQuotes Ltd.将保留所有关于这些材料的权利。全部或部分复制或者转载这些材料将被禁止。
本文由网站的一位用户撰写,反映了他们的个人观点。MetaQuotes Ltd 不对所提供信息的准确性负责,也不对因使用所述解决方案、策略或建议而产生的任何后果负责。

你好,兄弟
您的 Ea 可以在波动性衍生品上使用吗?
谢谢你的这篇文章,它很有启发性。愿上帝保佑你。
不客气,谢谢你的美言。