Key Swing Levels MT4
- Indicatori
- Versione: 1.0
- Attivazioni: 5
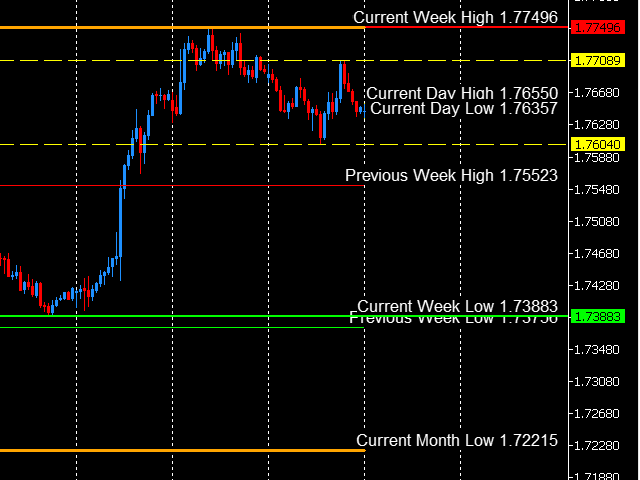
This dynamic indicator will draw the Key Swing High and Low Levels for any symbol on any timeframe!
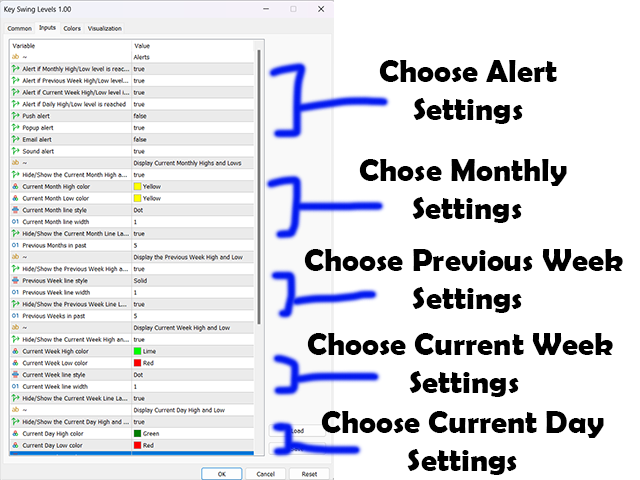
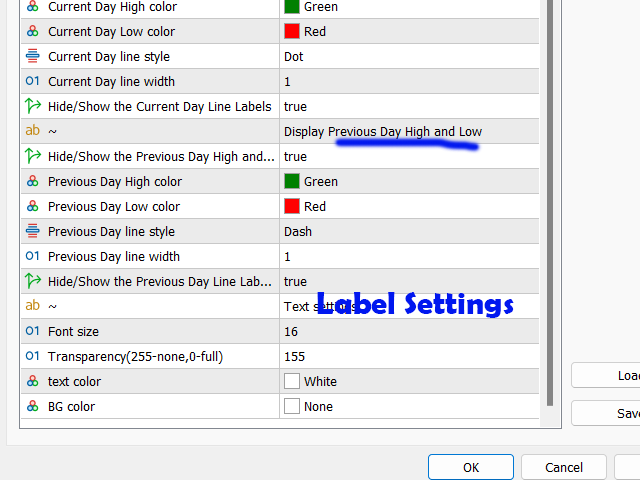
User may Hide or Show any Level or Label and also Receive Alerts when price returns to that key level via Pop-Up, Push, Email or Sound.
Levels include Current Day High/Low, Previous Day High/Low, Current Week High/Low, Previous Week High/Low and Monthly High/Low.
The Key Levels are labeled with the Price Point Data Listed next to it for quick easy reference.
You can change the Style, Size and Color of any Level Line and Label.
You save a lot of time by no longer needing to identify and keep drawing these lines on your charts....it's done for you!
You can now focus on your strategy and use these lines as Key Levels of Support Resistance and Take Profit!!
Also Available in MT5!
Complimentary MT4 Products you may also like available here:
ADR Reversal Indicator: https://www.mql5.com/en/market/product/ 94554
Fibonacci Retracements and Extensions Tool: https://www.mql5.com/en/market/product/ 94559
AVAILABLE IN MT5 HERE:
Multiple Moving Average Crossover Alerts: https://www.mql5.com/en/market/product/94369
ADR Reversal Indicator: https://www.mql5.com/en/market/product/94148
Fibonacci Retracements and Extensions Tool: https://www.mql5.com/en/market/product/94303
Key Swing Levels: https://www.mql5.com/en/market/product/94545