Trend Line Map Pro MT5

4.09

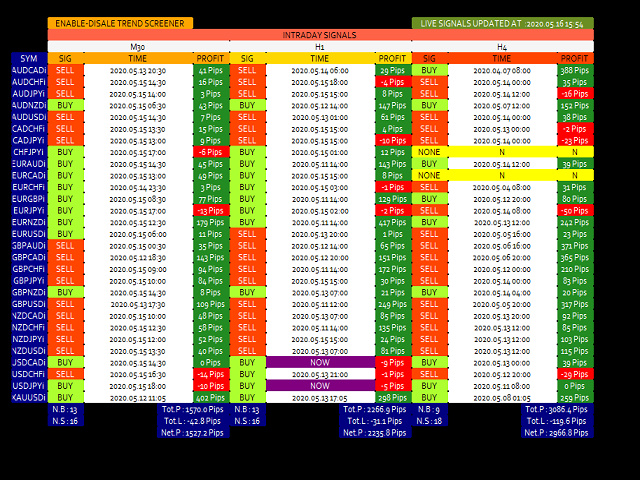
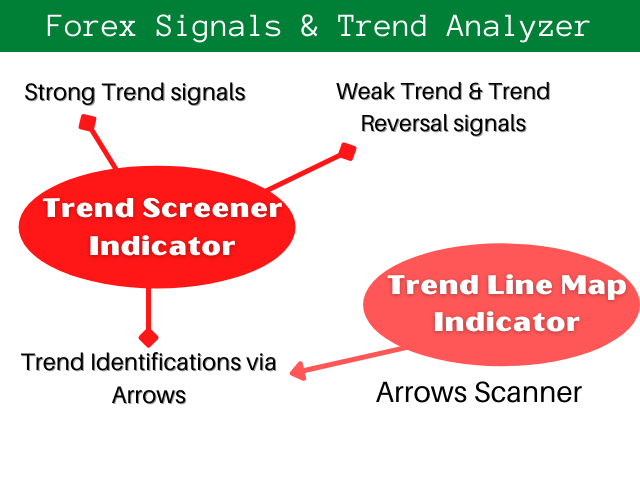
Trend Line Map indicator is an addons for Trend Screener Indicator. It's working as a scanner for all signals generated by Trend screener ( Trend Line Signals ) .

It's a Trend Line Scanner based on Trend Screener Indicator.  If you don't have Trend Screener Pro Indicator,  the Trend Line Map Pro will not work. 


LIMITED TIME OFFER : Trend Line Map Indicator is available for only 50 $ and lifetime. ( Original price 125$ )

By accessing to our MQL5 Blog,  you can find all our premium indicators with analysis examples : Click Here


1. Advantages You Get Easy

  • Display Buy and Sell signals based on Currencies and Time Frames.
  • Evaluate how many pips the price increased or decreased since the arrows appeared in the chart. ( Trend Screener Indicators Arrows )
  • Display the timing of signals.
  • Getting a multi-timeframe and multi-currencies  Alerts to buy and sell alerts.

2. How to use Trend Line Map

All Trend Line Map documentations ( Instructions ) and strategy details are available in this post in our MQL5 Blog : Click Here.


3. Tips to improve indicator calculation performance

1. Ensure that you download the data of the pairs that you will analyze.
2. Set the Update Frequency to 60 seconds. ( Default 20 seconds )
3. The maximum number of pairs to monitor should be more than 12 pairs to have a maximum performance of the trend performance calculation.
4. Attach indicator to H1 timeframe.


4. Contact

If you have some questions or if you need help, Contact me via Private Message.


Author

SAYADI ACHREF , fintech software engineer and founder of Finansya.

Recensioni 14
isaqueab83
66
isaqueab83 2024.08.06 13:38 
 

I would like to thank Sayadi for the support he gave me regarding my doubts regarding his trading system. He was very attentive and simply a fantastic guy. As for the indicators, they are incredibly accurate. I am very satisfied with everything. I recommend him to everyone! I appreciate your work, Sayad.

$heik @hmed
156
$heik @hmed 2024.01.11 16:37 
 

Another purchase and yes another 5 star product. Well please and does the job very well. Still working out a few thing but getting through like butter. Thank you sir.

Bragnimo
99
Bragnimo 2023.11.02 12:41 
 

This product is excellent. It allows you to screen the market and summarize multi-currency sentiment in a single chart. It will optimize your time and energy by giving you information on new trends forming. The service is 5 stars with great responsiveness and kindness.

Prodotti consigliati
Noize Absorption Index - is the manual trading system that measures the difference of pressure between bears forces and bulls forces. Green line - is a noize free index that showing curent situation. Zero value of index shows totally choppy/flat market.Values above zero level shows how powerfull bullish wave is and values below zero measures bearish forces.Up arrow appears on bearish market when it's ready to reverse, dn arrow appears on weak bullish market, as a result of reverse expectation.
**   All Symbols   x   All Timeframes   scan just by pressing scanner button ** Discount: The price is $50$, But now it is just $39, Limited time offer is active. *** Contact me  to send you instruction and add you in "Trend Reversal group" for sharing or seeing experiences with other users. Introduction: Trendlines are the most famous technical analysis in trading . Trendlines continually form on the charts of markets across all the different timeframes providing huge opportunities for traders
Laguerre SuperTrend Clouds   adds an Adaptive Laguerre averaging algorithm and alerts to the widely popular SuperTrend indicator. As the name suggests,   Laguerre SuperTrend Clouds (LSC)   is a trending indicator which works best in trendy (not choppy) markets. The SuperTrend is an extremely popular indicator for intraday and daily trading, and can be used on any timeframe. Incorporating Laguerre's equation to this can facilitate more robust trend detection and smoother filters. The LSC uses the
Overview Mirror Signals Service EA (Text only)   is a powerful monitoring Expert Advisor that automatically sends   real-time Telegram notifications   for all important trade events on your MetaTrader 5 account. It is engineered specifically for   signal providers ,   trade-copier operators ,   auditors ,   educators , and   professional trading services   that require immediate, detailed, and reliable reporting. Everything from   entries, exits, SL/TP changes, comment changes, trailing sto
Il livello Premium è un indicatore unico con una precisione superiore all'80% delle previsioni corrette! Questo indicatore è stato testato dai migliori Specialisti di Trading per più di due mesi! L'indicatore dell'autore che non troverai da nessun'altra parte! Dagli screenshot puoi vedere di persona la precisione di questo strumento! 1 è ottimo per il trading di opzioni binarie con un tempo di scadenza di 1 candela. 2 funziona su tutte le coppie di valute, azioni, materie prime, criptovalu
Inverted_Chart_EA Utility Expert Advisor Inverted_Chart_EA creates and maintains a mirror-inverted chart of any symbol and timeframe. It automatically generates a custom instrument (e.g. US30_INV ) and keeps its price history updated in real time, with bars mirrored around a chosen pivot. This utility gives traders a new way to analyze the market from a different perspective by flipping the chart upside down. Why use an inverted chart? Highlight hidden patterns – price formations that look ordin
Trading Utility for Forex Currency Pairs Only not for Gold  Functions Auto Lot Calculation based on Risk Auto stoploss  Auto TakeProfit Breakeven Auto Close Half % Close in percentage with respect to the PIPs Pending Orders BuyLimit Sell Limit with distances BuyStop Sell Stop    with distances Trading Informations Risk in percentage For Multiple trades Combine Takeprofit and Combine Stoplosses
Trade smarter, not harder: Empower your trading with Harmonacci Patterns This is arguably the most complete harmonic price formation auto-recognition indicator you can find for the MetaTrader Platform. It detects 19 different patterns, takes fibonacci projections as seriously as you do, displays the Potential Reversal Zone (PRZ) and finds suitable stop-loss and take-profit levels. [ Installation Guide | Update Guide | Troubleshooting | FAQ | All Products ] It detects 19 different harmonic pri
TradePilotmt5
Hossein Khalil Alishir
TradePilot Expert Advisor (EA) for MetaTrader 5 TradePilot is a professional and user-friendly Expert Advisor (EA) for MetaTrader 5 (MT5) . It simplifies automated trading , risk management , and trade execution with a smart trading panel . Perfect for beginners and experienced traders looking for a reliable trade manager EA with automated lot size calculation and smart position management. Key Advantages User-Friendly Trading Panel: Customizable panel with buttons and hotkeys for fast ex
Step into the world of Forex trading with confidence, clarity, and precision using Gold Indicator a next-generation tool engineered to take your trading performance to the next level. Whether you’re a seasoned professional or just beginning your journey in the currency markets, Gold Indicator equips you with powerful insights and help you trade smarter, not harder. Built on the proven synergy of three advanced indicators, Gold Indicator focuses exclusively on medium and long-term trends elimina
Owl Smart Levels MT5
Sergey Ermolov
4.03 (32)
Versione MT4  |  FAQ L' indicatore Owl Smart Levels è un sistema di trading completo all'interno dell'unico indicatore che include strumenti di analisi di mercato popolari come i frattali avanzati di Bill Williams , Valable ZigZag che costruisce la corretta struttura a onde del mercato, e i livelli di Fibonacci che segnano i livelli esatti di entrata nel mercato e luoghi per prendere profitti. Descrizione dettagliata della strategia Istruzioni per lavorare con l'indicatore Consulente-assistente
L'indicateur SMC Venom Model BPR est un outil professionnel pour les traders travaillant dans le concept Smart Money (SMC). Il identifie automatiquement deux modèles clés sur le graphique des prix: FVG   (Fair Value Gap) est une combinaison de trois bougies, dans laquelle il y a un écart entre la première et la troisième bougie. Forme une zone entre les niveaux où il n'y a pas de support de volume, ce qui conduit souvent à une correction des prix. BPR   (Balanced Price Range) est une combinaiso
Magic Finger can help you identify trends and trading opportunities clearly. The finger points to the open position signal, and the discoloration line is confirmed by the trend. If you are a day trader, you can choose to trade during a period of active trading, referring to the discoloration line as the basis for the next order, finger signal as a filter. If you are a trend trader, you can choose a period above H1, wait for the appearance of the finger signal in the key price area, and enter th
TRI Visualizer
Yoshimi Mon 三 Ura
TRI Visualizer MT5 – Thermodynamic Market Analysis Overview The TRI (Thermal Range Indicator) Visualizer Enhanced is a rare market analysis indicator that goes beyond conventional technical analysis, applying principles of thermodynamics from physics. It interprets market price fluctuations as “thermodynamic energy,” enabling the highly accurate detection of subtle market changes that are often overlooked. Innovative Mechanisms 1. Dual Calculation Engines Classic TRI Mode Formula: |Close
L'indicatore DYJ BoS identifica e contrassegna automaticamente gli elementi essenziali dei cambiamenti nella struttura del mercato, tra cui: Breakout of Structure (BoS): rilevato quando il prezzo effettua una mossa significativa, rompendo un precedente punto di struttura. Segna possibili linee di tendenza al rialzo e al ribasso (UP e DN, ovvero nuovi massimi e nuovi minimi continui) e una volta che il prezzo sfonda queste linee, segna frecce rosse (ORSO) e verdi (TORO) Il BoS si verifica sol
The Gann Box (or Gann Square) is a market analysis method based on the "Mathematical formula for market predictions" article by W.D. Gann. This indicator can plot three models of Squares: 90, 52(104), 144. There are six variants of grids and two variants of arcs. You can plot multiple squares on one chart simultaneously. Parameters Square — selection of a Gann square model 90 — square of 90 (or square of nine); 52 (104) — square of 52 (or 104); 144 — universal square of 144; 144 (full) — "ful
"Impulses and Corrections 5" is created to help traders navigate the market situation. The indicator shows multi-time frame upward and downward "Impulses" of price movements. These impulses are the basis for determining the "Base" , which is composed of zones of "Corrections" of price movements, as well as "Potential" zones for possible scenarios of price movement. Up and down impulses are determined based on a modified formula of Bill Williams' "Fractals" indicator. The last impulse is always
An indicator of pattern #31 ("Long Island") from Encyclopedia of Chart Patterns by Thomas N. Bulkowski. The second gap is in the opposite direction. Parameters: Alerts - show alert when an arrow appears   Push - send a push notification when an arrow appears (requires configuration in the terminal) GapSize - minimum gap size in points ArrowType - a symbol from 1 to 17 ArrowVShift - vertical shift of arrows in points   ShowLevels - show levels ColUp - color of an upward line ColDn - color of a d
PIN BAR POWER REVERSAL SCANNER MT5   UNLOCK THE SECRET OF INSTITUTIONAL TRADING WITHOUT THE HEDGE FUND BUDGET What If I Told You There's a Way to Spot Reversals BEFORE They Happen? Professional traders know: Pin bars at key levels are where fortunes are made. The institutions use them. The smart money follows them. And now, YOU can trade them with surgical precision. ---SPECIAL BONUS (VALID TILL JUNE 2026)- OUR DAILY SCALPER EA for BTCUSD and VIX75 •········································
Pro Gold System Indicator
PEDRO JOAQUIM GONCALVES GOMES
ADVANCED FUNCTIONALITIES: Trend Score (0-100) with visual bar Intelligent signals with adjustable strength (1-10) Risk management with automatic TP/SL Audible and visual alerts Price zones with smooth filling Multi-indicator analysis (RSI, ATR, BB, EMAs) DESIGN FEATURES Modern Visual: Smooth and well-spaced lines (EMA with 2-3px width) Vibrant and professional colors (Sky Blue, Orange, Gold) Modern arrows (code 233/234) for buy/sell signals Configurable dark/light theme Adjustable transparency f
Il nostro indicatore   Basic Support and Resistance   è la soluzione necessaria per aumentare l'analisi tecnica.Questo indicatore consente di proiettare i livelli di supporto e resistenza sul grafico/ MT4 gratuita Funzionalità Integrazione dei livelli di Fibonacci: Con la possibilità di visualizzare i livelli di Fibonacci insieme a livelli di supporto e resistenza, il nostro indicatore ti dà una visione ancora più profonda del comportamento del mercato e delle possibili aree di inversione. Ot
The Trend Duration Forecast MT5 indicator is designed to estimate the probable lifespan of a bullish or bearish trend. Using a Hull Moving Average (HMA) to detect directional shifts, it tracks the duration of each historical trend and calculates an average to forecast how long the current trend is statistically likely to continue. This allows traders to visualize both real-time trend strength and potential exhaustion zones with exceptional clarity. KEY FEATURES Dynamic Trend Detection:   Utiliz
Supply and Demand Pro
Godbless C Nygu
4 (1)
Join Deriv link on profile>>> GET THIS FULL COPY AND GET ANOTHER FREE INDICATOR ONE OF THE BEST AND USEFULL INDICATORS IN THE WORLD ..This is the one of the best usefull indicators which has chosen to be used by top traders in the world. AUTOMATIC SUPPORT AND RESISTANCE This way of trading is also called Supply and demand, On this way of trading you can see auto colours appear where the market changes direction buying or selling Direction. ALL KIND OF PAIRS METALS AND INDICIES ARE INCLUDED A
RM Divergence Pro
Mohammadreza Mahdi Mavaddat
RM Divergence Pro is a professional, non-repainting RSI divergence indicator designed for traders who want real structural insight beyond classic divergence tools. It accurately detects Regular Divergence (RD), Hidden Divergence (HD), Inability (IA), and Potential Divergence (P-DVG) using stable swing-based logic. Built for clarity, precision, and clean market structure analysis. -------------------------------------------------- OVERVIEW RM Divergence Pro is an advanced RSI-based divergence
Innanzitutto, vale la pena sottolineare che questo Strumento di Trading è un Indicatore Non-Ridipingente, Non-Ridisegnante e Non-Laggante, il che lo rende ideale per il trading professionale. Corso online, manuale utente e demo. L'Indicatore Smart Price Action Concepts è uno strumento molto potente sia per i nuovi che per i trader esperti. Racchiude più di 20 utili indicatori in uno solo, combinando idee di trading avanzate come l'Analisi del Trader del Circolo Interno e le Strategie di Tradin
Fibo Channels
Jeffrey Quiatchon
Fibo Daily Channel Indicator The  Indicator is a powerful tool for traders, providing precise daily support and resistance levels based on Fibonacci retracement and extension calculations. This indicator automatically draws key pivot points (PP, R1, R2, S1, S2) as well as additional extension levels (R3, R4, S3, S4), helping traders identify potential reversal and breakout zones with ease. It includes customizable alerts and push notifications, allowing traders to receive updates whenever the pr
SMART SD ARROW INDICATOR  Trade Smarter, Not Harder: The Smart SD Arrow Indicator That Paints Clear Buy & Sell Signals Right On Your Chart!  Finally, an All-in-One Supply & Demand Tool That Doesn’t Just Draw Zones—It Gives You Precise, Actionable Entry Arrows. Stop Analyzing, Start Executing. Dear Trader, Let's be honest. You've tried indicators that draw complicated zones all over your chart. They look smart, but when it's time to pull the trigger, you're left with the same old question:
Fibaction
Abdelkhalek Orabi
Indicator Name: Fibaction – price action candle Detector Description: Fibo Signal Boxes is a powerful Smart Money Concept (SMC)-inspired indicator that auto-detects price action candles. bullish hammers and shooting stars, then draws precise Fibonacci entry zones and multiple take-profit levels directly on the chart. as for the SL personally i use 40 pips rules  Key Features: Detects bullish hammer and shooting star reversal candles. Automatically draws Fibonacci entry and TP boxes. as
Indicatore Crypto_Forex Pattern PINBAR per MT5, senza ridisegnare, senza ritardi. - L'indicatore "PINBAR Pattern" è un indicatore molto potente per il trading basato sull'azione dei prezzi. - L'indicatore rileva le PinBar sul grafico: - PinBar rialzista - Segnale a freccia blu sul grafico (vedi immagini). - PinBar ribassista - Segnale a freccia rossa sul grafico (vedi immagini). - Con avvisi su PC e dispositivi mobili. - L'indicatore "PINBAR Pattern" è eccellente da combinare con i livelli di
Volume Profile V6
Andrey Kolesnik
4.67 (3)
The volume profile indicator of the market + a smart oscillator. It works on almost all instruments-currency pairs, stocks, futures, cryptocurrency, on real volumes and on tick ones. You can set both the automatic definition of the profile range, for example, for a week or a month, etc., and set the range manually by moving the boundaries (two vertical lines red and blue). It is shown as a histogram. The width of the histogram at this level means, conditionally, the number of transactions condu
Gli utenti di questo prodotto hanno anche acquistato
Se acquisti questo indicatore, riceverai il mio Trade Manager Professionale + EA  GRATUITAMENTE. Innanzitutto è importante sottolineare che questo sistema di trading è un indicatore Non-Repainting, Non-Redrawing e Non-Lagging, il che lo rende ideale sia per il trading manuale che per quello automatico. Corso online, manuale e download di preset. Il "Sistema di Trading Smart Trend MT5" è una soluzione completa pensata sia per i trader principianti che per quelli esperti. Combina oltre 10 indicat
Divergence Bomber
Ihor Otkydach
4.96 (76)
Ogni acquirente dell’indicatore riceverà inoltre gratuitamente: L’utilità esclusiva “Bomber Utility”, che gestisce automaticamente ogni operazione, imposta i livelli di Stop Loss e Take Profit e chiude le posizioni secondo le regole della strategia I file di configurazione (set file) per adattare l’indicatore a diversi asset I set file per configurare il Bomber Utility in tre modalità: “Rischio Minimo”, “Rischio Bilanciato” e “Strategia di Attesa” Una guida video passo-passo per installare, conf
Entry In The Zone and SMC Multi Timeframe è uno strumento di analisi di mercato in tempo reale sviluppato sulla base degli Smart Money Concepts (SMC). È progettato per aiutare i trader ad analizzare la struttura del mercato in modo sistematico e ottenere una visione più chiara della direzione generale del mercato. Il sistema analizza automaticamente i Punti di Inversione, le Zone Chiave e la Market Structure su più timeframe, mostrando Point of Interest (POI), segnali No Repaint e Auto Fibonacci
FX Power MT5 NG
Daniel Stein
5 (28)
FX Power: Analizza la Forza delle Valute per Decisioni di Trading Più Intelligenti Panoramica FX Power è lo strumento essenziale per comprendere la reale forza delle principali valute e dell'oro in qualsiasi condizione di mercato. Identificando le valute forti da comprare e quelle deboli da vendere, FX Power semplifica le decisioni di trading e rivela opportunità ad alta probabilità. Che tu segua le tendenze o anticipi inversioni utilizzando valori estremi di Delta, questo strumento si adatta
Gold Sniper Scalper Pro
Ich Khiem Nguyen
3.29 (7)
Gold Sniper Scalper Pro - Sistema di Trading dell'Oro (XAU/USD) su MetaTrader 5 Per il trader serio: Approcciate il trading sull'Oro con una metodologia strutturata e basata sui dati che combina molteplici fattori di analisi di mercato. Questo strumento è stato creato per supportare la vostra analisi del trading sull'Oro. Opportunità di Prezzo Limitata Questa è un'occasione per possedere Gold Sniper Scalper Pro prima che il prezzo aumenti. Il prezzo del prodotto aumenterà di $50 dopo ogni 10 ac
Atomic Analyst MT5
Issam Kassas
4.19 (27)
Innanzitutto, vale la pena sottolineare che questo indicatore di trading non è repaint, non è ridisegno e non presenta ritardi, il che lo rende ideale sia per il trading manuale che per quello automatico. Manuale utente: impostazioni, input e strategia. L'Analista Atomico è un indicatore di azione del prezzo PA che utilizza la forza e il momentum del prezzo per trovare un miglior vantaggio sul mercato. Dotato di filtri avanzati che aiutano a rimuovere rumori e segnali falsi, e aumentare il pote
Azimuth Pro
Ottaviano De Cicco
LAUNCH PROMO Azimuth Pro price is initially set at 299 $ for the first 100 buyers. Final price will be 499 $ . THE DIFFERENCE BETWEEN RETAIL AND INSTITUTIONAL ENTRIES ISN'T THE INDICATOR — IT'S THE LOCATION. Most traders enter at arbitrary price levels, chasing momentum or reacting to lagging signals. Institutions wait for price to reach structured levels where supply and demand actually shift. Azimuth Pro maps these levels automatically: swing-anchored VWAP, multi-timeframe structure lines,
Quantum TrendPulse
Bogdan Ion Puscasu
5 (20)
Ecco   Quantum TrendPulse   , lo strumento di trading definitivo che combina la potenza di   SuperTrend   ,   RSI   e   Stocastico   in un unico indicatore completo per massimizzare il tuo potenziale di trading. Progettato per i trader che cercano precisione ed efficienza, questo indicatore ti aiuta a identificare con sicurezza le tendenze di mercato, i cambiamenti di momentum e i punti di entrata e uscita ottimali. Caratteristiche principali: Integrazione SuperTrend:   segui facilmente l'andame
Trend indicator AI mt5
Ramil Minniakhmetov
5 (13)
Trend Ai indicator è un ottimo strumento che migliorerà l'analisi di mercato di un trader combinando l'identificazione della tendenza con punti di ingresso utilizzabili e avvisi di inversione. Questo indicatore consente agli utenti di navigare nelle complessità del mercato forex con fiducia e precisione Oltre ai segnali primari, l'indicatore Ai di tendenza identifica i punti di ingresso secondari che si presentano durante i pullback o i ritracciamenti, consentendo ai trader di capitalizzare le
Grabber System MT5
Ihor Otkydach
4.81 (21)
Ti presento un eccellente indicatore tecnico: Grabber, che funziona come una strategia di trading "tutto incluso", pronta all’uso. In un solo codice sono integrati strumenti potenti per l’analisi tecnica del mercato, segnali di trading (frecce), funzioni di allerta e notifiche push. Ogni acquirente di questo indicatore riceve anche gratuitamente: L’utility Grabber: per la gestione automatica degli ordini aperti Video tutorial passo dopo passo: per imparare a installare, configurare e utilizzare
SynaptixQuant Dominance Matrix
Devie Arevalo Montemayor
5 (1)
SynaptixQuant Dominance Matrix: Institutional-Grade Market State Extraction Engineered for traders who require a data-driven view of market behaviour beyond surface-level indicators. The Synaptix Quant (SQ) Dominance Matrix is not a conventional currency strength display. Behind its intentionally streamlined interface runs a sophisticated analytical architecture designed to quantify market conditions with precision. Every output is generated through layered signal processing built to identify d
ARIPoint
Temirlan Kdyrkhan
1 (1)
ARIPoint is a powerful trading companion designed to generate high-probability entry signals with dynamic TP/SL/DP levels based on volatility. Built-in performance tracking shows win/loss stats, PP1/PP2 hits, and success rates all updated live. Key Features: Buy/Sell signals with adaptive volatility bands Real-time TP/SL/DP levels based on ATR Built-in MA Filter with optional ATR/StdDev volatility Performance stats panel (Success, Profit/Loss, PP1/PP2) Alerts via popup, sound, push, or email Cu
Berma Bands
Muhammad Elbermawi
5 (7)
L'indicatore Berma Bands (BBs) è uno strumento prezioso per i trader che cercano di identificare e capitalizzare i trend di mercato. Analizzando la relazione tra il prezzo e le BBs, i trader possono discernere se un mercato è in una fase di trend o di range. Visita il [ Berma Home Blog ] per saperne di più. Le Berma Bands sono composte da tre linee distinte: la Upper Berma Band, la Middle Berma Band e la Lower Berma Band. Queste linee sono tracciate attorno al prezzo, creando una rappresentazion
FX Volume MT5
Daniel Stein
4.79 (24)
FX Volume: Scopri il Vero Sentimento di Mercato dalla Prospettiva di un Broker Panoramica Rapida Vuoi portare la tua strategia di trading a un livello superiore? FX Volume ti offre informazioni in tempo reale su come i trader retail e i broker sono posizionati—molto prima che compaiano report in ritardo come il COT. Che tu miri a guadagni costanti o desideri semplicemente un vantaggio più solido sui mercati, FX Volume ti aiuta a individuare grandi squilibri, confermare i breakout e perfezionar
ACB Breakout Arrows MT5
KEENBASE SOFTWARE SOLUTIONS
5 (1)
L’indicatore ACB Breakout Arrows fornisce un segnale di ingresso fondamentale nel mercato rilevando uno specifico pattern di breakout. L’indicatore analizza costantemente il grafico per individuare un momentum stabile in una direzione e fornisce un segnale preciso subito prima del movimento principale. Ottieni lo scanner multi-simbolo e multi-timeframe da qui - Scanner per ACB Breakout Arrows MT5 Caratteristiche principali I livelli di Stop Loss e Take Profit sono forniti automaticamente dall’
Super Signal – Skyblade Edition Sistema professionale di segnali di tendenza senza repaint / senza ritardo con tasso di vincita eccezionale | Per MT4 / MT5 Caratteristiche principali: Super Signal – Skyblade Edition è un sistema intelligente di segnali progettato specificamente per il trading di tendenza. Utilizza una logica di filtraggio multilivello per identificare esclusivamente i movimenti direzionali forti, supportati da un reale slancio (momentum). Questo sistema   non tenta di preveder
Atbot
Zaha Feiz
4.62 (55)
AtBot:  Come funziona e come usarlo ### Come funziona L'indicatore "AtBot" per la piattaforma MT5 genera segnali di acquisto e vendita utilizzando una combinazione di strumenti di analisi tecnica. Integra la Media Mobile Semplice (SMA), la Media Mobile Esponenziale (EMA) e l'indice di Gamma Vero Medio (ATR) per identificare opportunità di trading. Inoltre, può utilizzare le candele Heikin Ashi per migliorare la precisione dei segnali. Lascia una recensione dopo l'acquisto e ricevi un regalo bon
TPSproTREND PrO MT5
Roman Podpora
4.74 (19)
TPSproTrend PRO identifica il momento in cui il mercato cambia effettivamente direzione e forma un punto di ingresso all'inizio del movimento. Si entra nel mercato quando il prezzo sta appena iniziando a muoversi, e non dopo che il movimento si è già verificato.   Indicatore       Non ridisegna i segnali e visualizza automaticamente i punti di ingresso, lo Stop Loss e il Take Profit, rendendo il trading chiaro, visivo e strutturato. ISTRUZIONI RUS   -   VERSIONE MT4 Vantaggi principali Segnali
Volatility Master for MetaTrader is a real-time dashboard tool that scans up to 56 symbols using up to 2 flexible dashboards on different charts to identify high-volatility, trending markets instantly. With clear bullish/bearish signals, customizable alerts, and a user-friendly interface, it helps you avoid range-bound conditions and focus on high-probability trades. Clarity leads to confidence. Trade confidently and protect your capital effectively with this powerful dashboard. Setup & Guide: 
Elliott Wave Trend was designed for the scientific wave counting. This tool focuses to get rid of the vagueness of the classic Elliott Wave Counting using the guideline from the template and pattern approach. In doing so, firstly Elliott Wave Trend offers the template for your wave counting. Secondly, it offers Wave Structural Score to assist to identify accurate wave formation. It offers both impulse wave Structural Score and corrective wave Structure Score. Structural Score is the rating to sh
Trend Forecaster
Alexey Minkov
5 (7)
The Trend Forecaster indicator utilizes a unique proprietary algorithm to determine entry points for a breakout trading strategy. The indicator identifies price clusters, analyzes price movement near levels, and provides a signal when the price breaks through a level. The Trend Forecaster indicator is suitable for all financial assets, including currencies (Forex), metals, stocks, indices, and cryptocurrencies. You can also adjust the indicator to work on any time frames, although it is recommen
How many times have you bought a trading indicator with great back-tests, live account performance proof with fantastic numbers and stats all over the place but after using it, you end up blowing your account? You shouldn't trust a signal by itself, you need to know why it appeared in the first place, and that's what RelicusRoad Pro does best! User Manual + Strategies + Training Videos + Private Group with VIP Access + Mobile Version Available A New Way To Look At The Market RelicusRoad is the
Quantum Trend Sniper
Bogdan Ion Puscasu
4.74 (53)
Presentazione       Quantum Trend Sniper Indicator   , l'innovativo indicatore MQL5 che sta trasformando il modo in cui identifichi e scambi le inversioni di tendenza! Sviluppato da un team di trader esperti con un'esperienza di trading di oltre 13 anni,       Indicatore Quantum Trend Sniper       è progettato per spingere il tuo viaggio di trading verso nuove vette con il suo modo innovativo di identificare le inversioni di tendenza con una precisione estremamente elevata. *** Acquista Quantum
PZ Swing Trading MT5
PZ TRADING SLU
5 (5)
Protect against whipsaws: revolutionize your swing trading approach Swing Trading is the first indicator designed to detect swings in the direction of the trend and possible reversal swings. It uses the baseline swing trading approach, widely described in trading literature. The indicator studies several price and time vectors to track the aggregate trend direction and detects situations in which the market is oversold or overbought and ready to correct. [ Installation Guide | Update Guide | Tro
Advanced Supply Demand MT5
Bernhard Schweigert
4.5 (14)
La migliore soluzione per qualsiasi principiante o trader esperto! Questo indicatore è uno strumento di trading unico, di alta qualità e conveniente perché abbiamo incorporato una serie di funzionalità proprietarie e una nuova formula. Con questo aggiornamento, sarai in grado di mostrare fusi orari doppi. Non solo potrai mostrare una TF più alta, ma anche entrambe, la TF del grafico, PIÙ la TF più alta: SHOWING NESTED ZONES. Tutti i trader di domanda di offerta lo adoreranno. :) Informazioni imp
Top indicator for MT5   providing accurate signals to enter a trade without repainting! It can be applied to any financial assets:   forex, cryptocurrencies, metals, stocks, indices .  Watch  the video  (6:22) with an example of processing only one signal that paid off the indicator! MT4 version is here It will provide pretty accurate trading signals and tell you when it's best to open a trade and close it. Most traders improve their trading results during the first trading week with the help of
Questo cruscotto mostra gli ultimi   pattern armonici   disponibili per i simboli selezionati, in modo da risparmiare tempo ed essere più efficienti /   versione MT4 . Indicatore gratuito:   Basic Harmonic Pattern Colonne dell'indicatore Symbol :   vengono visualizzati i simboli selezionati Trend:   rialzista o ribassista Pattern:   tipo di pattern (gartley, butterfly, bat, crab, shark, cypher o ABCD) Entry:   prezzo di ingresso SL:   prezzo di stop loss TP1:   1 prezzo di take profit TP2:
Gartley Hunter Multi
Siarhei Vashchylka
5 (11)
Gartley Hunter Multi - An indicator for searching for harmonic patterns simultaneously on dozens of trading instruments and on all possible timeframes. Manual (Be sure to read before purchasing) | Version for MT4 Advantages 1. Patterns: Gartley, Butterfly, Shark, Crab. Bat, Alternate Bat, Deep Crab, Cypher 2. Simultaneous search for patterns on dozens of trading instruments and on all possible timeframes 3. Search for patterns of all possible sizes. From the smallest to the largest 4. All fou
PZ Support Resistance MT5
PZ TRADING SLU
3.71 (7)
Unlock key market insights with automated support and resistance lines Tired of plotting support and resistance lines? This is a multi-timeframe indicator that detects and plots supports and resistance lines in the chart with the same precision as a human eye would. As price levels are tested over time and its importance increases, the lines become thicker and darker, making price leves easy to glance and evaluate. [ Installation Guide | Update Guide | Troubleshooting | FAQ | All Products ] Boos
Bill Williams Advanced
Siarhei Vashchylka
5 (10)
Bill Williams Advanced is designed for automatic chart analysis using Bill Williams' "Profitunity" system. The indicator analyzes four timeframes at once. Manual (Be sure to read before purchasing) Advantages 1. Analyzes the chart using Bill Williams' "Profitunity" system. Signals are displayed in a table in the corner of the screen and on the price chart. 2. Finds all known AO and AC signals, as well as zone signals. Equipped with a trend filter based on the Alligator. 3. Finds "Divergence Bar
Altri dall’autore
Trend Screener Pro MT5
STE S.S.COMPANY
4.84 (99)
Indicatore di tendenza, soluzione unica rivoluzionaria per il trading di tendenze e il filtraggio con tutte le importanti funzionalità di tendenza integrate in un unico strumento! È un indicatore multi-timeframe e multi-valuta al 100% non ridipingibile che può essere utilizzato su tutti i simboli/strumenti: forex, materie prime, criptovalute, indici e azioni. Trend Screener è un indicatore di tendenza che segue un indicatore efficiente che fornisce segnali di tendenza a freccia con punti nel gra
Trend Screener
STE S.S.COMPANY
4.79 (95)
Indicatore di tendenza, soluzione unica rivoluzionaria per il trading di tendenze e il filtraggio con tutte le importanti funzionalità di tendenza integrate in un unico strumento! È un indicatore multi-timeframe e multi-valuta al 100% non ridipingibile che può essere utilizzato su tutti i simboli/strumenti: forex, materie prime, criptovalute, indici e azioni. OFFERTA A TEMPO LIMITATO: l'indicatore di screening di supporto e resistenza è disponibile a soli 50$ e a vita. (Prezzo originale 250$) (o
Support And Resistance Screener è in un indicatore di livello per MetaTrader che fornisce più strumenti all'interno di un indicatore. Gli strumenti disponibili sono: 1. Screener della struttura del mercato. 2. Zona di ritiro rialzista. 3. Zona di ritiro ribassista. 4. Punti pivot giornalieri 5. Punti pivot settimanali 6. Punti pivot mensili 7. Forte supporto e resistenza basati sul modello e sul volume armonici. 8. Zone a livello di banca. OFFERTA A TEMPO LIMITATO: il supporto HV e l'indicatore
I livelli di supporto o resistenza delle PR si formano quando l'azione dei prezzi di un mercato inverte e cambia direzione, lasciando dietro di sé un picco o un minimo (punto di oscillazione) nel mercato. I livelli di supporto e resistenza possono ritagliarsi range di trading. L'indicatore identifica l'oscillazione alta e l'oscillazione bassa in base alla quantità X di barre (periodo) definita nell'insieme di indicatori. Nota: se ti piace il nostro indicatore dell'azione dei prezzi, prova il
FREE
Support Resistance screnner
STE S.S.COMPANY
4.95 (37)
Support And Resistance Screener è in un indicatore di livello per MetaTrader che fornisce più strumenti all'interno di un indicatore. Gli strumenti disponibili sono: 1. Screener della struttura del mercato. 2. Zona di ritiro rialzista. 3. Zona di ritiro ribassista. 4. Punti pivot giornalieri 5. Punti pivot settimanali 6. Punti pivot mensili 7. Forte supporto e resistenza basati sul modello e sul volume armonici. 8. Zone a livello di banca. OFFERTA A TEMPO LIMITATO: il supporto HV e l'indicatore
L'intervallo medio giornaliero mostra l'intervallo di pip medio di una coppia Forex misurata in un certo numero di periodi. I trader possono utilizzare l'ADR per visualizzare la potenziale azione sui prezzi al di fuori del movimento medio giornaliero. Quando l'ADR è al di sopra della media, significa che la volatilità giornaliera è superiore al normale, il che implica che la coppia di valute potrebbe estendersi oltre la sua norma. Il nostro Analizzatore ADR è composto da 5 caratteristiche prin
Trend Line Map Pro
STE S.S.COMPANY
4.5 (16)
Trend Line Map indicator is an addons for Trend Screener Indicator . It's working as a scanner for all signals generated by Trend screener ( Trend Line Signals ) . It's a Trend Line Scanner based on Trend Screener Indicator.  If you don't have Trend Screener Pro Indicator, the Trend Line Map Pro will not work. LIMITED TIME OFFER : Trend Line Map Indicator is available for only 50 $ and lifetime. ( Original price 125$ ) By accessing to our MQL5 Blog,  you can find all our premium indicators wit
Currency strength meter gives you a quick visual guide to which currencies are currently strong, and which ones are weak. The meter measures the strength of all forex cross pairs and applies calculations on them to determine the overall strength for each individual currency.We calculate based the strength of currency based on the trend of 28 pairs. LIMITED TIME OFFER : Trend CSM Indicator is available for only 50 $. ( Original price 125$ ) By accessing to our MQL5 Blog,  you can find all our p
L'intervallo medio giornaliero mostra l'intervallo di pip medio di una coppia Forex misurata in un certo numero di periodi. I trader possono utilizzare l'ADR per visualizzare la potenziale azione sui prezzi al di fuori del movimento medio giornaliero. Quando l'ADR è al di sopra della media, significa che la volatilità giornaliera è superiore al normale, il che implica che la coppia di valute potrebbe estendersi oltre la sua norma. Il nostro Analizzatore ADR è composto da 5 caratteristiche prin
Ogni trader sa che non dovrebbe mai rischiare più del 5% (o 7%) per operazione.  Questa è una legge sulla gestione del denaro e un LotSize utilizzabile dovrebbe essere calcolato ogni volta perché un trader deve utilizzare un valore StopLoss diverso per diversi livelli di trading.  Questo indicatore calcolerà un LotSize appropriato per il momento in cui lo metterai sul grafico e ogni volta trascinerai la "Stop Loss Line" in qualsiasi direzione. OFFERTA A TEMPO LIMITATO: Tutti i nostri indicato
L'indicatore Boom and Crash Spike Detector è codificato in base a una strategia avanzata principalmente per rilevare il boom e il crash nei prezzi. Algoritmi complessi sono stati impiantati per rilevare boom e crash ad alta probabilità nei prezzi. Avvisa su potenziali fasi di boom o arresto anomalo: Fase boom: quando il prezzo aumenta troppo velocemente. Crash Phase: quando il prezzo diminuisce troppo velocemente. OFFERTA A TEMPO LIMITATO: L'indicatore è disponibile per soli 30$ e per tutta la
Currency Strength Meter, gives you a quick visual guide to which currencies are currently strong, and which ones are weak. The meter measures the strength of all forex cross pairs and applies calculations on them to determine the overall strength for each individual currency. We calculate based the strength of currency based on the trend of 28 pairs. By accessing to our MQL5 Blog,  you can download the   Demo   Version of the indicator. Try it before you buy ,without the Metatrader Tester restr
Ogni trader sa che non dovrebbe mai rischiare più del 5% (o 7%) per operazione.  Questa è una legge sulla gestione del denaro e un LotSize utilizzabile dovrebbe essere calcolato ogni volta perché un trader deve utilizzare un valore StopLoss diverso per diversi livelli di trading.  Questo indicatore calcolerà un LotSize appropriato per il momento in cui lo metterai sul grafico e ogni volta trascinerai la "Stop Loss Line" in qualsiasi direzione. OFFERTA A TEMPO LIMITATO: Tutti i nostri indicato
L'analizzatore di volatilità è un indicatore di momentum, che sfrutta la tendenza del prezzo a scoppiare fortemente dopo essersi consolidato in un range di trading ristretto. L'indicatore utilizza anche un oscillatore del momentum per mostrare la direzione prevista della mossa quando scatta la compressione. Questo istogramma oscilla attorno alla linea dello zero, l'aumento dello slancio al di sopra della linea dello zero indica un'opportunità di acquistare long, mentre lo slancio che scende al
L'indicatore Boom and Crash Spike Detector è codificato in base a una strategia avanzata principalmente per rilevare il boom e il crash nei prezzi. Algoritmi complessi sono stati impiantati per rilevare boom e crash ad alta probabilità nei prezzi. Avvisa su potenziali fasi di boom o arresto anomalo: Fase boom: quando il prezzo aumenta troppo velocemente. Crash Phase: quando il prezzo diminuisce troppo velocemente. OFFERTA A TEMPO LIMITATO: L'indicatore è disponibile per soli 30$ e per tutta la
L'analizzatore di volatilità è un indicatore di momentum, che sfrutta la tendenza del prezzo a scoppiare fortemente dopo essersi consolidato in un range di trading ristretto. L'indicatore utilizza anche un oscillatore del momentum per mostrare la direzione prevista della mossa quando scatta la compressione. Questo istogramma oscilla attorno alla linea dello zero, l'aumento dello slancio al di sopra della linea dello zero indica un'opportunità di acquistare long, mentre lo slancio che scende al
Filtro:
Tran Ky Phat
531
Tran Ky Phat 2024.08.19 00:59 
 

The `Trend Line Map` is very slow and always crashes after some time (it costs the memory about 200mb ~ 500mb RAM). We have to remove and re-add it again. The MT5 log always has the message`2024.08.19 05:29:47.782 Trend Line Map Pro MT5.ex5::Indicators\Market\Trend Line (AUDNZD,H1) indicator is too slow, 3063 ms. rewrite the indicator, please`.

It also always freezes our MT5 and all the chart updates on the MT5 are using it.

We cannot trade on the chart that installs the Map Screener. I asked the Support and did anything they wanted, but the issue was still the same.

In general, The`Trend Line Map Pro` is useless since it always crashes after a few hours.

Besides that the functionality doesn't provide more information compared with the `Trend Screener Pro`, It's just shows everything that displayed on the `Trend Screener Pro`.

So We don't need to buy this add-on

STE S.S.COMPANY
302721
Risposta dello sviluppatore Sayadi Achraf 2024.11.22 15:27
Hi sir, Thank you for taking the time to write your review. The addons depend on the needs of traders. Some traders need a scanner for the arrows and this addon will do the job for us. About performance, as i explained you need to change the max history bar in MT5 to 1000 and download the historical bars of the pairs that you will analyze.
--
I will send you a private message ASAP to assist you how in setting correctly the trend line map indicator in your MT5. Best regards.
isaqueab83
66
isaqueab83 2024.08.06 13:38 
 

I would like to thank Sayadi for the support he gave me regarding my doubts regarding his trading system. He was very attentive and simply a fantastic guy. As for the indicators, they are incredibly accurate. I am very satisfied with everything. I recommend him to everyone! I appreciate your work, Sayad.

STE S.S.COMPANY
302721
Risposta dello sviluppatore Sayadi Achraf 2024.11.22 15:28
Thank you so much for your kind words and thoughtful review! I'm thrilled to hear that I could help address your doubts and that you're satisfied with the trading system and indicators. Your recommendation means a lot to me, and it motivates me to keep providing the best support possible. If you ever need further assistance or have any questions, don’t hesitate to reach out. Wishing you great success in your trading journey!
Natascha Jeske
181
Natascha Jeske 2024.07.23 14:54 
 

Leider nur Verluste, obwohl ich 180 Euro bei diesem Verkäufer abgegeben habe. Signale sind oft sehr falsch. Großartiger Support.

STE S.S.COMPANY
302721
Risposta dello sviluppatore Sayadi Achraf 2024.07.23 16:25
Hi Sir, Thank you for taking the time to write your review. We did not receive any message from you requesting support. I'm contacting you now to check what issue you're facing. We are always available to provide the necessary support for our customers. I believe there might be a misunderstanding about how to use this indicator. It is just an add-on and should not be used alone. Best regards, Sayadi Ashref
Michel
177
Michel 2024.04.12 12:12 
 

For me this is unworkable. Very slow loading/ or not even loading if used with many pairs (which is the reason you want to use it in first place imo). Maybe it is only works on slow pc's seen the positive other reviews. Tried it on high-end pc. After all MT is just a shitty program that was build for 80's.

STE S.S.COMPANY
302721
Risposta dello sviluppatore Sayadi Achraf 2024.04.19 17:00
Hi sir, Thank you for taking the time to write your review. The trend line map indicator is a signal calculator and its not a simple indicator. You need to download the historical data of pairs that you will analyze and also reduce the historical bars in MT5 to 1000. It will work perfectly with you. I'm now sending you a private message to assist you further. Please don't worry, I'm here to offer you all the necessary support. Best regards.
SAYADI Ashref.
$heik @hmed
156
$heik @hmed 2024.01.11 16:37 
 

Another purchase and yes another 5 star product. Well please and does the job very well. Still working out a few thing but getting through like butter. Thank you sir.

Bragnimo
99
Bragnimo 2023.11.02 12:41 
 

This product is excellent. It allows you to screen the market and summarize multi-currency sentiment in a single chart. It will optimize your time and energy by giving you information on new trends forming. The service is 5 stars with great responsiveness and kindness.

Jerry Slagger
92
Jerry Slagger 2023.09.15 21:38 
 

This is an excellent add-on for Trend Screener Pro. I have this, TS Pro, and HH LL setup as a "dashboard" chart. From there, I can identify pairs to trade. Then on another chart, I have SR Pro with Pair Navigator enabled. So I can change charts fast and have the needed indicators on all the charts I change to. Sayadi is awesome and responsive to any question I have. I recommend reviewing the videos and documentation provide multiple times while you learn how to best use this indicator. Then reach out for help as you need it.

JCJ
851
JCJ 2023.04.03 02:48 
 

Nice add on to the trend screener pro

T.J.Sch_318798
228
T.J.Sch_318798 2023.03.02 18:33 
 

This indicator is excellent. It greatly helps you to identify great teading oportunities & trend predictor helps correctly predict the trend and avoid traps. The service provided by Sayadi is amazing. This & trend predictor are excellent choice for having great - safe trading.

pdev
616
pdev 2023.02.06 08:35 
 

L'utente non ha lasciato alcun commento sulla valutazione.

Johan Ferdianto
135
Johan Ferdianto 2022.03.05 18:35 
 

I already have version for MT4, I complete for MT5 too. Great job, good Indicator

Maungfortrading
349
Maungfortrading 2022.02.08 14:15 
 

Best Indicator !!

caichenyi
106
caichenyi 2021.09.06 14:51 
 

I try to run `Trend Screener Pro` and `Trend Line Map` in MT5 at the same time. It can only run for a short time about 15 mins, then the 2 Indicators wouldn't update and the Chart will freeze.

If I close `Trend Line Map`, it works normally.

please help to check this issue. this issue block uses these indicators.

Besides, It's only V5.10, the version is so low than MT4(Trend Line Map).

STE S.S.COMPANY
302721
Risposta dello sviluppatore Sayadi Achraf 2021.09.09 18:26
Hi sir. Thank you for your review. You can't attach 2 screeners in the same chart, you need to have one screener per chart sir. Example :
1. Chart 1 => Trend Screener Pro
2. Chart 2 => Trend Line Map Pro. In this way, you can run both 2 indicators sir to analyze the trend, sir. Please if you have any questions, feel free to contact me, sir. Imporant Note :
- MT4 version is faster because MT4 is much faster in managing multi-currencies data than MT5 sir. - Please make sure that you have historical data available to make the indicator much faster in loading signals. It's a signal calculator and not a simple indicator sir. Best regards.
SAYADI Ashref.
Crypto King
177
Crypto King 2021.01.17 09:08 
 

Another Great product from Mr. Sayadi ! Thank you.

STE S.S.COMPANY
302721
Risposta dello sviluppatore Sayadi Achraf 2021.01.17 09:30
Thx u sir.
Rispondi alla recensione