VWAP Anchor Tool

Anchored VWAP is a lightweight, interactive volume-weighted average price indicator designed for traders who need precision without clutter.

Unlike standard VWAP that resets every session, this tool lets you drop up to five custom anchors directly on any candle. Each anchor calculates VWAP from that exact point forward, complete with standard deviation bands to highlight where price may find support or resistance relative to volume.

Key Features:
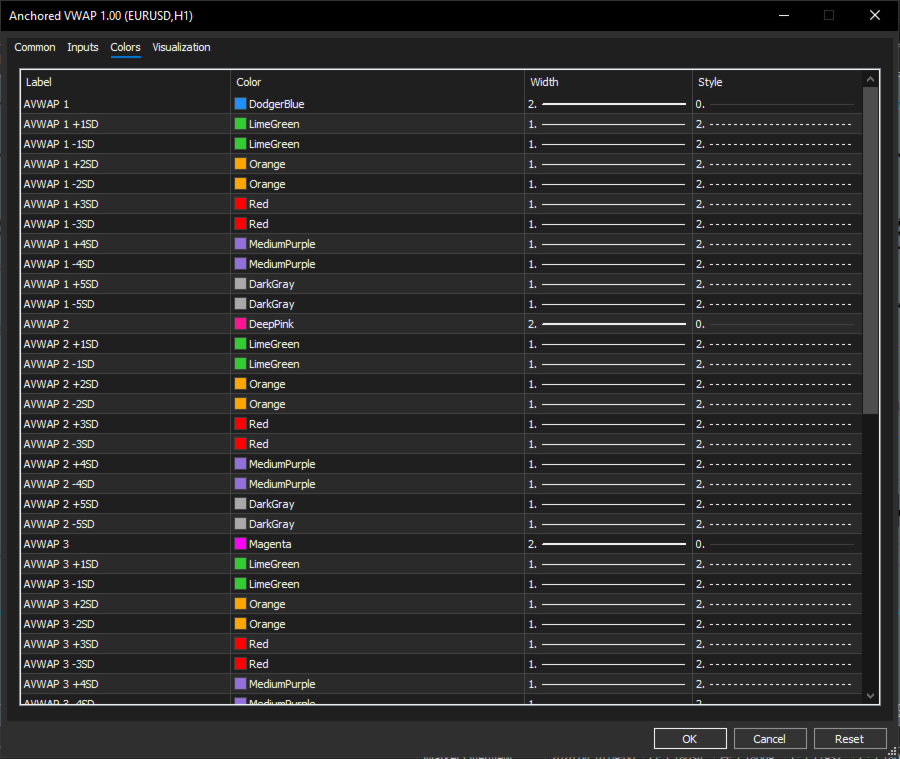
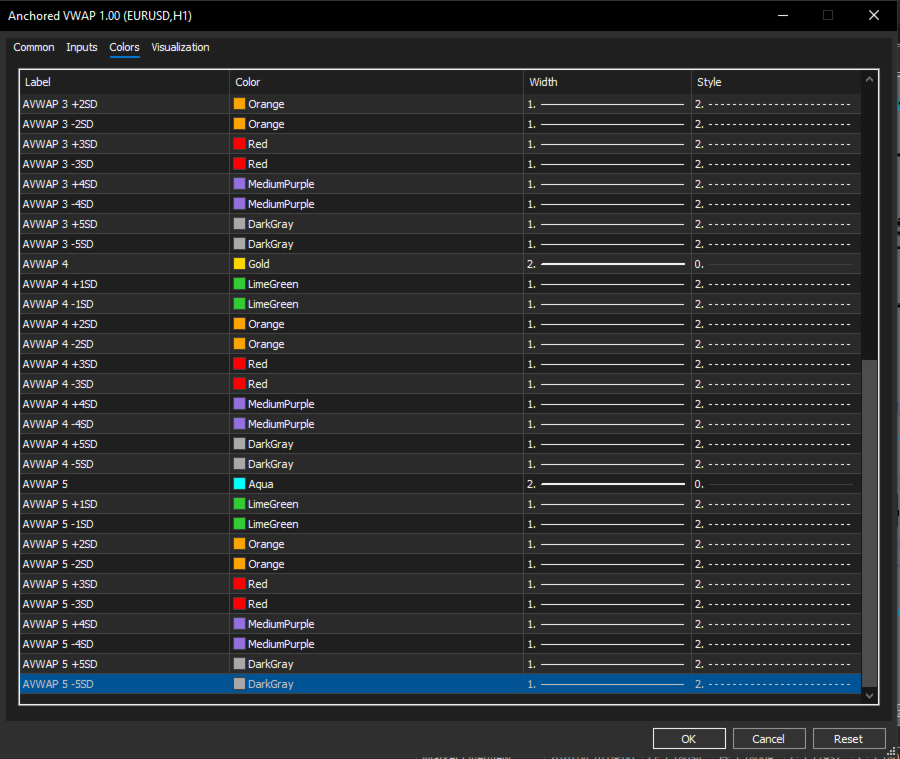
• Up to 5 simultaneous anchors — compare multiple swing points or session opens
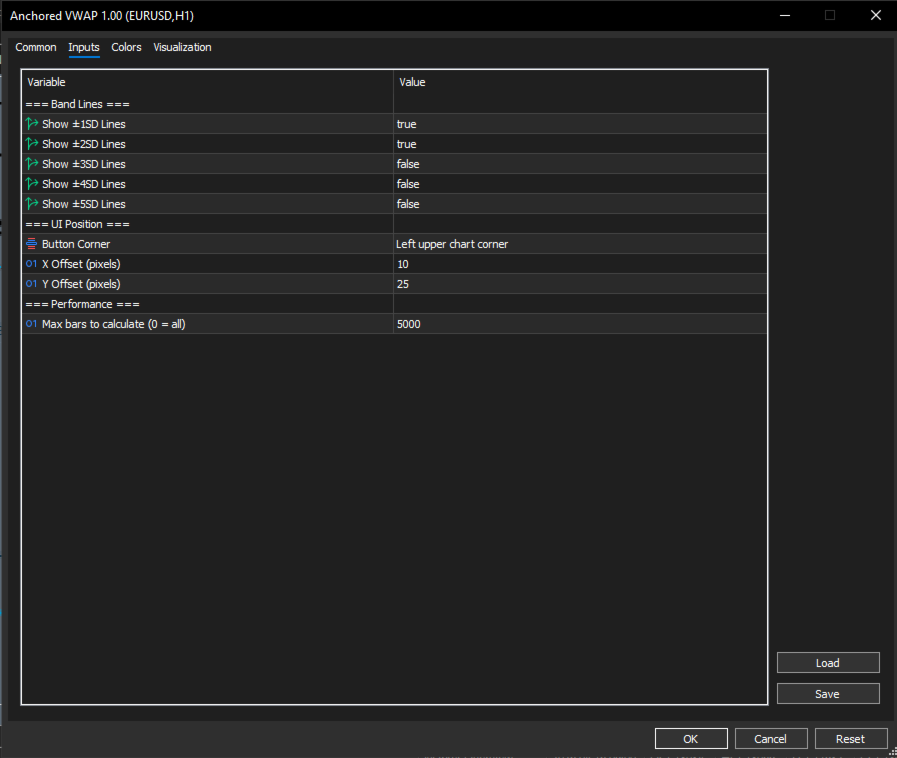
• 5 standard deviation levels per anchor (±1σ through ±5σ) — toggle each band on or off in the inputs
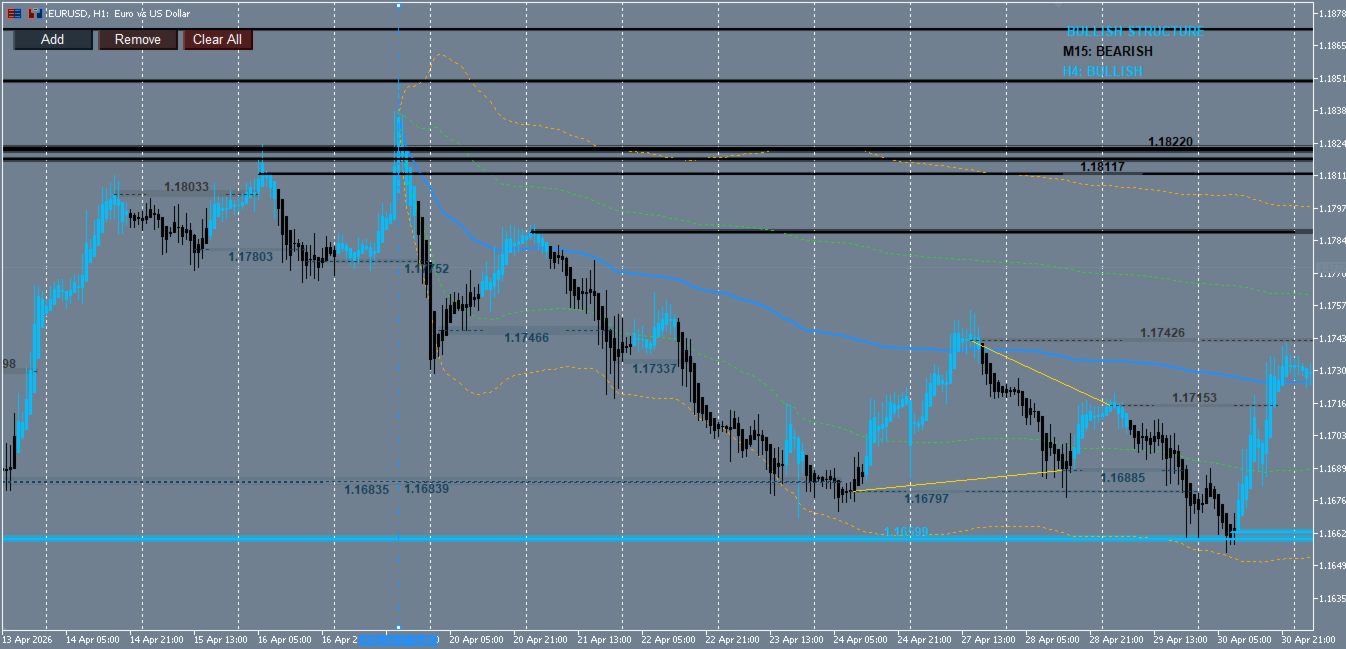
• Interactive chart controls — Add, Remove, and Clear All buttons right on the chart
• Drag any vertical anchor line to recalculate instantly — no need to re-open settings
• Click-to-remove any anchor or band line when Remove mode is active
• Customizable button position — choose any chart corner and set exact X/Y pixel offsets
• Lightning-fast recalculation — no lag when adding, moving, or deleting anchors
• Clean design — no dashboards, no pop-ups, just pure VWAP and bands

How to use:
1. Click "Add" then click any candle to anchor your first VWAP.
2. Drag the vertical dashed line to shift the anchor if needed.
3. Click "Remove" then click any VWAP line or band to delete that anchor.
4. Adjust band visibility and button position in the indicator inputs.

Built for price-action and volume traders who use VWAP to track institutional entries, mean-reversion zones, and breakout levels.
Prodotti consigliati
Swiss VWAPsimple
Terence Gronowski
4.8 (5)
Swiss VWAPsimple Motivation Did not find free VWAP that works, the one that I found craseh. So I created a VWAP which calculates values only for the actual day. So computer resouces are not over stressed. What is VWAP, how is it used?  VWAP stands for Volume Weighed Average Price, it calculates the running sum of tick volume and the runnung sum of price times tickvolume. The division of these sums result in a weighed price (Sum P*V/Sum V). The calculation starts normally at midnight. The values
FREE
Macro-R Pro Signal — Advanced Trading Signal Indicator Macro-R Pro Signal is a professional trading indicator designed to deliver high-quality BUY and SELL signals with enhanced precision and reduced market noise. By combining Bollinger Bands, RSI, and adaptive volatility filtering , this indicator helps traders identify high-probability reversal points while avoiding unfavorable market conditions. How the Strategy Works This indicator is built on a mean reversion + momentum confirmation concep
FREE
VWAP Diaria
Samuel De Souza Ferreira
Daily VWAP — Institutional Reference for Intraday Value The Daily VWAP is a professional indicator based on the Volume-Weighted Average Price (VWAP) , designed to reveal the true balance between price and volume throughout the trading session. Unlike traditional moving averages, the Daily VWAP incorporates the weight of traded volume in every price movement, providing a much more accurate reference to the behavior of institutional traders and large market participants. What the indicator deliver
FREE
Fair Value Gap Zone
Mattia Impicciatore
Descrizione Generale Il Fair Gap Value Indicator individua e mette in evidenza i “fair value gap” sul grafico di MetaTrader 5. Un fair gap si crea quando tra il minimo di una barra e il massimo di un’altra, separate da una barra intermedia, si forma un vuoto di prezzo. L’indicatore disegna rettangoli colorati (rialzisti e ribassisti) per evidenziare queste aree, offrendo un valido supporto visivo nelle strategie di price action. Principali Caratteristiche Rilevamento gap rialzisti : evidenzia ga
FREE
White Weis Volume Ticks
Ricardo Almeida Branco
5 (4)
White Weis Volume This indicator shows the sum of the volume in each wave, bulish or bearish, as idealized by David Weis , but it brings an important addition , which is the marking of the bar with the highest volume of the wave (White Bar)! In coding the indicator, it was sought to optimize the code to require minimal processing during use and not to overload mt5. The indicator can be used for pre-trading analysis and study, where the trader analyzes possible points of support and resistance
Simple Weis Wave
Jean Jacques Huve Ribeiro
3.67 (3)
One of the best tools for analyzing volume, Weis Wave was idelized by David Weis, to facilitate the reading of directional flow. For the VSA method disciples it is an evolution of the practices created by Richard Wycoff, facilitating a predictive reading of the market, always seeking an accumulation and distribution of the negotiated contracts. Cumulative wave volume  Range of wave ( removed) Average Wave volume Ref "Tim Ord lectures" ( removed)
FREE
VWAP Indicator
LUC JACOBUS A VERHEECKE
4.08 (26)
Volume Weighted Average Price (VWAP) The volume weighted average price (VWAP) is a  trading   benchmark  used by traders that gives the average price a security has traded at throughout the day, based on both volume and price. It is important because it provides traders with insight into both the trend and value of a security. This indicator VWAP V2 is free and is the manual version of the extended Easy VWAP indicator (30 Euro), where the date and time properties are automatically entered. With
FREE
My Candle Patterns
Francisco Gomes Da Silva
5 (1)
Questo indicatore è una versione demo di My candle completa che può essere scaricata qui: Candle Patterns Creator Con la versione completa, è possibile creare le proprie regole di candle e modificare un pattern di candle tradizionale per renderlo più preciso in base alla propria strategia. Nell'indicatore sono presenti diverse regole di candle di esempio, ma qui ne mostrerò solo alcune: Pattern Rule Candle Green C > O Candle Red C < O Doji C = O Hammer (C > O and (C-O) *2 < O-L and (C-O) *0.5 >
FREE
The   Pivot Point indicator   automatically calculates and displays the pivot point line and support and resistance levels. Pivot can be calculated according to the Classic, Floor, Fibonacci, Woodie, Camarilla or DeMark formula. It is also possible to select the period for calculating the indicator. A trader can choose from daily, weekly, monthly, or user-defined periods. Types of pivots Classic Floor Fibonacci Woodie Camarilla DeMark Main features The indicator shows the current and historic
FREE
Midas VWAP
Paulo Henrique Faquineli Garcia
4 (2)
Volume Weighted Average Price (VWAP) is a trading benchmark commonly used by Big Players that gives the average price a Symbol has traded throughout the day. It is based on both Volume and price. This indicator contains Daily VWAP and MIDAS' VWAP, which means you are able to anchor the beggining of MIDAS' calculations and, therefore you will be able to use this methodology to study price versus volume moves after anchor point. You will be able to anchor up to 3 HIGH MIDAS VWAP's and 3 LOW. Wish
FREE
Raymond Cloudy Day
The Hung Ngo
5 (3)
Raymond Cloudy Day Indicator for MT5 – Pivot-Based Reversal and Trend Levels Raymond Cloudy Day Indicator is a pivot-based level indicator for MetaTrader 5 (MT5). It was developed by Ngo The Hung based on Raymond’s original idea and is designed to give a structured view of potential reversal zones, trend extensions and support/resistance levels directly on the chart. The default settings are optimised for XAUUSD on the H1 timeframe, but the indicator can be tested and adjusted for other symbols
FREE
Levels of Pivots
Nikolay Mitrofanov
The utility draws reversal levels using the formulas for each of the selected number of candles: Pivot = (high + close + low) / 3 R1 = ( 2 * Pivot) - low S1 = ( 2 * Pivot) - high R2 = Pivot + (R1 -S1) R3 = high + ( 2 * (Pivot - low)) S2 = Pivot - (R1 - S1) S3 = low - ( 2 * (high - Pivot)) H = high L = low U = if the candle is bullish, then close. Otherwise - open D = if the candle is bullish, then open. Otherwise - close On any timeframe. After a new candle closes on the calculated timeframe
FREE
Volume Weighted Average Price or VWAP is an indicator wich shows different average prices on chart. This is very useful to find strong negotiation price areas and as trend following. Configurations: Day, Week and Month - Show different VWAPs according to the period. You can change each line style on "colors" tab. Any doubt or suggestion please contact us. Enjoy! This is a free indicator, but it took hours to develop. If you want to pay me a coffee, I appreciate a lot   <3 PayPal, Skrill, Nete
FREE
DailySessions
Davide Zunino
4.67 (6)
L'indicatore rappresenta i box di sessione per le sessioni Asiatica, Europea e Americana. E' possibile modificare gli orari di ogni sessione, come il colore. E' anche possibile disabilitare a piacimento la visualizzazione di ogni sessione. Trovate nei parametri di input Tab Dati in ingresso le variabili da modificare in formato hh:mm, nel tab Colori i colori da modificare per ogni box.
FREE
VWAP and MVWAP
Flavio Javier Jarabeck
3.88 (8)
Volume Weighted Average Price (VWAP) is a trading benchmark commonly used by Big Players that gives the average price a Symbol has traded throughout the day. It is based on both Volume and price. Additionally we put in this indicator the MVWAP (Moving Volume Weighted Average Price). For those who do not know the usage and the importance od this indicator I recommend a great article about this subject at Investopedia ( https://www.investopedia.com/articles/trading/11/trading-with-vwap-mvwap.asp )
FREE
Pivot Points are a classic technical analysis indicator that calculates the central pivot point (PP) as well as support (S1–S3) and resistance (R1–R3) levels based on the previous day’s High, Low, and Close. The indicator allows you to: • identify key zones where the price may bounce or break through • determine the direction of the trend • find good entry points, as well as set stop loss and take profit levels Indicator settings: • enable/disable PP, R1/S1, R2/S2, R3/S3 • enable/disable price l
FREE
Stackable VWAP
Flavio Javier Jarabeck
3.5 (4)
Volume Weighted Average Price (VWAP) is a trading benchmark commonly used by Big Players that gives the average price a Symbol has traded throughout the day. It is based on both Volume and price. Additionally we put in this indicator the MVWAP (Moving Volume Weighted Average Price). For those who do not know the usage and the importance od this indicator I recommend a great article about this subject at Investopedia ( https://www.investopedia.com/articles/trading/11/trading-with-vwap-mvwap.asp
FREE
Golden Delta Library — Free MT5 Tools Market Description Short Description Golden Delta Library is a free MT5 toolkit for traders who want cleaner chart structure, Renko-based context, risk planning, and practical execution panels. The collection includes Renko indicators, SuperTrend / ADX Renko variants, XAUUSD helper panels, and RiskLab TradeDesk tools. Each product is designed to be lightweight, visual, and useful on live charts without promising automated profits or replacing trader judgme
FREE
Value Chart Candlesticks
Flavio Javier Jarabeck
4.57 (14)
The idea of a Value Chart indicator was presented in the very good book I read back in 2020 , " Dynamic Trading Indicators: Winning with Value Charts and Price Action Profile ", from the authors Mark Helweg and David Stendahl. The idea is simple and the result is pure genius: Present candlestick Price analysis in a detrended way! HOW TO READ THIS INDICATOR Look for Overbought and Oversold levels. Of course, you will need to test the settings a lot to find the "correct" one for your approach. It
FREE
Amiguinhos Bar Counter
Eduardo Correia Da Silva
3.67 (3)
Amiguinho's Bar Counter is a price action indicator to display the bar count (candles) with some interesting options. About the "Period of analysis" parameter: if the current timeframe is in minutes, then the analysis period will be considered in days; if the current timeframe is in days, then the analysis period will be considered in months; or  if the period of analysis will be considered in years.
FREE
MIDAS Super VWAP
Flavio Javier Jarabeck
4.27 (11)
Imagine VWAP, MVWAP and MIDAS in one place... Well, you found it! Now you can track the movement of Big Players in various ways, as they in general pursue the benchmarks related to this measuring, gauging if they had good execution or poor execution on their orders. Traders and analysts use the VWAP to eliminate the noise that occurs throughout the day, so they can measure what prices buyers and sellers are really trading. VWAP gives traders insight into how a stock trades for that day and deter
FREE
Basic Vwap
james mugendi
4 (1)
Simple Vwap with the daily, weekly and monthly VWAP is the abbreviation for   volume-weighted average price , which is a technical analysis tool that shows the ratio of an asset's price to its total trade volume. It provides traders and investors with a measure of the average price at which a stock is traded over a given period of time. How it's used Identify entry and exit points:   Traders can use VWAP to determine when to buy or sell an asset.   Understand price trends :  Traders can use V
FREE
The selective pin bar is designed to identify reversals. To use the selective pin bar effectively, traders typically look for Strong Rejection: The tail of the pin bar should extend significantly beyond the surrounding price action. It indicates that there was a sharp rejection of higher or lower prices during the trading period. A strong rejection suggests that the market sentiment may be changing.
FREE
The indicator highlights the points that a professional trader sees in ordinary indicators. VisualVol visually displays different volatility indicators on a single scale and a common align. Highlights the excess of volume indicators in color. At the same time, Tick and Real Volume, Actual range, ATR, candle size and return (open-close difference) can be displayed. Thanks to VisualVol, you will see the market periods and the right time for different trading operations. This version is intended f
FREE
B2U Market State System Part of the B2U Market State System A professional indicator suite designed to analyze market structure, trend state, and momentum. B2U Market State System 의 구성 요소입니다. 시장 구조, 추세 상태, 모멘텀을 입체적으로 분석하기 위한 전문 인디케이터 시스템입니다. Highlights structurally validated reaction zones after FVG inversion. The New Generation of Inversion Fair Value Gaps B2U IFVG BOX & Zone visually analyzes market reaction zones formed after Fair Value Gap (FVG) inversion. 차세대 Inversion Fair Value Gaps FVG 반
FREE
L'Anchored VWAP è una variazione del VWAP tradizionale, in cui il calcolo dell'indicatore inizia da un punto specifico nel tempo (l'ancora), invece di essere calcolato dall'inizio della sessione di negoziazione o da un intervallo di tempo fisso. Questo può essere utile per i trader che desiderano valutare il comportamento del prezzo in relazione al volume a partire da eventi specifici, come una notizia importante, l'inizio di una tendenza o un evento tecnico, come il superamento di un livello di
Volume Statistic
Syamsurizal Dimjati
5 (1)
Ritz Volume Statistic – Color Volume Histogram & Market Flow Insight Ritz Volume Statistic is a clean and powerful volume analysis indicator designed to visualize bullish and bearish market pressure through a dynamic color-graded volume histogram . The indicator transforms raw tick volume into an intuitive color spectrum , allowing traders to instantly identify volume expansion, exhaustion, and dominance shifts between buyers and sellers. A built-in statistical panel summarizes total volume, bul
FREE
Each VolumeProfile holds: The price range for a given period Buy/sell volume for each price level Calculated POC, VAH, VAL, Delta, and Imbalance Indicator Logic Summary Divide data by timeframe (e.g., one H1 profile per hour). Aggregate volumes for each price level. Separate buy and sell volumes using tick or trade direction. Compute Delta (Buy − Sell) and Imbalance (dominance ≥70%). Detect POC, VAH, VAL to outline the Value Area. Draw graphical profiles beside price candles using color-co
AliPivot Points is a Meta Trader 5 Indicator that draws you the latest pivot points. You can choose from timeframes ranging from 1 Minute to 1 Month. Calculation methods for pivot points includes: Classic Pivot Points Camarilla Pivot Points Fibonacci Pivot Points Woodie Pivot Points You can personalize the line colors, style, and width to suit your preference. The indicator displays values on the right side of the chart. AliPivot Points values can also be utilized by developers for creating Expe
FREE
Pivot Point Multi-Method with Dashboard This indicator is a technical analysis tool designed to calculate and display horizontal support and resistance levels based on various Pivot Point methodologies. It is built using the MQL5 Canvas library, ensuring efficient performance and a clean visual presentation on the chart. The tool calculates levels using the data from the previous completed candle of a user-defined reference timeframe. This ensures that the levels remain fixed for the duration of
FREE
Gli utenti di questo prodotto hanno anche acquistato
ARIPoint
Temirlan Kdyrkhan
ARIPoint is a powerful trading companion designed to generate high-probability entry signals with dynamic TP/SL/DP levels based on volatility. Built-in performance tracking shows win/loss stats, PP1/PP2 hits, and success rates all updated live. Key Features: Buy/Sell signals with adaptive volatility bands Real-time TP/SL/DP levels based on ATR Built-in MA Filter with optional ATR/StdDev volatility Performance stats panel (Success, Profit/Loss, PP1/PP2) Alerts via popup, sound, push, or email Cu
SuperScalp Pro
Van Minh Nguyen
4.63 (24)
SuperScalp Pro – Sistema avanzato di indicatore scalping multi-filtro SuperScalp Pro è un indicatore di scalping avanzato che combina il classico Supertrend con molteplici filtri intelligenti di conferma per aiutare a identificare opportunità di trading. Funziona in modo efficiente su diversi timeframe da M1 a H4, con prestazioni ottimizzate su XAUUSD, BTCUSD e principali coppie Forex. L’indicatore fornisce chiari segnali Buy e Sell, insieme a livelli di ingresso, stop loss e take profit calcola
Entry In The Zone and SMC Multi Timeframe is a real-time 2-in-1 market analysis tool that combines market structure analysis and a No Repaint BUY / SELL signal system into a single indicator, built on Smart Money Concepts (SMC) — a widely adopted framework used by professional traders to understand market structure. This indicator helps you see the market more clearly, make decisions based on structure rather than guesswork, and focus on high-probability zones where price is more likely to react
Divergence Bomber
Ihor Otkydach
4.9 (88)
Ogni acquirente dell’indicatore riceverà inoltre gratuitamente: L’utilità esclusiva “Bomber Utility”, che gestisce automaticamente ogni operazione, imposta i livelli di Stop Loss e Take Profit e chiude le posizioni secondo le regole della strategia I file di configurazione (set file) per adattare l’indicatore a diversi asset I set file per configurare il Bomber Utility in tre modalità: “Rischio Minimo”, “Rischio Bilanciato” e “Strategia di Attesa” Una guida video passo-passo per installare, conf
Gold Entry Sniper
Tahir Mehmood
5 (9)
Gold Entry Sniper – Dashboard ATR Multi-Timeframe per Scalping e Swing Trading sull’Oro Gold Entry Sniper è un indicatore avanzato per MetaTrader 5 che offre segnali di acquisto/vendita precisi per XAUUSD e altri strumenti, basato sulla logica ATR Trailing Stop e l' analisi multi-timeframe . Caratteristiche e Vantaggi Analisi Multi-Timeframe – Visualizza trend su M1, M5, M15 in un'unica dashboard. Trailing Stop Basato su ATR – Stop dinamici che si adattano alla volatilità. Dashboard Professional
Power Candles MT5
Daniel Stein
5 (8)
Power Candles V3 - Indicatore di forza ad ottimizzazione automatica Power Candles V3 trasforma la forza delle valute e degli strumenti in un piano di trading attuabile su ogni grafico a cui è collegato. Invece di limitarsi a colorare le candele, esegue un'auto-ottimizzazione in tempo reale in background e ti fornisce i migliori valori di Stop Loss, Take Profit e soglia di segnale per il simbolo che hai davanti. Basta un clic per adottarlo nel trading live: i raggi di ingresso, Stop Loss e Take P
SignalTech MT5 is a fully rule based trading system for EURUSD, USDCHF, USDJPY, AUDUSD, NZDUSD, EURJPY, AUDJPY, NZDJPY, CADJPY.  All the winning trades with chart setups are published on the comments page. 2025-12 1174 Pips 2026-01 2624 Pips 2026-02 2937 Pips 2026-03 2165 Pips 2026-04 2243 Pips It can generate signals with Buy/Sell Arrows and Pop-Up/Sound Alerts. Each signal has clear Entry and Stop Loss levels, which should be automatically flagged on the chart, as well as potential Targets 1,
Presentazione       Quantum Breakout PRO   , l'innovativo indicatore MQL5 che sta trasformando il modo in cui scambi le zone di breakout! Sviluppato da un team di trader esperti con un'esperienza di trading di oltre 13 anni,       Quantum Breakout PRO       è progettato per spingere il tuo viaggio di trading a nuovi livelli con la sua strategia innovativa e dinamica della zona di breakout. Quantum Breakout Indicator ti fornirà frecce di segnalazione sulle zone di breakout con 5 zone target di
Azimuth Pro
Ottaviano De Cicco
5 (7)
Azimuth Pro V2: Synthetic Fractal Structure and Confirmed Entries for MT5 Overview Azimuth Pro is a multi-level swing structure indicator by Merkava Labs . Four nested swing layers, swing-anchored VWAP, ABC pattern detection, three-timeframe structural filtering, and closed-bar confirmed entries — one chart, one workflow from micro-swings to macro-cycles. This is not a blind signal product. It is a structure-first workflow for traders who care about location, context, and timing. V2 Launch Offe
Gann Made Easy è un sistema di trading Forex professionale e facile da usare che si basa sui migliori principi del trading utilizzando la teoria di mr. WD Gann. L'indicatore fornisce segnali ACQUISTA e VENDI accurati, inclusi i livelli di Stop Loss e Take Profit. Puoi fare trading anche in movimento utilizzando le notifiche PUSH. CONTATTAMI DOPO L'ACQUISTO PER RICEVERE GRATUITAMENTE LE ISTRUZIONI DI TRADING E OTTIMI INDICATORI EXTRA! Probabilmente hai già sentito parlare molte volte dei metodi d
RelicusRoad Pro MT5
Relicus LLC
4.96 (24)
RelicusRoad Pro: Sistema Operativo Quantitativo di Mercato 70% DI SCONTO ACCESSO A VITA (TEMPO LIMITATO) - UNISCITI A 2.000+ TRADER Perché la maggior parte dei trader fallisce anche con indicatori "perfetti"? Perché operano su Singoli Concetti isolati. Un segnale senza contesto è una scommessa. Per vincere serve CONFLUENZA . RelicusRoad Pro non è un semplice indicatore. È un Ecosistema Quantitativo completo . Mappa la "Fair Value Road", distinguendo tra rumore e rotture strutturali. Smetti di in
Rilevatore intelligente multistrato di breakout e pullback per MetaTrader 5 "Intelligente. Semplice. Veloce!" Sei stanco di perdere entrate su breakout ad alta probabilità? Passi ore a scansionare più grafici, cercando di allineare i breakout con la direzione del trend e il momentum delle valute — solo per perdere il movimento? Break Pullback risolve tutto questo con un solo indicatore. Cos'è Break Pullback? Break Pullback è un indicatore MetaTrader 5 di livello professionale, progettato speci
Se acquisti questo indicatore, riceverai il mio Trade Manager Professionale + EA  GRATUITAMENTE. Innanzitutto è importante sottolineare che questo sistema di trading è un indicatore Non-Repainting, Non-Redrawing e Non-Lagging, il che lo rende ideale sia per il trading manuale che per quello automatico. Corso online, manuale e download di preset. Il "Sistema di Trading Smart Trend MT5" è una soluzione completa pensata sia per i trader principianti che per quelli esperti. Combina oltre 10 indicat
Atomic Analyst MT5
Issam Kassas
3.94 (31)
Innanzitutto, vale la pena sottolineare che questo indicatore di trading non è repaint, non è ridisegno e non presenta ritardi, il che lo rende ideale sia per il trading manuale che per quello automatico. Manuale utente: impostazioni, input e strategia. L'Analista Atomico è un indicatore di azione del prezzo PA che utilizza la forza e il momentum del prezzo per trovare un miglior vantaggio sul mercato. Dotato di filtri avanzati che aiutano a rimuovere rumori e segnali falsi, e aumentare il pote
Quantum TrendPulse
Bogdan Ion Puscasu
5 (25)
Ecco   Quantum TrendPulse   , lo strumento di trading definitivo che combina la potenza di   SuperTrend   ,   RSI   e   Stocastico   in un unico indicatore completo per massimizzare il tuo potenziale di trading. Progettato per i trader che cercano precisione ed efficienza, questo indicatore ti aiuta a identificare con sicurezza le tendenze di mercato, i cambiamenti di momentum e i punti di entrata e uscita ottimali. Caratteristiche principali: Integrazione SuperTrend:   segui facilmente l'andame
FX Trend MT5 NG
Daniel Stein
5 (4)
FX Trend NG: La Nuova Generazione di Intelligenza di Trend Multi-Mercato Panoramica FX Trend NG è uno strumento professionale di analisi del trend multi-timeframe e monitoraggio dei mercati. Ti consente di comprendere la struttura completa del mercato in pochi secondi. Invece di passare tra numerosi grafici, puoi identificare immediatamente quali strumenti sono in trend, dove il momentum sta diminuendo e dove esiste un forte allineamento tra i timeframe. Offerta di Lancio – Ottieni FX Trend NG
Btmm state engine pro
Garry James Goodchild
5 (4)
BTMM State Engine Pro is a MetaTrader 5 indicator for traders who use the Beat The Market Maker approach: Asian session context, kill zone timing, level progression, peak formation detection, and a multi-pair scanner from a single chart. It combines cycle state logic with a built-in scanner dashboard so you do not need the same tool on many charts at once. What it does Draws the Asian session range; session times can follow broker server offset or be set in inputs. Tracks level progression (L
Market Structure Order Block Dashboard MT5 è un indicatore MT5 progettato per i trader che vogliono leggere la struttura di mercato e le principali zone di reazione del prezzo direttamente sul grafico. Combina BOS, ChoCH, Order Blocks, Fair Value Gaps (FVG), Liquidità, Kill Zones, Volume Profile e un pannello compatto per un'analisi rapida. Questo indicatore è rivolto ai trader che utilizzano la struttura di mercato, i concetti ICT e Smart Money come quadro decisionale. Può aiutare a individuare
Innanzitutto, vale la pena sottolineare che questo Strumento di Trading è un Indicatore Non-Ridipingente, Non-Ridisegnante e Non-Laggante, il che lo rende ideale per il trading professionale. Corso online, manuale utente e demo. L'Indicatore Smart Price Action Concepts è uno strumento molto potente sia per i nuovi che per i trader esperti. Racchiude più di 20 utili indicatori in uno solo, combinando idee di trading avanzate come l'Analisi del Trader del Circolo Interno e le Strategie di Tradin
OrderFlux | Footprint Orderflow per MetaTrader 5 Versione 2.0 – Visualizzazione Bid/Ask in tempo reale per Trader Attivi OrderFlux è un indicatore di footprint e orderflow per MT5. Non mostra solo dove si è mosso il prezzo, ma cosa succede all'interno del movimento: volume Bid/Ask per livello di prezzo, delta, imbalance e distribuzione del volume. Molti grafici ti mostrano solo il risultato finale di una candela. OrderFlux ti mostra il percorso per arrivarci. Questo è esattamente ciò che aiuta q
Grabber System MT5
Ihor Otkydach
4.83 (23)
Ti presento un eccellente indicatore tecnico: Grabber, che funziona come una strategia di trading "tutto incluso", pronta all’uso. In un solo codice sono integrati strumenti potenti per l’analisi tecnica del mercato, segnali di trading (frecce), funzioni di allerta e notifiche push. Ogni acquirente di questo indicatore riceve anche gratuitamente: L’utility Grabber: per la gestione automatica degli ordini aperti Video tutorial passo dopo passo: per imparare a installare, configurare e utilizzare
Crystal Heikin Ashi Signals
Muhammad Jawad Shabir
5 (2)
Crystal Heikin Ashi Signals - Professional Trend & Signal Detection Indicator Advanced Heikin Ashi Visualization with Intelligent Signal System for Manual & Automated Trading Final Price: $149 ---------> Price goes up $10 after every 10 sales . Limited slots available — act fast . Overview Crystal Heikin Ashi Signals is a professional-grade MetaTrader 5 indicator that combines pure Heikin Ashi candle visualization with an advanced momentum-shift detection system. Designed for both manual traders
Cominciamo con la verità. Nessun indicatore da solo ti renderà profittevole. Se qualcuno ti dice il contrario, ti sta vendendo un sogno. Qualsiasi indicatore che mostra frecce perfette di acquisto/vendita può essere reso impeccabile — basta ingrandire la giusta sezione della storia e catturare solo i trade vincenti. Noi non lo facciamo.  SMC Intraday Formula è uno strumento. Legge la struttura del mercato per te, identifica le zone a più alta probabilità e ti mostra esattamente come appare la t
L'indicatore " Dynamic Scalper System MT5 " è progettato per il metodo di scalping, ovvero per il trading all'interno di onde di trend. Testato sulle principali coppie di valute e sull'oro, è compatibile con altri strumenti di trading. Fornisce segnali per l'apertura di posizioni a breve termine lungo il trend, con ulteriore supporto al movimento dei prezzi. Il principio dell'indicatore. Le frecce grandi determinano la direzione del trend. Un algoritmo per generare segnali per lo scalping sott
Questo cruscotto mostra gli ultimi   pattern armonici   disponibili per i simboli selezionati, in modo da risparmiare tempo ed essere più efficienti /   versione MT4 . Indicatore gratuito:   Basic Harmonic Pattern Colonne dell'indicatore Symbol :   vengono visualizzati i simboli selezionati Trend:   rialzista o ribassista Pattern:   tipo di pattern (gartley, butterfly, bat, crab, shark, cypher o ABCD) Entry:   prezzo di ingresso SL:   prezzo di stop loss TP1:   1 prezzo di take profit TP2:
Meridian Pro
Ottaviano De Cicco
5 (2)
Meridian Pro 2.00: Professional Multi-Timeframe Trend Matrix for MT5 Meridian Pro 2.00 is a professional adaptive trend matrix for MetaTrader 5. It combines the original Meridian trend engine, a clean chart ribbon, closed-bar signal arrows, an 8-timeframe dashboard, Fuel momentum, weighted consensus, synthetic HTF processing and chart-native higher-timeframe context lines. The goal is simple: read current trend, multi-timeframe structure, strength, momentum and EA-ready state from one discipline
OmniSync Projection
Antonio-alin Teculescu
5 (1)
Chronos Fractal Engine is an innovative price projection indicator for MetaTrader 5, designed to transform your technical analysis by intelligently identifying and projecting historical price patterns. Built upon an advanced correlation algorithm and the fractal principles of the market, this powerful tool visualizes potential future price movements, giving you a unique edge in your trading decisions. What is Chronos Fractal Engine? At its core, the Chronos Fractal Engine employs a sophisticat
FX Power MT5 NG
Daniel Stein
5 (31)
FX Power: Analizza la Forza delle Valute per Decisioni di Trading Più Intelligenti Panoramica FX Power è lo strumento essenziale per comprendere la reale forza delle principali valute e dell'oro in qualsiasi condizione di mercato. Identificando le valute forti da comprare e quelle deboli da vendere, FX Power semplifica le decisioni di trading e rivela opportunità ad alta probabilità. Che tu segua le tendenze o anticipi inversioni utilizzando valori estremi di Delta, questo strumento si adatta
FX Levels MT5
Daniel Stein
5 (13)
FX Levels: Supporti e Resistenze di Precisione Eccezionale per Tutti i Mercati Panoramica Rapida Cercate un modo affidabile per individuare livelli di supporto e resistenza in ogni mercato—coppie di valute, indici, azioni o materie prime? FX Levels fonde il metodo tradizionale “Lighthouse” con un approccio dinamico all’avanguardia, offrendo una precisione quasi universale. Basato sulla nostra esperienza reale con i broker e su aggiornamenti automatici giornalieri più quelli in tempo reale, FX
Market Structure Patterns
Samuel Manoel De Souza
4.47 (19)
Market Structure Patterns   è un indicatore basato sui   Smart Money Concepts   che mostra gli   elementi SMC/ICT   che possono portare le tue decisioni di trading a un livello superiore. Approfitta di   alert ,   notifiche push   e   email   per essere avvisato quando si forma un elemento sul grafico, il prezzo supera un livello e/o entra in una zona. Gli sviluppatori possono accedere ai valori degli elementi dell’indicatore utilizzando le   variabili globali , consentendo l’automazione delle
Altri dall’autore
Adaptive Alpha EMA
Jackson Mukurani Wanguthi
Adaptive Alpha EMA is a next-generation trend indicator that revolutionizes the classic EMA crossover by introducing real-time volatility responsiveness. Unlike traditional EMAs that rely on static periods, Adaptive Alpha EMA measures volatility speed through ATR (Average True Range) and automatically scales the alpha (smoothing factor) of both fast and slow EMAs. The result is an indicator that tightens during low-volatility consolidation and expands during explosive trend moves — delivering e
FREE
Market Pulse Dashboard
Jackson Mukurani Wanguthi
A clean, information-dense dashboard that sits on your chart and answers the five questions every trader should ask before pulling the trigger: 1) What am I looking at? — Symbol, timeframe, live spread in points and pips. 2) When am I trading? — Active forex session with overlap detection, candle countdown timer, broker server time (auto-detected UTC offset, DST-proof), and your local time. 3) How much should this move? — 5 configurable ATR multiplier rows for quick SL/TP sizing, plus Daily,
FREE
Time Period Labels
Jackson Mukurani Wanguthi
TimePeriodLabels – See where new periods start on any chart A clean indicator that draws vertical lines and labels when a new year, month, week or day begins. No more squinting at dates or placing manual lines every time you open a chart. Each period type has its own colour and style so you instantly know what changed. What it does Detects when the day, week, month or year flips on the current timeframe. Draws a vertical line at the first bar of the new period. Adds a text label (for day, month
FREE
UniversalLevelAlert
Jackson Mukurani Wanguthi
UniversalLevelAlert is a free, lightweight MT5 chart indicator that combines price-level alerts with multi-timeframe candle-close alerts — all in one tool. What it does: Price Alerts: Set up to 5 horizontal alert lines directly on the chart. Drag them visually to adjust levels. Get notified when price comes within a trigger distance. Candle-Close Alerts: Monitor up to 5 timeframes simultaneously. Get alerted the moment a candle closes on any chosen timeframe, with bullish/bearish classification
FREE
SmartFlow Consensus
Jackson Mukurani Wanguthi
SmartFlow Consensus is a chart overlay indicator designed for traders who need a clean, structural view of price action without clutter. It filters market noise through an internal consensus engine and renders the result directly onto the chart as intuitive color-coded candles, price zones, and trend structure lines. Built for traders who make decisions from structure rather than guesswork, it combines fractal-based zone detection, multi-layer consensus filtering, and market structure tracking
SmartFlow Kalman Consensus
Jackson Mukurani Wanguthi
SmartFlow Kalman Consensus SmartFlow Kalman Consensus is an advanced market structure and trend analysis tool designed to deliver a clean, noise-free view of price behavior. Built for traders who focus on structure, flow, and precision, it simplifies complex market movement into clear, actionable insight. What It Does Filters out market noise to reveal true directional bias Identifies key reaction zones where price is likely to respond Tracks real-time trend shifts with high clarity Aligns stru
ACE Signals
Jackson Mukurani Wanguthi
ACE Signals Adaptive Confluence Engine — Precision Entry Signals Through Multi-Layer Validation Tired of repainting arrow indicators that fire late, whipsaw in chop, and leave you holding the bag? Most signal indicators rely on a single condition — a moving average cross, an RSI spike, or a price pattern. In volatile markets, that is not enough. ACE Signals was engineered from the ground up to eliminate false entries by requiring three independent layers of market intelligence to align before a
Institutional Zones Pro
Jackson Mukurani Wanguthi
Manually drawing support and resistance levels takes time, and no two traders mark the same spots. Institutional Zones Pro solves this by automatically calculating and displaying key levels as zones on your chart. Instead of thin lines, it draws areas where price has historically reacted. Active zones remain visible and extend forward. When price moves through a zone, it updates to show the level is no longer active. This keeps your chart clean and tells you at a glance which areas still matter
Filtro:
Nessuna recensione
Rispondi alla recensione