Account and Trading Dashboard

Account and Trading Dashboard Indicator

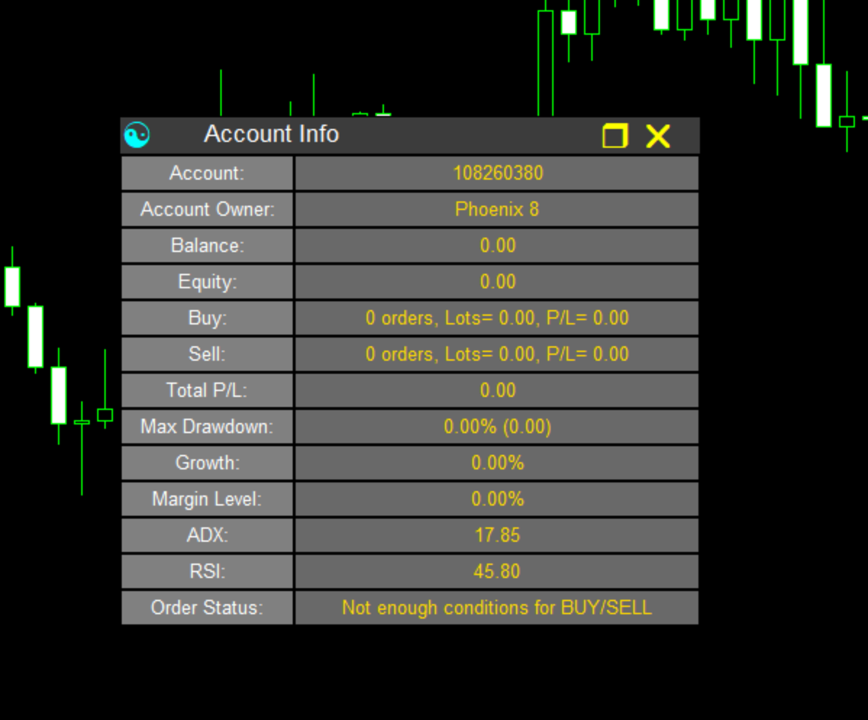
The **Account and Trading Dashboard** is a custom MetaTrader 5 (MT5) indicator designed to provide traders with a comprehensive, real-time overview of their account metrics, trading statistics, and technical indicators directly on the chart. It displays essential financial and performance data in a draggable, minimizable, and closable panel, enhancing usability without cluttering the workspace. The indicator supports optional features like ADX and RSI for market analysis and order status signals, while persisting drawdown and growth data via global variables for long-term tracking.

Key Features:
- Account Information Display:
  - Shows account number and owner name.
  - Real-time balance and equity values.
  - Optional margin level percentage (calculated as Equity / Used Margin * 100).

- Trading Statistics:
  - Buy and Sell position summaries, including the number of orders, total lots, and profit/loss (P/L) for each side.
  - Optional total P/L across all open positions in the account.

- Performance Metrics:
  - Maximum drawdown percentage and absolute amount (based on peak equity).
  - Account growth percentage (relative to initial balance).
  - Data persistence: Drawdown and growth are stored in global variables, allowing stats to carry over across sessions. Includes a reset option to clear these values.

- Technical Indicators Integration:
  - Optional ADX (Average Directional Index) with customizable period and threshold (default: 14 periods, threshold 25.0).
  - Optional RSI (Relative Strength Index) with customizable period, applied price, oversold/overbought levels (default: 14 periods, PRICE_CLOSE, oversold 30.0, overbought 70.0).
  - Values are color-coded for quick interpretation (e.g., ADX above threshold in blue, RSI in oversold zone in blue, overbought in red).

- Order Status Signal:
  - Dynamic status based on ADX and RSI: "Buy Zone" (if ADX > threshold and RSI < oversold), "Sell Zone" (if ADX > threshold and RSI > overbought), or "Not enough conditions for BUY/SELL" otherwise.
  - Highlighted with green (Buy) or red (Sell) backgrounds for visual alerts.

- User Interface and Customization:
  - Modern panel UI with a header, fields, and values in a tabular format.
  - Draggable panel for custom positioning on the chart.
  - Minimizable (toggle to show only header) and closable via buttons.
  - Hover effects on buttons and header for improved interactivity.
  - Customizable inputs: Corner position, distances, font, colors, line spacing, and feature toggles (e.g., show/hide margin level, ADX, RSI, P/L).
  - Supports mouse events for smooth interaction without interfering with chart scrolling.

- Technical Details:
  - Runs as an indicator on the chart window (no drawing plots, uses a dummy buffer).
  - Compatible with all symbols and timeframes.
  - Handles for ADX and RSI are created dynamically if enabled.
  - Efficient updates in OnCalculate() for real-time refreshes.
  - Deinitialization cleans up objects and releases handles.

This indicator is ideal for traders seeking a centralized dashboard for monitoring account health, position performance, and basic technical signals, all while maintaining a clean and interactive chart environment.

Prodotti consigliati
Value Chart Candlesticks
Flavio Javier Jarabeck
4.69 (13)
The idea of a Value Chart indicator was presented in the very good book I read back in 2020 , " Dynamic Trading Indicators: Winning with Value Charts and Price Action Profile ", from the authors Mark Helweg and David Stendahl. The idea is simple and the result is pure genius: Present candlestick Price analysis in a detrended way! HOW TO READ THIS INDICATOR Look for Overbought and Oversold levels. Of course, you will need to test the settings a lot to find the "correct" one for your approach. It
FREE
Statistical Arbitrage Spread Generator for Cointegration [MT5] What is Pair Trading? Pair trading is a market-neutral strategy that looks to exploit the relative price movement between two correlated assets — instead of betting on the direction of the market. The idea? When two assets that usually move together diverge beyond a statistically significant threshold, one is likely mispriced. You sell the expensive one, buy the cheap one , and profit when they converge again. It’s a statistica
FREE
PZ Penta O MT5
PZ TRADING SLU
3.5 (4)
The Penta-O is a 6-point retracement harmonacci pattern which usually precedes big market movements. Penta-O patterns can expand and repaint quite a bit. To make things easier this indicator implements a twist: it waits for a donchian breakout in the right direction before signaling the trade. The end result is an otherwise repainting indicator with a very reliable trading signal. The donchian breakout period is entered as an input. [ Installation Guide | Update Guide | Troubleshooting | FAQ | A
FREE
ZumikoFx Trading Stats
Michal Piotr Kochanski
ZumikoFX Trading Stats - Professional Account Dashboard Overview ZumikoFX Trading Stats is a comprehensive, real-time account monitoring dashboard designed for serious traders who need complete visibility of their trading performance. This indicator displays all crucial trading statistics in an elegant, easy-to-read panel positioned in the top-right corner of your chart. Key Features Complete Account Monitoring Balance & Equity - Real-time account status with current balance and equity includ
FREE
https://www.mql5.com/en/users/gedeegi/seller    The GEN indicator is a multifunctional technical analysis tool for the MetaTrader 5 (MT5) platform. It is designed to automatically identify and display key Support and Resistance (S&R) levels and detect False Breakout signals, providing clear and visual trading cues directly on your chart. Its primary goal is to help traders identify potential price reversal points and avoid market traps when the price fails to decisively break through key levels
FREE
Coral Indi
Dinh Duong Luong
Coral trend is   a trend-following indicator that is widely popular among FOREX traders . It is usually used as a confluence with other indicators. It uses combinations of moving averages with complex smoothing formulas! It has two configurable parameters: Coefficient   - smoothing ratio (*) Applied price Calculation: Coral = (-0.064) * B6 + 0.672 * B5 - 2.352 * B4 + 2.744 * B3
FREE
Descrizione generale Questo indicatore è una versione avanzata del classico Donchian Channel , arricchita con funzioni operative per il trading reale. Oltre alle tre linee tipiche (massimo, minimo e linea centrale), il sistema rileva i breakout e li segnala graficamente con frecce sul grafico, mostrando solo la linea opposta alla direzione del trend per semplificare la lettura. L’indicatore include: Segnali visivi : frecce colorate al breakout Notifiche automatiche : popup, push e email Filtro R
FREE
Haven FVG Indicator
Maksim Tarutin
5 (7)
L'indicatore   Haven FVG   è uno strumento per l'analisi dei mercati che permette di identificare le aree di inefficienza (Fair Value Gaps, FVG) nel grafico, fornendo ai trader livelli chiave per l'analisi dei prezzi e la presa di decisioni commerciali. Altri prodotti ->  QUI Caratteristiche principali: Impostazioni dei colori individuali: Colore per FVG rialzista   (Bullish FVG Color). Colore per FVG ribassista   (Bearish FVG Color). Visualizzazione flessibile di FVG: Numero massimo di candele
FREE
TradeQL
Abdiel Aviles Jimenez
The TradeQL Indicator is a customizable tool that highlights specific trading patterns on candlestick charts. Users can define patterns through TradeQL queries, which the indicator then applies to the chart, visually representing matches and captured groups. Ideal for identifying complex trade setups in real-time. TradeQL queries are specified using the TradeQL Language. See https://github.com/abdielou/tradeql for more details. This language is expressed as a regular expression. The language al
FREE
Strifor Lot Calculator — indicatore per MetaTrader 5 che aiuta i trader a calcolare la dimensione ottimale del lotto in base a rischio e stop-loss impostati. Permette un trading più consapevole, gestione del rischio e risparmio di tempo nei calcoli manuali. Vantaggi Controllo preciso del rischio — calcolo automatico del lotto in base alla percentuale di rischio scelta Due modalità — inserimento manuale o calcolo tramite linee sul grafico Supporta strumenti popolari — coppie di valute, oro (XAUUS
FREE
Are you tired of drawing trendlines every time you're analyzing charts? Or perhaps you would like more consistency in your technical analysis. Then this is for you. This indicator will draw trend lines automatically when dropped on a chart. How it works Works similar to standard deviation channel found on mt4 and mt5. It has 2 parameters: 1. Starting Bar 2. Number of bars for calculation The   starting bar   is the bar which drawing of the trend lines will begin, while the   number of bars for c
FREE
Basic Renko MT5
Mehran Sepah Mansoor
4.63 (8)
L'indicatore Basic Renko è uno strumento potente per i trader che cercano una prospettiva di mercato chiara e concisa. Il nostro indicatore non solo semplifica la visualizzazione del trend, ma offre anche avvisi precisi per le inversioni, fornendo un vantaggio strategico nel vostro trading /   Versione MT4 gratuita Caratteristiche Completamente personalizzabile:   Adattate l'indicatore alle vostre preferenze commerciali grazie alle opzioni di personalizzazione avanzate. Dai colori alle impost
FREE
Girassol Sunflower MT5 Indicator
Saullo De Oliveira Pacheco
4.33 (6)
This is the famous Sunflower indicator for Metatrader5. This indicator marks possible tops and bottoms on price charts. The indicator identifies tops and bottoms in the asset's price history, keep in mind that the current sunflower of the last candle repaints, as it is not possible to identify a top until the market reverses and it is also not possible to identify a bottom without the market stop falling and start rising. If you are looking for a professional programmer for Metatrader5, please
FREE
Show Pips for MT5
Roman Podpora
4.52 (27)
Questo indicatore informativo sarà utile per coloro che vogliono essere sempre informati sulla situazione attuale del conto. VERSION MT 4 -   More useful indicators L'indicatore mostra dati come profitto in punti, percentuale e valuta, nonché lo spread per la coppia corrente e il tempo fino alla chiusura della barra nell'intervallo di tempo corrente. Esistono diverse opzioni per posizionare la linea delle informazioni sulla carta: A destra del prezzo (corre dietro al prezzo); Come commento (nell
FREE
DALA Forecast
Grigorii Matsnev
About the indicator: DALA Forecast is a universal tool for predicting the dynamics of time series of any nature. For prediction, modified methods of nonlinear dynamics analysis are used, on the basis of which a predictive model is built using machine learning methods.  To get the trial version of the indicator, you can contact me in private messages. How to use the indicator: Apply the indicator to your chosen financial instrument or indicator with the settings you need. The prediction will be
FREE
WH Price Wave Pattern MT5
Wissam Hussein
4.25 (12)
Benvenuto nel nostro   modello di ondata di prezzo   MT5 --(modello ABCD)-- Il modello ABCD è un modello di trading potente e ampiamente utilizzato nel mondo dell'analisi tecnica. È un modello di prezzo armonico che i trader utilizzano per identificare potenziali opportunità di acquisto e vendita sul mercato. Con il modello ABCD, i trader possono anticipare potenziali movimenti di prezzo e prendere decisioni informate su quando entrare e uscire dalle negoziazioni. Versione EA:   Price Wave EA
FREE
Indicator and Expert Adviser  EA Available in the comments section of this product. Download with Indicator must have indicator installed for EA to work. Mt5 indicator alerts for bollinger band and envelope extremes occurring at the same time. Buy signal alerts occur when A bullish candle has formed below both the lower bollinger band and the lower envelope  Bar must open and close below both these indicators. Sell signal occur when A bear bar is formed above the upper bollinger band and upper
FREE
The indicator highlights the points that a professional trader sees in ordinary indicators. VisualVol visually displays different volatility indicators on a single scale and a common align. Highlights the excess of volume indicators in color. At the same time, Tick and Real Volume, Actual range, ATR, candle size and return (open-close difference) can be displayed. Thanks to VisualVol, you will see the market periods and the right time for different trading operations. This version is intended f
FREE
Gann Pivot Levels
Ali Gokay Duman
4.17 (6)
This indicator calculates gann support and resistance prices with use gann pyramid formulation and draw them on the chart. And If you want, Indicator can alert you when the current price arrive these pivot levels. Alert Options: Send Mobil Message, Send E-mail, Show Message and Sound Alert Levels: S1, S2, S3, S4, S5, R1, R2, R3, R4, R5 Inputs:  GannInputPrice: Input price for gann pyramid formulation. GannInputDigit: How many digit do you want to use for calculation formula. (The number and the
FREE
Time Candle with Sound Alert This indicator will be display the time left candle Features : 1. Multi Time Frames, Multi Pairs 2. Time Left 2. Position dynamic with Bid Price or Edge of Chart Screen 3. Font Size and Color 4. Display Current Spread, Maximum Spread and Minimum Spread Note: Maximum and Minimum Spread will be reset when you change TF Tested On MT5 Version 5 Build 5200 If you want the source code, just PM me
FREE
The "Support Resistance Dynamic" indicator is a powerful technical analysis tool for the MetaTrader 5 platform, designed to automatically identify and plot dynamic Support and Resistance zones on price charts. This indicator helps traders easily recognize important price levels, potential reversal points, or breakout areas, thereby enabling more informed trading decisions. 2. Key Features Dynamic S/R Identification : Automatically identifies support and resistance zones based on an advanced Pivo
FREE
Smart Trend Suite Pro – Advanced Trend Indicator with Dashboard & Alerts Overview: Smart Trend Suite Pro is a powerful trend-detection indicator that offers traders a complete set of tools for accurate trend analysis and actionable insights. Designed for versatility and precision, Smart Trend Suite Pro adapts seamlessly to multiple timeframes and market conditions, making it suitable for various trading styles, including scalping and swing trading. Key Features: Real-Time Trend Detection: Identi
FREE
WaveTrend Plus
Nguyen Thanh Cong
5 (6)
Introduction WaveTrend Plus is an amazing oscillator that can detect optimal entry points in the market with high precision using complex computations of price and momentum. This version packs many improvements compared to the original WaveTrend such as cleaner visuals, oversold/overbought signals and divergence detection Signal Buy when oversold signal appear (green dot below) or when a bullish divergence is detected (green dashed line) Sell when overbought signal appear (red dot above) or
FREE
Automatic Trendlines
Pasi Hakamaki
4.69 (48)
The indicator draws trendlines on chart. This indicator has six inputs. User can specify alternative labels for both lines. If multiple instances of the indicator are used, the labels must differ. User can set width and color of the lines and depth which specifies what significant peaks should be used. For example, Depth=10 sets trendlines using the current peaks and valleys that have at least 10 bars to the right and to the left and that have highs/lows less/greater than the peak's high/low. In
FREE
Zigzag Price Arrows
Aiman Saeed Salem Dahbag
The Zigzag Price Arrow indicator is an enhanced version of the classic Zigzag indicator, combining the traditional zigzag pattern with advanced visual features. It not only identifies major market turning points but also provides clear trading signals through: • Directional arrows: Displays colored arrows (green for buy, magenta for sell) indicating potential trend directions. • Price labels: Shows the exact price values at each pivot point directly on the chart. • Improved visual clarity: Make
FREE
(Special New Year promotion - free price!) The indicator displays the actual 'Scale in points per bar' (identical to the manual setting in the Terminal, see screenshot) in the upper right corner of the chart. The displayed value changes INSTANTLY whenever the chart scale is changed! (This is very convenient when planning screenshots). In Settings: Change language (Russian/English), font size of the displayed text, text label offset coefficient from the graph corner, equally in X and Y directi
FREE
Fibomathe
Almaquio Ferreira De Souza Junior
Fibomathe Indicator: Support and Resistance Tool for MT5 The Fibomathe Indicator is a technical analysis tool designed for MetaTrader 5 (MT5) that assists traders in identifying support and resistance levels, take-profit zones, and additional price projection areas. It is suitable for traders who use structured approaches to analyze price action and manage trades. Key Features Support and Resistance Levels: Allows users to define and adjust support and resistance levels directly on the chart.
FREE
RSI abcd
Francisco Gomes Da Silva
3 (1)
RSI ABCD Pattern Finder: Strategia Tecnica 1. Come Funziona l'Indicatore Combina il RSI classico con il rilevamento automatico di pattern armonici ABCD . Componenti Principali RSI standard (periodo regolabile) Marcatori di massimi e minimi (frecce) Pattern ABCD (linee verdi/rosse) Filtri ipercomprato (70) e ipervenduto (30) 2. Configurazione su MT5 period = 14 ; // Periodo RSI size = 4 ; // Dimensione massima del pattern OverBought = 70 ; // Livello ipercomprato OverSold = 30 ; // Livello iperve
FREE
SpreadMeter OGT Free
Dmitriy Gurenko
5 (1)
The indicator shows the current spread of the symbol, the minimum, average and maximum values for the current bar in the form of digital, analog and graphic indicators. Has two modes of operation: fixing the system spread, or calculating the spread as the difference between the "Bid" and "Ask" prices on each incoming tick. Parameters  The indicator has a single input parameter: Type of calculation  - type of spread calculation. It can take the following values:  System spread  - the spread value
FREE
Gli utenti di questo prodotto hanno anche acquistato
Se acquisti questo indicatore, riceverai il mio Trade Manager Professionale + EA  GRATUITAMENTE. Innanzitutto è importante sottolineare che questo sistema di trading è un indicatore Non-Repainting, Non-Redrawing e Non-Lagging, il che lo rende ideale sia per il trading manuale che per quello automatico. Corso online, manuale e download di preset. Il "Sistema di Trading Smart Trend MT5" è una soluzione completa pensata sia per i trader principianti che per quelli esperti. Combina oltre 10 indicat
SuperScalp Pro
Van Minh Nguyen
5 (2)
SuperScalp Pro – Sistema avanzato di indicatore per scalping con filtri multipli SuperScalp Pro è un sistema avanzato di indicatore per scalping che combina il classico Supertrend con molteplici filtri di conferma intelligenti. L’indicatore funziona in modo efficiente su tutti i timeframe da M1 a H4 ed è particolarmente adatto per XAUUSD, BTCUSD e le principali coppie Forex. Può essere utilizzato come sistema stand-alone o integrato in modo flessibile nelle strategie di trading esistenti. L’indi
ARIPoint
Temirlan Kdyrkhan
ARIPoint is a powerful trading companion designed to generate high-probability entry signals with dynamic TP/SL/DP levels based on volatility. Built-in performance tracking shows win/loss stats, PP1/PP2 hits, and success rates all updated live. Key Features: Buy/Sell signals with adaptive volatility bands Real-time TP/SL/DP levels based on ATR Built-in MA Filter with optional ATR/StdDev volatility Performance stats panel (Success, Profit/Loss, PP1/PP2) Alerts via popup, sound, push, or email Cu
FX Trend MT5 NG
Daniel Stein
5 (1)
FX Trend NG: La Nuova Generazione di Intelligenza di Trend Multi-Mercato Panoramica FX Trend NG è uno strumento professionale di analisi del trend multi-timeframe e monitoraggio dei mercati. Ti consente di comprendere la struttura completa del mercato in pochi secondi. Invece di passare tra numerosi grafici, puoi identificare immediatamente quali strumenti sono in trend, dove il momentum sta diminuendo e dove esiste un forte allineamento tra i timeframe. Offerta di Lancio – Ottieni FX Trend NG
Entry In The Zone and SMC Multi Timeframe is a real-time market analysis tool developed based on Smart Money Concepts (SMC). It is designed to analyze market structure, price direction, reversal points, and key zones across multiple timeframes in a systematic way. The system displays Points of Interest (POI) and real-time No Repaint signals, with instant alerts when price reaches key zones or when signals occur within those zones. It functions as both an Indicator and a Signal System (2-in-1), c
Azimuth Pro
Ottaviano De Cicco
5 (4)
LAUNCH PROMO Azimuth Pro price is initially set at 299$ for the first 100 buyers. Final price will be 499$ . THE DIFFERENCE BETWEEN RETAIL AND INSTITUTIONAL ENTRIES ISN'T THE INDICATOR — IT'S THE LOCATION. Most traders enter at arbitrary price levels, chasing momentum or reacting to lagging signals. Institutions wait for price to reach structured levels where supply and demand actually shift. Azimuth Pro maps these levels automatically: swing-anchored VWAP, multi-timeframe structure lines, an
Divergence Bomber
Ihor Otkydach
4.89 (81)
Ogni acquirente dell’indicatore riceverà inoltre gratuitamente: L’utilità esclusiva “Bomber Utility”, che gestisce automaticamente ogni operazione, imposta i livelli di Stop Loss e Take Profit e chiude le posizioni secondo le regole della strategia I file di configurazione (set file) per adattare l’indicatore a diversi asset I set file per configurare il Bomber Utility in tre modalità: “Rischio Minimo”, “Rischio Bilanciato” e “Strategia di Attesa” Una guida video passo-passo per installare, conf
Power Candles MT5
Daniel Stein
5 (6)
Power Candles – Segnali di ingresso basati sulla forza per tutti i mercati Power Candles porta l’analisi di forza collaudata di Stein Investments direttamente sul grafico dei prezzi. Invece di reagire solo al prezzo, ogni candela viene colorata in base alla reale forza di mercato, consentendo di identificare immediatamente accumuli di momentum, accelerazioni della forza e transizioni di trend pulite. Un’unica logica per tutti i mercati Power Candles funziona automaticamente su tutti i simboli di
Game Changer è un indicatore di tendenza rivoluzionario, progettato per essere utilizzato su qualsiasi strumento finanziario, per trasformare il tuo MetaTrader in un potente analizzatore di trend. Funziona su qualsiasi intervallo temporale e aiuta a identificare i trend, segnala potenziali inversioni, funge da meccanismo di trailing stop e fornisce avvisi in tempo reale per risposte tempestive del mercato. Che tu sia un professionista esperto o un principiante in cerca di un vantaggio, questo st
FX Power MT5 NG
Daniel Stein
5 (31)
FX Power: Analizza la Forza delle Valute per Decisioni di Trading Più Intelligenti Panoramica FX Power è lo strumento essenziale per comprendere la reale forza delle principali valute e dell'oro in qualsiasi condizione di mercato. Identificando le valute forti da comprare e quelle deboli da vendere, FX Power semplifica le decisioni di trading e rivela opportunità ad alta probabilità. Che tu segua le tendenze o anticipi inversioni utilizzando valori estremi di Delta, questo strumento si adatta
Atomic Analyst MT5
Issam Kassas
4.07 (28)
Innanzitutto, vale la pena sottolineare che questo indicatore di trading non è repaint, non è ridisegno e non presenta ritardi, il che lo rende ideale sia per il trading manuale che per quello automatico. Manuale utente: impostazioni, input e strategia. L'Analista Atomico è un indicatore di azione del prezzo PA che utilizza la forza e il momentum del prezzo per trovare un miglior vantaggio sul mercato. Dotato di filtri avanzati che aiutano a rimuovere rumori e segnali falsi, e aumentare il pote
Top indicator for MT5   providing accurate signals to enter a trade without repainting! It can be applied to any financial assets:   forex, cryptocurrencies, metals, stocks, indices .  Watch  the video  (6:22) with an example of processing only one signal that paid off the indicator! MT4 version is here It will provide pretty accurate trading signals and tell you when it's best to open a trade and close it. Most traders improve their trading results during the first trading week with the help of
Ogni giorno, molti trader affrontano una sfida comune: il prezzo sembra rompere un livello chiave, entrano in un'operazione, e poi il mercato si inverte, attivando il loro stop loss. Questo è noto come falsa rottura (false breakout) — un movimento di prezzo che supera brevemente un livello di supporto o resistenza prima di invertire la direzione. Questi movimenti possono causare l'attivazione degli stop loss prima che la direzione effettiva del prezzo diventi chiara. Nell'analisi tecnica, questo
L'indicatore " Dynamic Scalper System MT5 " è progettato per il metodo di scalping, ovvero per il trading all'interno di onde di trend. Testato sulle principali coppie di valute e sull'oro, è compatibile con altri strumenti di trading. Fornisce segnali per l'apertura di posizioni a breve termine lungo il trend, con ulteriore supporto al movimento dei prezzi. Il principio dell'indicatore. Le frecce grandi determinano la direzione del trend. Un algoritmo per generare segnali per lo scalping sott
Trend Screener Pro MT5
STE S.S.COMPANY
4.84 (100)
Indicatore di tendenza, soluzione unica rivoluzionaria per il trading di tendenze e il filtraggio con tutte le importanti funzionalità di tendenza integrate in un unico strumento! È un indicatore multi-timeframe e multi-valuta al 100% non ridipingibile che può essere utilizzato su tutti i simboli/strumenti: forex, materie prime, criptovalute, indici e azioni. Trend Screener è un indicatore di tendenza che segue un indicatore efficiente che fornisce segnali di tendenza a freccia con punti nel gra
L’indicatore evidenzia le zone in cui viene dichiarato interesse sul mercato , per poi mostrare la zona di accumulo degli ordini . Funziona come un book degli ordini su larga scala . Questo è l’indicatore per i grandi capitali . Le sue prestazioni sono eccezionali. Qualsiasi interesse ci sia nel mercato, lo vedrai chiaramente . (Questa è una versione completamente riscritta e automatizzata – non è più necessaria un’analisi manuale.) La velocità di transazione è un indicatore concettualmente nuo
Super Signal – Skyblade Edition Sistema professionale di segnali di tendenza senza repaint / senza ritardo con tasso di vincita eccezionale | Per MT4 / MT5 Funziona meglio su timeframe più bassi, come 1 minuto, 5 minuti e 15 minuti. Caratteristiche principali: Super Signal – Skyblade Edition è un sistema intelligente di segnali progettato specificamente per il trading di tendenza. Utilizza una logica di filtraggio multilivello per identificare esclusivamente i movimenti direzionali forti, supp
Grabber System MT5
Ihor Otkydach
4.82 (22)
Ti presento un eccellente indicatore tecnico: Grabber, che funziona come una strategia di trading "tutto incluso", pronta all’uso. In un solo codice sono integrati strumenti potenti per l’analisi tecnica del mercato, segnali di trading (frecce), funzioni di allerta e notifiche push. Ogni acquirente di questo indicatore riceve anche gratuitamente: L’utility Grabber: per la gestione automatica degli ordini aperti Video tutorial passo dopo passo: per imparare a installare, configurare e utilizzare
Gold Entry Sniper
Tahir Mehmood
5 (3)
Gold Entry Sniper – Dashboard ATR Multi-Timeframe per Scalping e Swing Trading sull’Oro Gold Entry Sniper è un indicatore avanzato per MetaTrader 5 che offre segnali di acquisto/vendita precisi per XAUUSD e altri strumenti, basato sulla logica ATR Trailing Stop e l' analisi multi-timeframe . Caratteristiche e Vantaggi Analisi Multi-Timeframe – Visualizza trend su M1, M5, M15 in un'unica dashboard. Trailing Stop Basato su ATR – Stop dinamici che si adattano alla volatilità. Dashboard Professional
Smart Stop Indicator – Precisione intelligente dello stop-loss direttamente sul grafico Panoramica Smart Stop Indicator è la soluzione ideale per i trader che desiderano posizionare il loro stop-loss in modo chiaro e metodico, senza dover indovinare o affidarsi all’intuizione. Questo strumento combina la logica classica del price action (massimi e minimi strutturali) con un moderno riconoscimento dei breakout per identificare il prossimo livello di stop realmente logico. In trend, in range o i
Quantum TrendPulse
Bogdan Ion Puscasu
5 (20)
Ecco   Quantum TrendPulse   , lo strumento di trading definitivo che combina la potenza di   SuperTrend   ,   RSI   e   Stocastico   in un unico indicatore completo per massimizzare il tuo potenziale di trading. Progettato per i trader che cercano precisione ed efficienza, questo indicatore ti aiuta a identificare con sicurezza le tendenze di mercato, i cambiamenti di momentum e i punti di entrata e uscita ottimali. Caratteristiche principali: Integrazione SuperTrend:   segui facilmente l'andame
Quantum Entry   è un potente sistema di trading basato sull'azione del prezzo, costruito su una delle strategie più popolari e conosciute tra i trader: la strategia di   Breakout ! Questo indicatore genera segnali di acquisto e vendita chiari e cristallini basati sulla rottura di aree chiave di supporto e resistenza. A differenza dei tipici indicatori di breakout, utilizza calcoli avanzati per confermare con precisione la rottura! Quando si verifica una rottura, ricevi avvisi immediati. Nessun r
FX Levels MT5
Daniel Stein
5 (13)
FX Levels: Supporti e Resistenze di Precisione Eccezionale per Tutti i Mercati Panoramica Rapida Cercate un modo affidabile per individuare livelli di supporto e resistenza in ogni mercato—coppie di valute, indici, azioni o materie prime? FX Levels fonde il metodo tradizionale “Lighthouse” con un approccio dinamico all’avanguardia, offrendo una precisione quasi universale. Basato sulla nostra esperienza reale con i broker e su aggiornamenti automatici giornalieri più quelli in tempo reale, FX
Bill Williams Advanced
Siarhei Vashchylka
5 (10)
Bill Williams Advanced is designed for automatic chart analysis using Bill Williams' "Profitunity" system. The indicator analyzes four timeframes at once. Manual (Be sure to read before purchasing) Advantages 1. Analyzes the chart using Bill Williams' "Profitunity" system. Signals are displayed in a table in the corner of the screen and on the price chart. 2. Finds all known AO and AC signals, as well as zone signals. Equipped with a trend filter based on the Alligator. 3. Finds "Divergence Bar
Trend indicator AI mt5
Ramil Minniakhmetov
5 (15)
Trend Ai indicator è un ottimo strumento che migliorerà l'analisi di mercato di un trader combinando l'identificazione della tendenza con punti di ingresso utilizzabili e avvisi di inversione. Questo indicatore consente agli utenti di navigare nelle complessità del mercato forex con fiducia e precisione Oltre ai segnali primari, l'indicatore Ai di tendenza identifica i punti di ingresso secondari che si presentano durante i pullback o i ritracciamenti, consentendo ai trader di capitalizzare le
Support And Resistance Screener è in un indicatore di livello per MetaTrader che fornisce più strumenti all'interno di un indicatore. Gli strumenti disponibili sono: 1. Screener della struttura del mercato. 2. Zona di ritiro rialzista. 3. Zona di ritiro ribassista. 4. Punti pivot giornalieri 5. Punti pivot settimanali 6. Punti pivot mensili 7. Forte supporto e resistenza basati sul modello e sul volume armonici. 8. Zone a livello di banca. OFFERTA A TEMPO LIMITATO: il supporto HV e l'indicatore
Questo cruscotto mostra gli ultimi   pattern armonici   disponibili per i simboli selezionati, in modo da risparmiare tempo ed essere più efficienti /   versione MT4 . Indicatore gratuito:   Basic Harmonic Pattern Colonne dell'indicatore Symbol :   vengono visualizzati i simboli selezionati Trend:   rialzista o ribassista Pattern:   tipo di pattern (gartley, butterfly, bat, crab, shark, cypher o ABCD) Entry:   prezzo di ingresso SL:   prezzo di stop loss TP1:   1 prezzo di take profit TP2:
Dark Support Resistance  is an Indicator for intraday trading. This Indicator is programmed to identify  Support and Resistance Lines , providing a high level of accuracy and reliability. Key benefits Easily visible lines Only the most important levels will be displayed Automated adjustment for each timeframe and instrument Easy to use even for beginners Never repaints, never backpaints, Not Lag 100% compatible with Expert Advisor development All types of alerts available: Pop-up, Email, Push
Innanzitutto, vale la pena sottolineare che questo Strumento di Trading è un Indicatore Non-Ridipingente, Non-Ridisegnante e Non-Laggante, il che lo rende ideale per il trading professionale. Corso online, manuale utente e demo. L'Indicatore Smart Price Action Concepts è uno strumento molto potente sia per i nuovi che per i trader esperti. Racchiude più di 20 utili indicatori in uno solo, combinando idee di trading avanzate come l'Analisi del Trader del Circolo Interno e le Strategie di Tradin
[ Il mio canale ] , [ I miei prodotti ] Il Lorentzian Distance Classifier è un indicatore di trading basato sul machine learning che utilizza la distanza di Lorentz come metrica principale all’interno del framework degli Approximate Nearest Neighbors (ANN). Invece di fare affidamento sulla tradizionale distanza euclidea, tratta l’azione dei prezzi finanziari come se avvenisse in uno spazio “distorto” prezzo-tempo (simile al modo in cui gli oggetti massicci curvano lo spazio-tempo nella relativit
Altri dall’autore
Best SMC for All
Manh Toan Do
5 (3)
The Best SMC for All indicator is designed for MetaTrader 5 (MT5) to implement Smart Money Concepts (SMC) for analyzing market structure and identifying key trading zones based on price action. It visualizes supply and demand zones, Break of Structure (BOS) levels, Points of Interest (POI), and optional ZigZag patterns to assist traders in making informed decisions. Below is a detailed description of its features: --- Features 1. Swing High/Low Detection:    - Functionality: Automatically iden
FREE
The Breakout Finder (BF) is a powerful MetaTrader 5 indicator designed to detect potential breakout and breakdown opportunities in price action. By analyzing pivot highs and lows over a user-defined period, it identifies consolidation zones where price has repeatedly tested resistance or support levels within a narrow channel. When price breaks out of these zones with sufficient confirmation (based on the minimum number of tests and channel width threshold), the indicator visually highlights th
FREE
The Volume Profile Fixed Range indicator is a powerful tool designed for MetaTrader 5 (MT5) platforms. It visualizes the distribution of trading volume over a fixed historical range of bars, helping traders identify key price levels where significant volume has accumulated. This aids in spotting support/resistance zones, value areas, and potential reversal or breakout points. Below is a detailed description of its features: Key Features: - Fixed Range Analysis: Analyzes volume profile based on
FREE
Smart Money Breakout Channels Indicator The Smart Money Breakout Channels indicator is a powerful technical analysis tool designed to identify potential breakout opportunities in financial markets by detecting consolidation channels based on price volatility. Built for MetaTrader 5 (MT5), it overlays dynamic channels on the price chart, highlighting areas of low volatility that often precede significant price movements. This indicator is inspired by smart money concepts, focusing on institution
FREE
### Best Order Block Detector Indicator for MT5 The Order Block Detector is a technical analysis indicator designed for MetaTrader 5 (MT5). It identifies potential order blocks (OBs) in the market, which are key price levels where significant buying or selling activity has occurred, often acting as support or resistance zones. These blocks are detected based on volume pivots and market structure swings, helping traders spot areas of institutional interest for potential reversals or continuation
FREE
### Indicator Description: Gradient Heiken Ashi with Momentum Coloring This indicator is a technical analysis tool designed to overlay on the main chart, helping traders easily identify price trends and momentum through modified Heiken Ashi candles. It combines smoothed candle value calculations based on moving averages with a gradient color system to represent the strength of bullish or bearish trends. #### 1. Key Features - Display of Modified Heiken Ashi Candles:   - The indicator draws opt
FREE
BlackHole Quantum Pro
Manh Toan Do
3 (2)
Auto Trade Manager EA – Black Hole Quantum Pro The Auto Trade Manager EA – Black Hole  is a sophisticated Expert Advisor (EA) designed for MetaTrader 5, tailored for trading GOLD (XAUUSD) & FX, BTC with advanced automation and risk management features. Below are its most prominent features: Automated Entry with Support/Resistance : Utilizes dynamic support and resistance levels based on pivot points and historical price data to identify optimal entry points. Configurable parameters like PivotPer
FREE
The Breakout Finder (BF) is a technical analysis indicator designed for MetaTrader 5 (MT5) platforms. It identifies potential breakout and breakdown patterns in price action by analyzing pivot highs and lows over a specified period. The indicator detects "cup" formations—clusters of pivot points within a narrow price channel—indicating areas of consolidation that may lead to strong directional moves when broken. EA: BlackHole Breakout EA  https://www.mql5.com/en/market/product/149206 Key Featur
FREE
The Advanced Support and Resistance Indicator for MetaTrader 5 leverages sophisticated pivot point detection algorithms to autonomously identify and visualize critical price levels on the chart. Utilizing a configurable pivot period (default: 20 bars) and data source (High/Low or Open/Close), it intelligently scans historical price action within a user-defined loopback window (default: 290 bars) to pinpoint pivot highs and lows with strict validation criteria for enhanced precision. Pivots are d
FREE
The Moving Average Ribbon is a technical indicator that overlays a series of moving averages (MAs) on a price chart to visualize trend direction, strength, and potential reversals or reentries. It supports both Exponential Moving Averages (EMA) and Simple Moving Averages (SMA), configurable via user input. Key Features: Ribbon Composition: Displays 18 moving averages with periods ranging from 5 to 90 in increments of 5 (e.g., MA5, MA10, ..., MA90), plus an internal MA100 for reference. The MA5
FREE
Linear Regression Trending indicator analyzes price trends by plotting a linear regression channel based on user-defined parameters such as source (for example, close prices), channel length, and deviation multiplier. How It Works: - The indicator calculates a linear regression line over the specified length, forming a channel with upper and lower boundaries offset by the deviation value. - It detects price breaks from the channel and optionally displays broken channel lines (in a customizable
FREE
Description of the Harmonic Patterns + Fib Indicator The Harmonic Patterns + Fib indicator is a technical analysis tool designed for MetaTrader 5 (MT5). It automatically detects and visualizes harmonic price patterns on financial charts, leveraging Fibonacci ratios to identify potential reversal points in markets such as forex, stocks, cryptocurrencies, and commodities. The indicator scans for classic harmonic formations like Butterfly, Bat, Crab, Shark, Gartley, and ABCD, drawing them with lin
FREE
Reverse RSI Signals Indicator The Reverse RSI Signals indicator is a versatile technical analysis tool designed for MetaTrader 5 (MT5). It transforms traditional RSI calculations into dynamic price-based bands, integrates Supertrend for trend identification, and includes divergence detection for potential reversal signals. This overlay indicator provides visual and alert-based insights to help traders spot overbought/oversold conditions, trend shifts, and momentum divergences directly on the p
FREE
Quantum DCA Trader is a powerful, automated trading tool for MetaTrader 5 (MT5), designed to manage trades efficiently with a focus on Dollar Cost Averaging (DCA) strategies, risk control, and performance optimization. Built on advanced algorithms, it combines auto-entry mechanisms, grid trading, trailing stops, and news filters to adapt to volatile markets while protecting your capital. The EA supports both automated and manual orders, making it suitable for novice and experienced traders alike
FREE
BlackHole Breakout EA
Manh Toan Do
3 (1)
BlackHole Breakout EA: Unleash Precision Trading with Breakout Mastery Discover the Power of Intelligent Breakouts The BlackHole Breakout EA is a cutting-edge Expert Advisor designed for MetaTrader 5, empowering traders to capitalize on market momentum with pinpoint accuracy. Built by Ngoa Long Tien Sinh (@blackholequantumpro on Telegram), this EA detects high-potential breakout (upward) and breakdown (downward) patterns, transforming volatility into profitable opportunities. Whether you're a
FREE
Linear Regression Channel (LRC) Indicator – Overview The Linear Regression Channel (LRC) indicator is a professional tool designed to display dynamic price channels around a regression trendline. It automatically adapts to market conditions, helping traders visualize price movement with clarity. Main Features : Regression-based central line with upper/lower channel boundaries. Fully customizable colors, styles, and levels. Optional labels and forward extensions for better chart visualizati
FREE
Filtro:
aqwa
258
aqwa 2025.10.06 19:20 
 

L'utente non ha lasciato alcun commento sulla valutazione.

Rispondi alla recensione