Best Linear Regression Trending
- Indicatori
- Versione: 1.0

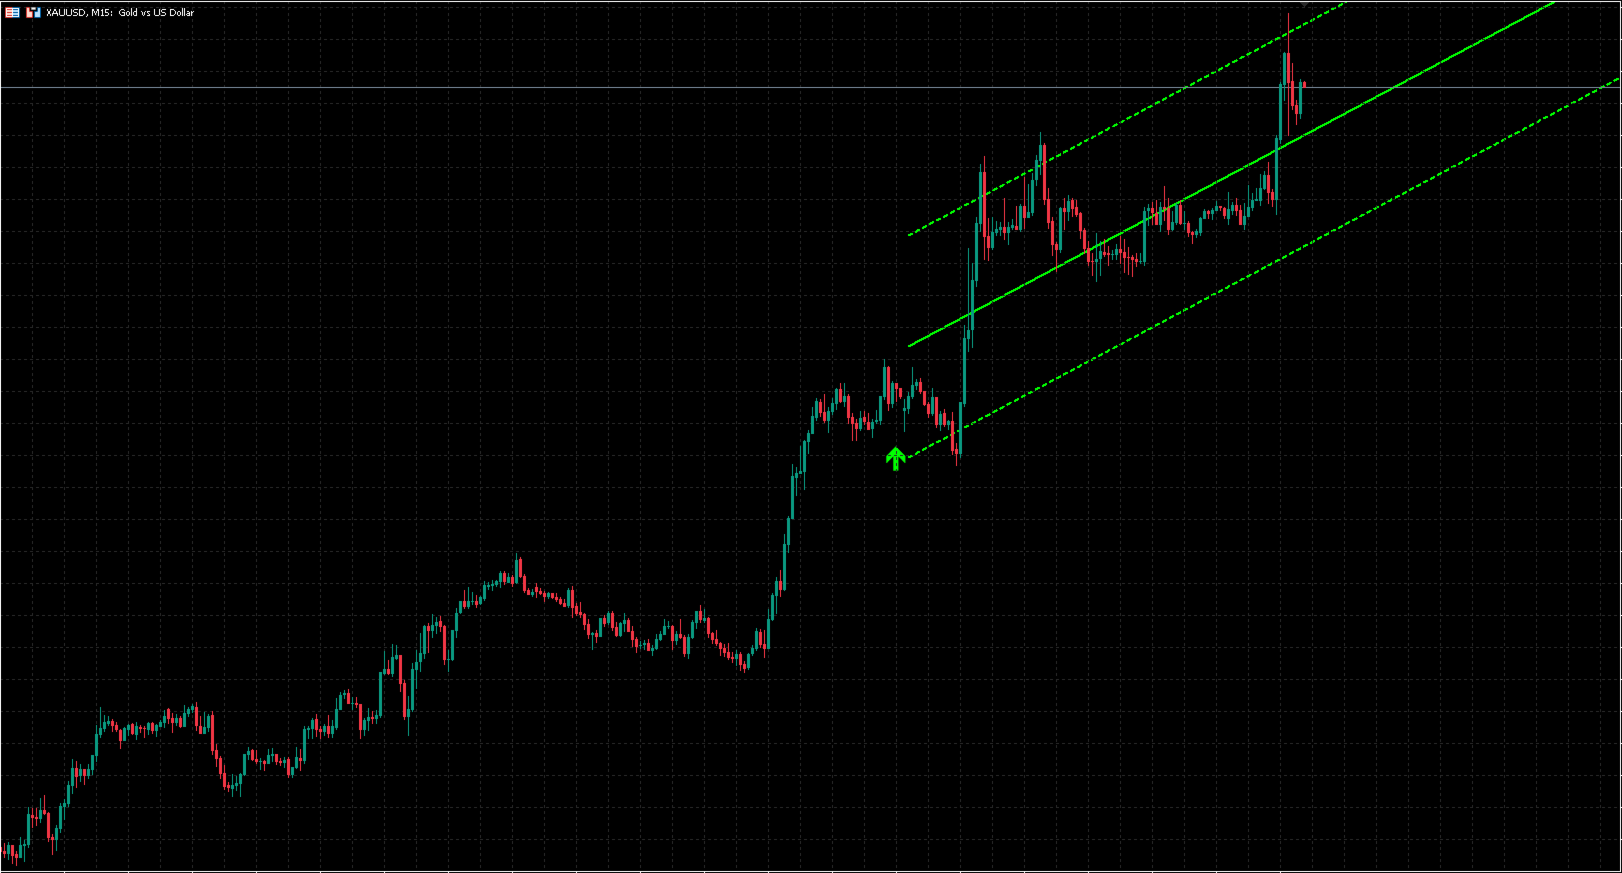
Linear Regression Trending indicator analyzes price trends by plotting a linear regression channel based on user-defined parameters such as source (for example, close prices), channel length, and deviation multiplier.
How It Works:
- The indicator calculates a linear regression line over the specified length, forming a channel with upper and lower boundaries offset by the deviation value.
- It detects price breaks from the channel and optionally displays broken channel lines (in a customizable color) where the break occurred.
- Momentum of the channel is evaluated by comparing the current slope to the previous one, with a label indicating trend direction and strength (uptrend increasing/decreasing, downtrend increasing/decreasing, or no trend).
- Line colors change dynamically based on trend direction (up: lime, down: red by default, customizable).
Features:
- Extend Lines: Option to extend channel lines to the right.
- Show Fibonacci Levels: Optionally display Fibonacci retracement levels (0.236, 0.382, 0.618, 0.786) within the channel.
- Show Broken Channel: Toggle to show dotted lines for broken channels, with customizable color.
- Line Width and Colors: Adjust width and up/down trend colors.
- Alerts: Built-in alerts for "Channel Broken", "Up trend", and "Down trend".
- Breakout Arrows: Displays arrows (up or down) at breakout points for visual confirmation.
- Trend Label: A text-based label at the channel start, with meanings:
- Uptrend and momentum increasing
- Uptrend and momentum decreasing
- Downtrend and momentum increasing
- Downtrend and momentum decreasing
- No trend


O indicador é muito bom, obrigado.