Real Spread Monitor MT4

Real Spread Monitor is a powerful indicator that is designed to accurately measure and analyze real spreads, giving traders the ability to compare trading conditions of different brokers.
This product is also available for MetaTrader 5 => https://www.mql5.com/en/market/product/125768

Key Features of Real Spread Monitor:

1. Two modes of operation:

  • Write mode: In this mode the indicator collects data on real spreads of the selected trading instrument and records them in a file. The spread is read on each tick, summarized, averaged and formed into a minute bar, which is saved to a file in the streaming mode. All values of minute bars are recorded in the following format: trading symbol, bar time, time shift relative to GMT, number of ticks, spread sum, minimum value, average value and maximum value. This data allows you to record the actual trading conditions at each stage of time.
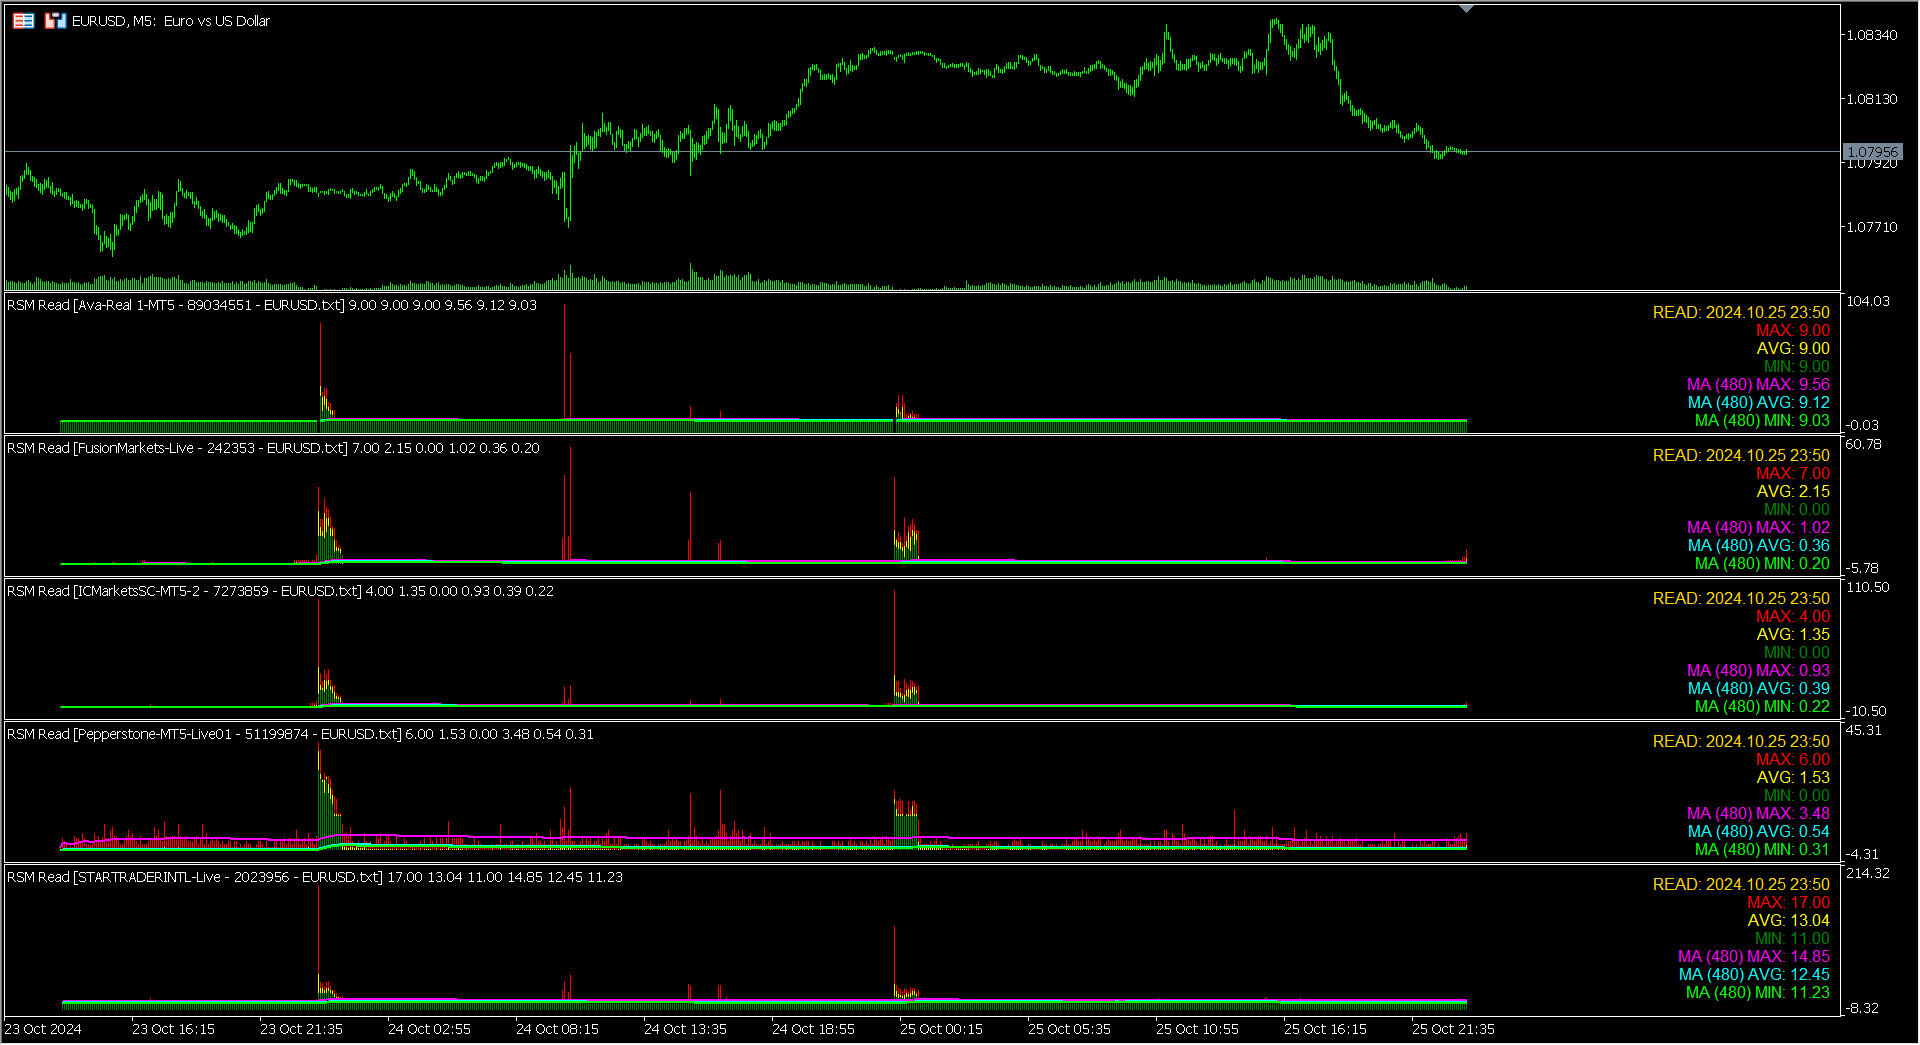
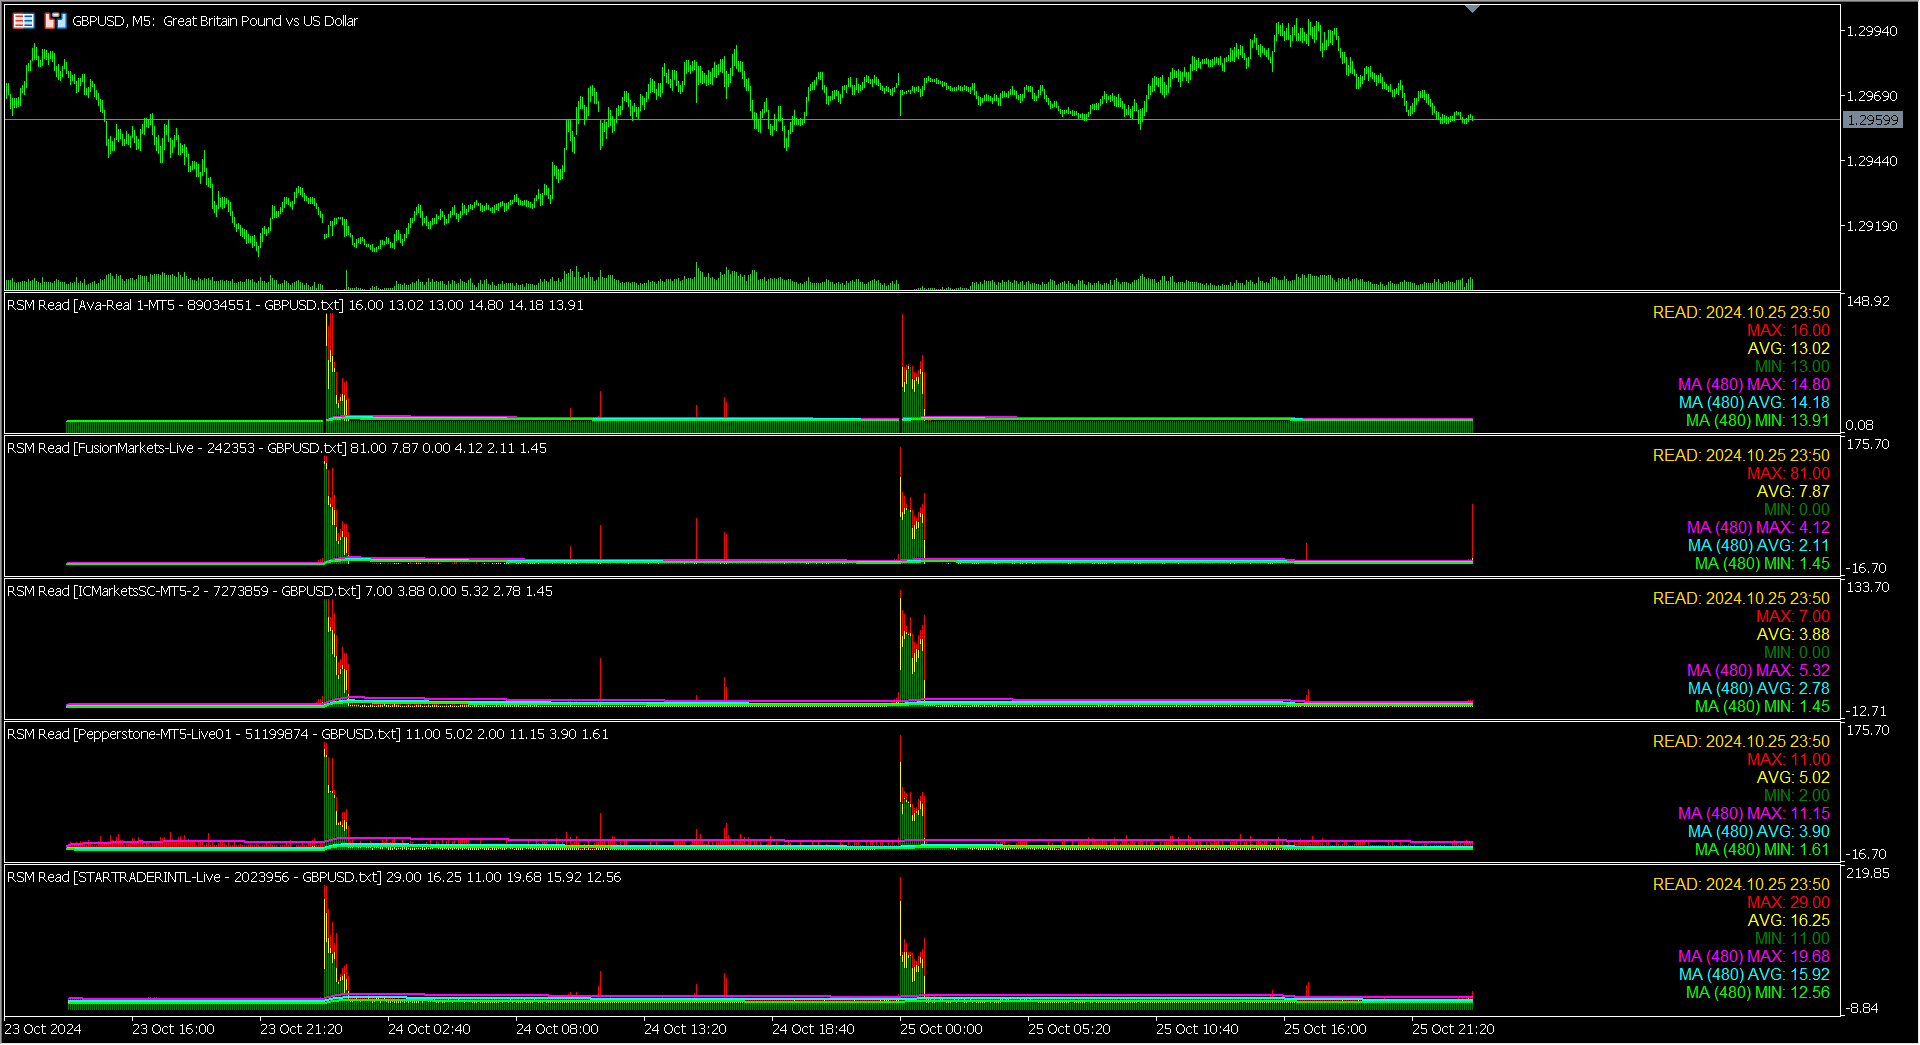
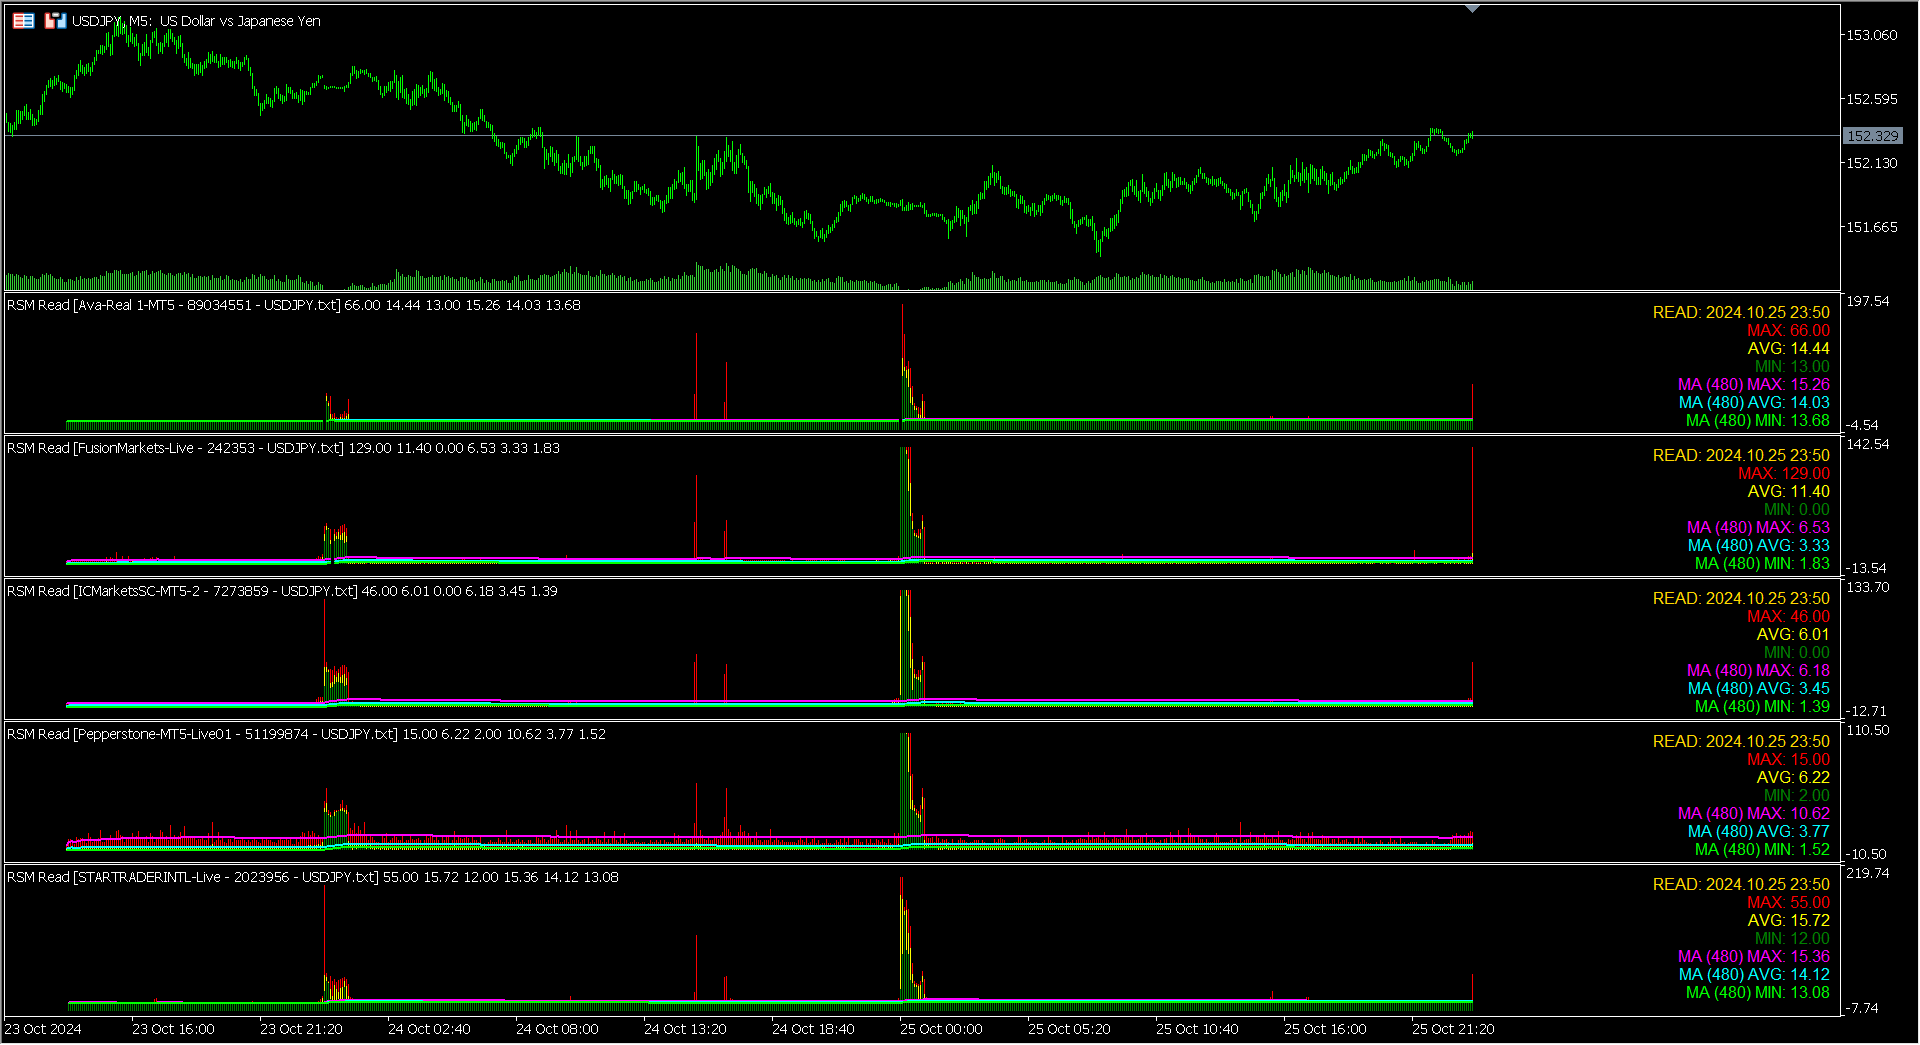
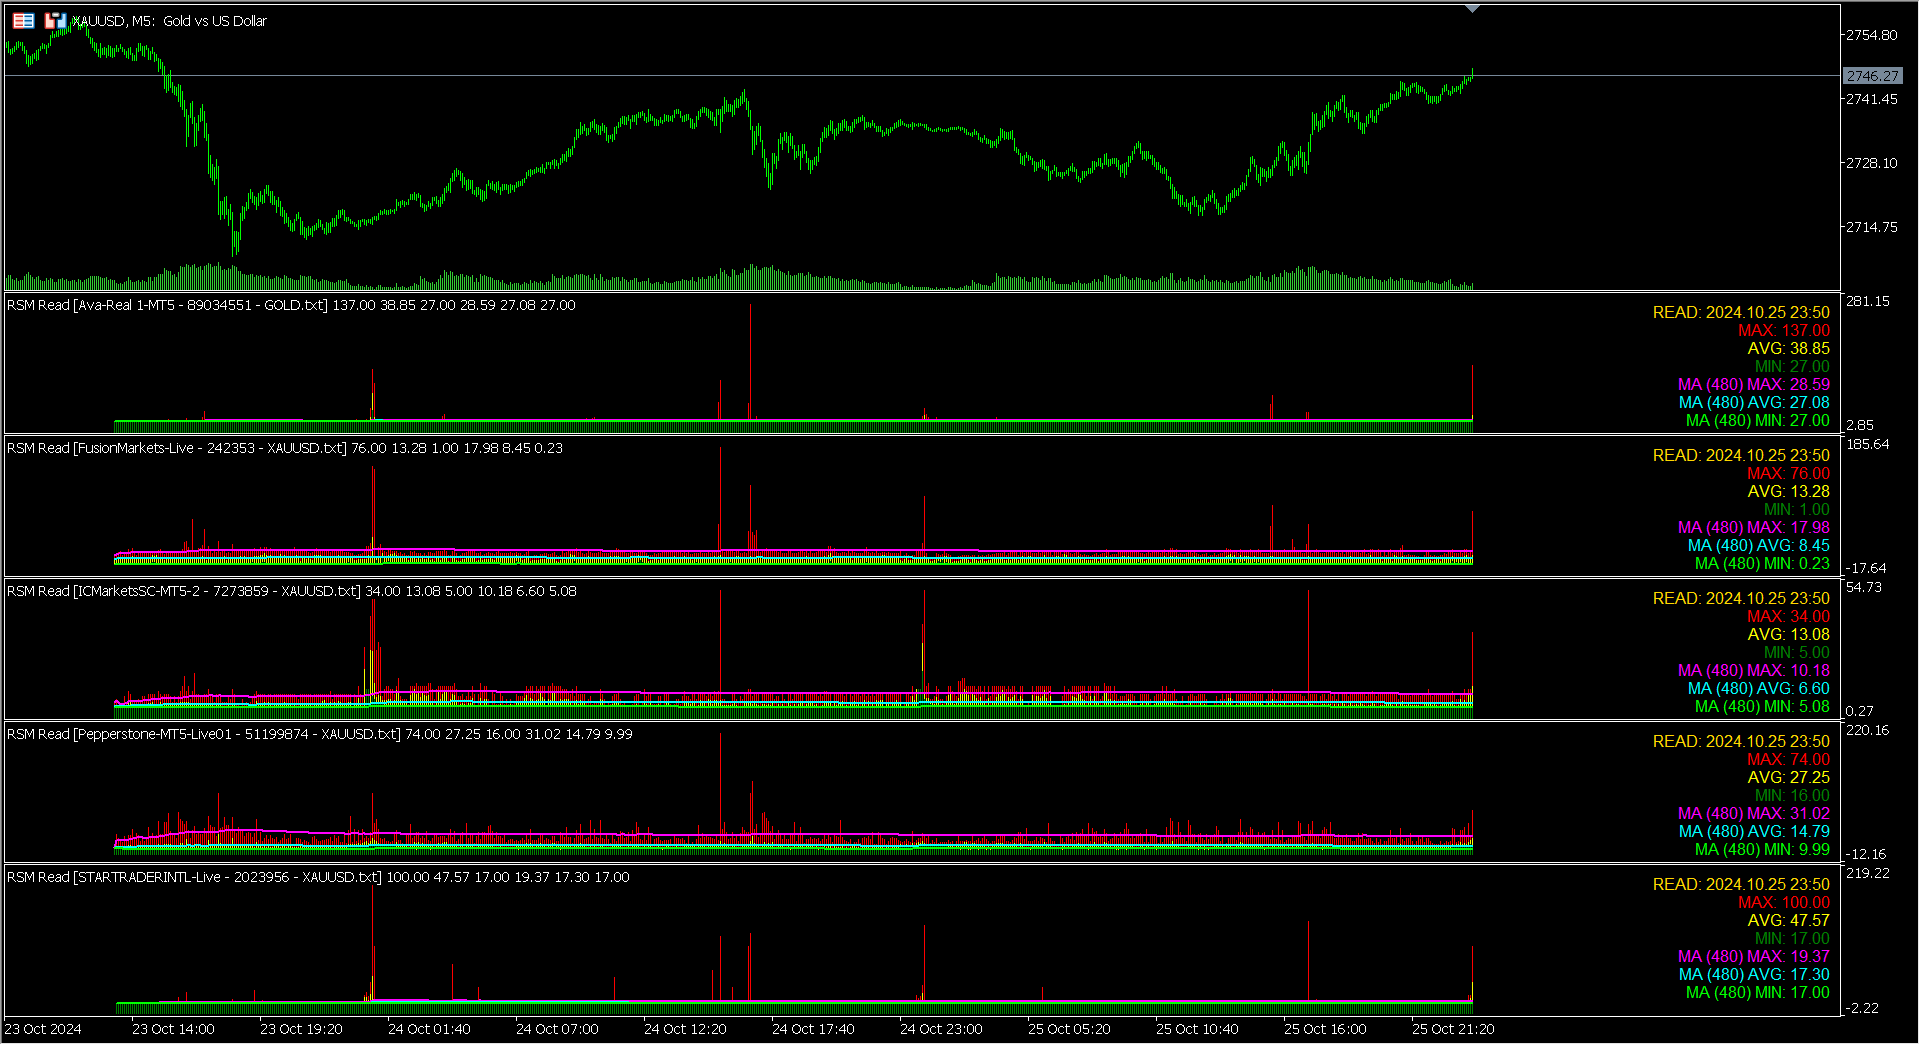
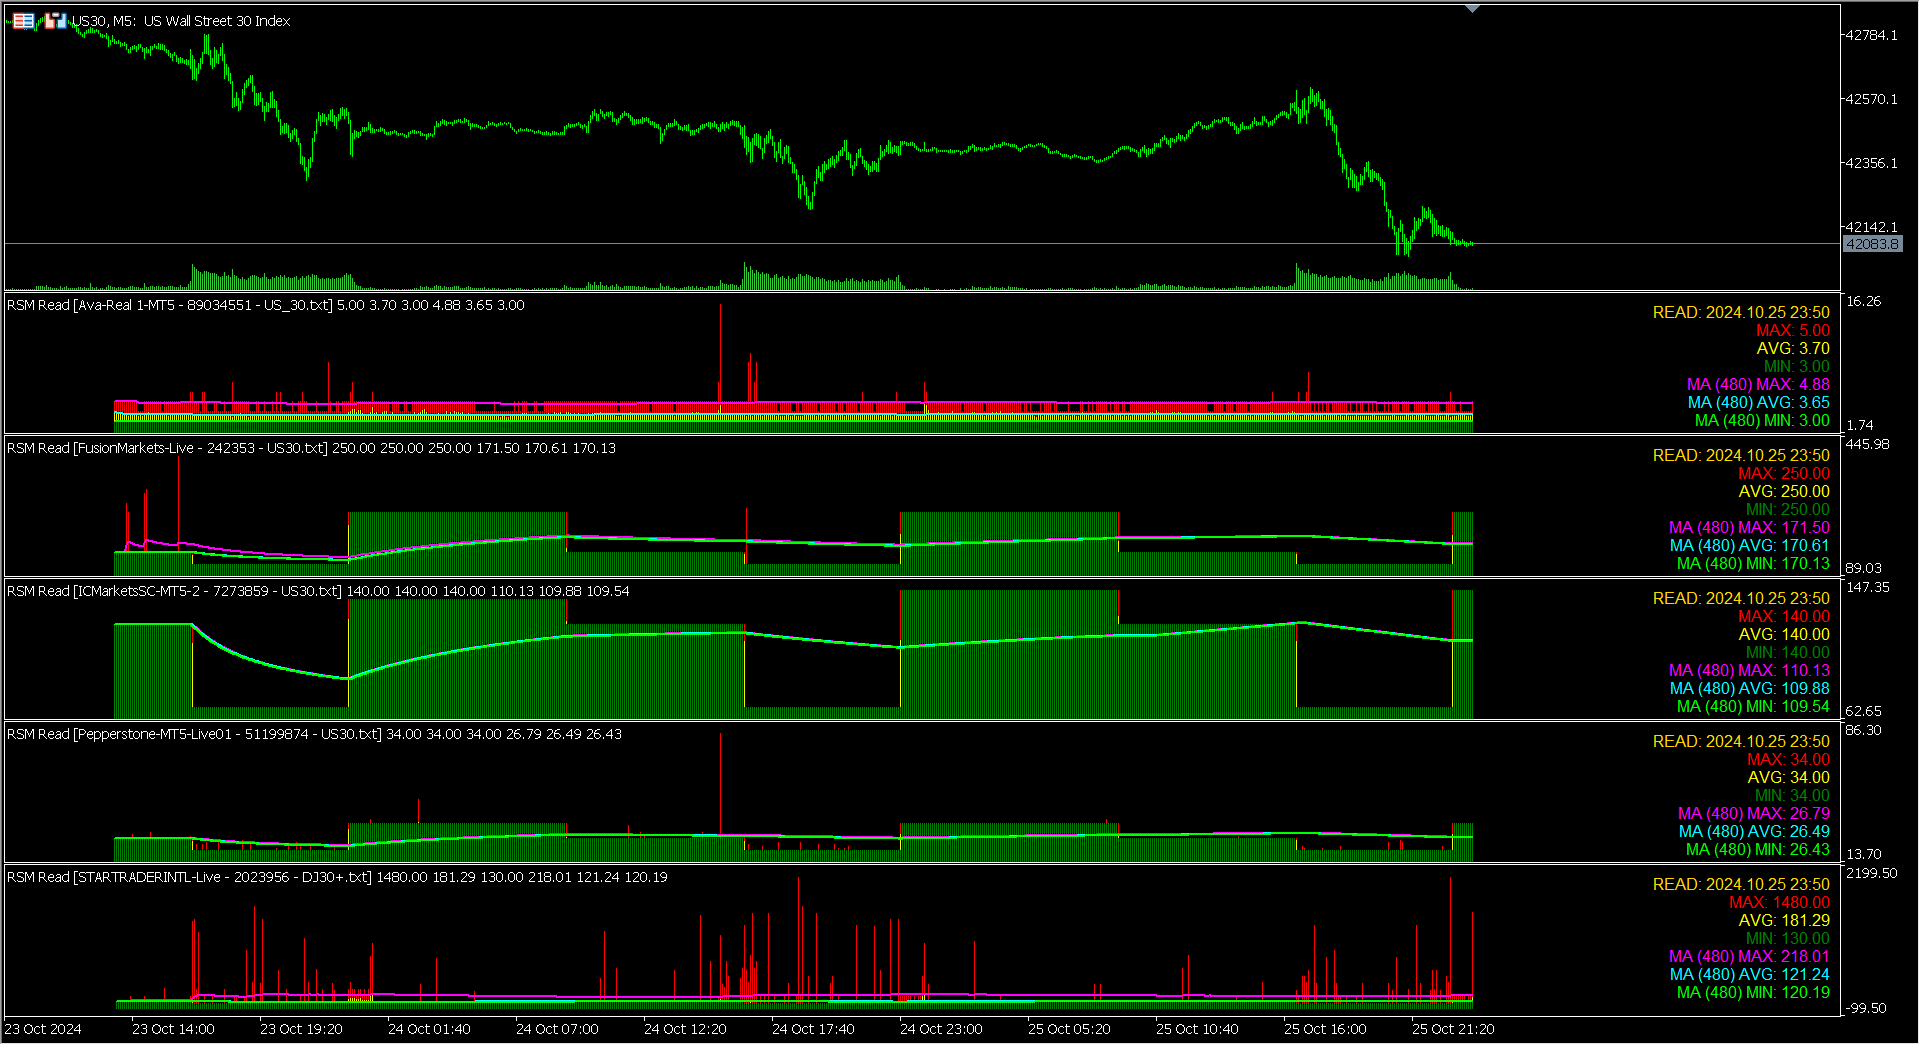
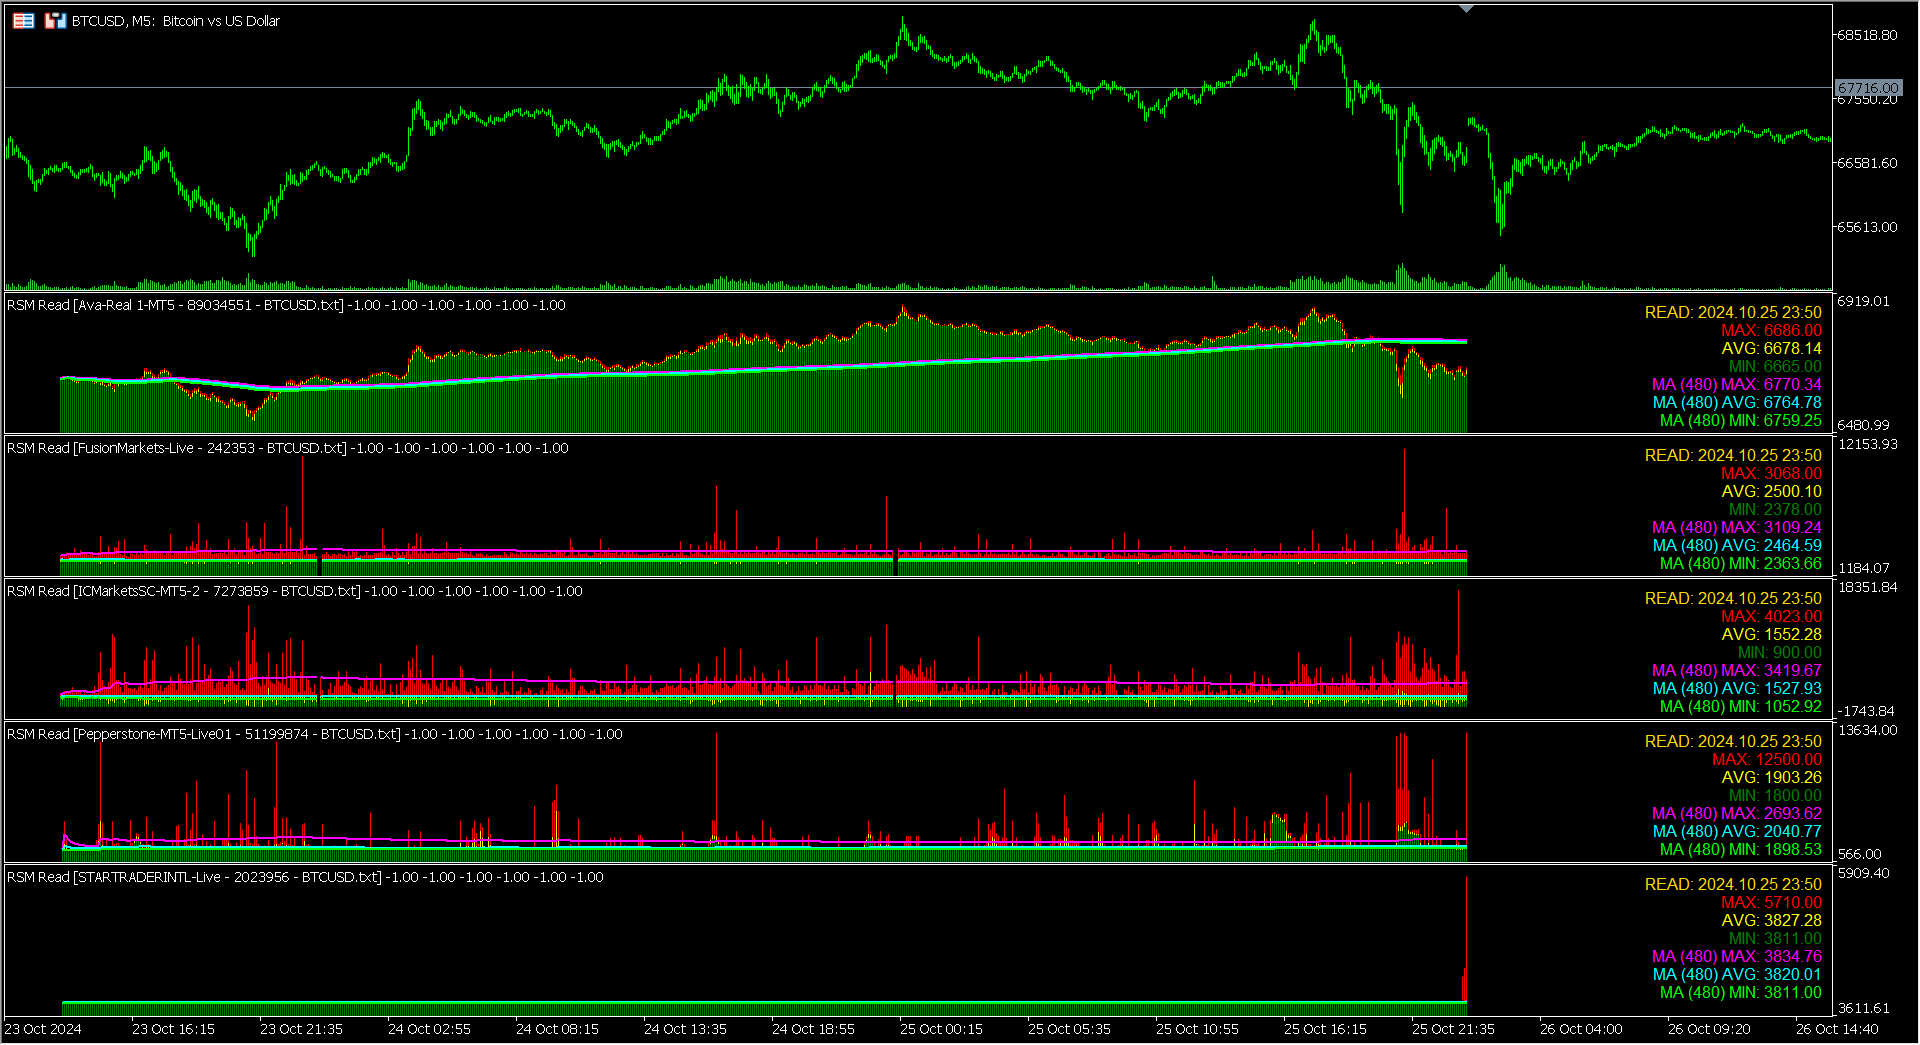
  • Read mode: The indicator reads real spreads from a file recorded in the write mode. This data can be used to analyze both current (real-time) and previously saved spreads (historical data). The files can be used by indicators from different trading terminals and even from different trading platforms MetaTrader 4 / MetaTrader 5, which allows comparing real spreads between different brokers and their different account types.

2. Analyze current and historical spreads:

Depending on how recent the data recorded in the file is, it is possible to analyze real spreads either in current time (data is updated in real time) or use previously recorded data for historical analysis. This allows traders to both monitor current trading conditions and analyze past market situations.

3. Flexibility of timeframes:

Although the real spread data is recorded in the form of minute bars, the indicator can display it on any timeframe convenient for the trader. This makes it possible to analyze the data on different timeframes, from one minute to one day, depending on the trading strategy.

4. Comparison of conditions of different brokers:

The main advantage of Real Spread Monitor is the ability to compare real spreads offered by different brokers. This helps the trader to objectively assess which broker provides the best trading conditions at different points in time. This is especially important for strategies with high frequency of trades, such as scalping.

5. Data format:

  • Minute spread bars based on each tick. This data is useful for detailed analysis of spread history and current trading conditions.
  • Interaction between instances of the indicator on different terminals via files: this allows sharing spread data between multiple platforms or brokers, synchronizing the analysis.

Who is Real Spread Monitor suitable for?

  • Traders using several brokers: The indicator helps to understand which broker has more favorable trading conditions at different times of the day.
  • Scalpers and active day traders: Real-time spread monitoring helps to minimize trading costs.
  • Analysts: Useful for studying the behavior of market spreads in different conditions and identifying optimal trading periods.

Real Spread Monitor is an indispensable tool for any trader who wants to improve trading conditions and accurately analyze spreads of different brokers, with the ability to flexibly display data on different timeframes.

Input parameters:

=== REAL SPREAD MONITOR === Real Spread Monitor Settings.
Mode Indicator operation mode: Read Mode - read mode; Write Mode - write mode.
File Name The name of the file to read or write spreads. In the Write Mode you can leave empty - the indicator will create the file automatically.
=== MOVING AVERAGES === Moving averages settings.
Show MA Max Show moving average of maximum spreads.
Show MA Avg Show moving average of average spreads.
Show MA Min Show moving average of minimum spreads.
=== GRAPHICS === Graphics settings.
Histogram Max: Color Color of the histogram of maximum spreads values.
Histogram Max: Width Width of the histogram of maximum spreads values.
Histogram Max: Style Style of the histogram of maximum spreads values.
Histogram Avg: Color Color of the histogram of average spreads values.
Histogram Avg: Width Width of the histogram of average spreads values.
Histogram Avg: Style Style of the histogram of average spreads values.
Histogram Min: Color Color of the histogram of minimum spreads values.
Histogram Min: Width Width of the histogram of minimum spreads values.
Histogram Min: Style Style of the histogram of minimum spreads values.
Line MA Max: Color Color of the moving average line of maximum spreads.
Line MA Max: Width Width of the moving average line of maximum spreads.
Line MA Max: Style Style of the moving average line of maximum spreads.
Line MA Avg: Color Color of the moving average line of average spreads.
Line MA Avg: Width Width of the moving average line of average spreads.
Line MA Avg: Style Style of the moving average line of average spreads.
Line MA Min: Color Color of the moving average line of minimum spreads.
Line MA Min: Width Width of the moving average line of minimum spreads.
Line MA Min: Style Style of the moving average line of minimum spreads.
Text Info: Read Mode Color Color of the information text in read mode.
Text Info: Write Mode Color Color of the information text in write mode.
Text Info: Font Size Font size of the information text.
Prodotti consigliati
Auto Fibo Pro m
DMITRII GRIDASOV
Indicatore "Auto FIBO Pro" Crypto_Forex: è un ottimo strumento ausiliario nel trading! - L'indicatore calcola e posiziona automaticamente sul grafico i livelli di Fibo e le linee di tendenza locali (colore rosso). - I livelli di Fibonacci indicano le aree chiave in cui il prezzo può invertirsi. - I livelli più importanti sono 23,6%, 38,2%, 50% e 61,8%. - Puoi usarlo per lo scalping di inversione o per il trading di zone grid. - Ci sono molte opportunità per migliorare il tuo sistema attuale us
Owl smart levels
Sergey Ermolov
4.26 (38)
Versione MT5  |  FAQ L' indicatore Owl Smart Levels   è un sistema di trading completo all'interno dell'unico indicatore che include strumenti di analisi di mercato popolari come i   frattali avanzati di Bill Williams , Valable ZigZag che costruisce   la corretta struttura a onde   del mercato, e i   livelli di Fibonacci che segnano i livelli esatti di entrata nel mercato e luoghi per prendere profitti. Descrizione dettagliata della strategia Istruzioni per lavorare con l'indicatore Consulente-
VR Cub
Vladimir Pastushak
VR Cub è un indicatore per ottenere punti di ingresso di alta qualità. L'indicatore è stato sviluppato per facilitare i calcoli matematici e semplificare la ricerca dei punti di ingresso in una posizione. La strategia di trading per la quale è stato scritto l'indicatore ha dimostrato la sua efficacia per molti anni. La semplicità della strategia di trading è il suo grande vantaggio, che consente anche ai trader alle prime armi di commerciare con successo con essa. VR Cub calcola i punti di apert
Binary Options Support Resistance Indicator This indicator is designed for binary options trading and effectively shows retracements from support and resistance levels. Signals appear on the current candle. A red arrow pointing downwards indicates a potential selling opportunity, while a blue arrow pointing upwards suggests buying opportunities. All that needs adjustment is the color of the signal arrows. It is recommended to use it on the M1-M5 timeframes as signals are frequent on these timef
Axiom Points
Tatiana Savkevych
Axiom Point — Precision Structural Breakout Indicator Axiom Point is a high-performance analytical indicator designed to identify high-probability reversal zones using price-action behaviour and adaptive balance filtering. The indicator applies a multi-layer analytical model to detect moments when price transitions beyond its normal equilibrium area, indicating a potential shift in market momentum. Unlike conventional trend-following tools, Axiom Point focuses on so-called points of no return —
Trendiness Index
Libertas LLC
5 (3)
"The trend is your friend" is one of the best known sayings in investing, because capturing large trendy price movements can be extremely profitable. However, trading with the trend is often easier said than done, because many indicators are based on price reversals not trends. These aren't very effective at identifying trendy periods, or predicting whether trends will continue. We developed the Trendiness Index to help address this problem by indicating the strength and direction of price trend
Alpha Trend sign has been a very popular trading tool in our company for a long time. It can verify our trading system and clearly indicate trading signals, and the signals will not drift. Main functions: Based on the market display of active areas, indicators can be used to intuitively determine whether the current market trend belongs to a trend market or a volatile market. And enter the market according to the indicator arrows, with green arrows indicating buy and red arrows indicating se
Happy Scalping Indicator
Leandro Bernardez Camero
Questo indicatore è stato progettato per uno scalping aggressivo e per entrate rapide nelle opzioni binarie , generando segnali su ogni candela in modo da sapere esattamente cosa sta succedendo in ogni momento. Unisciti al canale Happy Scalping: MQL5 Non ripinta : il segnale della candela attuale viene generato in tempo reale , il che significa che può cambiare mentre la candela è ancora in formazione, a seconda che il prezzo salga o scenda rispetto alla chiusura della candela precedente. Tutt
Trend PA
Mikhail Nazarenko
5 (3)
The Trend PA indicator uses   Price Action   and its own filtering algorithm to determine the trend. This approach helps to accurately determine entry points and the current trend on any timeframe. The indicator uses its own algorithm for analyzing price changes and Price Action. Which gives you the advantage of recognizing, without delay, a new nascent trend with fewer false positives. Trend filtering conditions can be selected in the settings individually for your trading style. The indicator
Noize Absorption Index MT4
Ekaterina Saltykova
5 (1)
Noize Absorption Index - is the manual trading system that measures the difference of pressure between bears forces and bulls forces. Green line - is a noize free index that showing curent situation. Zero value of index shows totally choppy/flat market.Values above zero level shows how powerfull bullish wave is and values below zero measures bearish forces.Up arrow appears on bearish market when it's ready to reverse, dn arrow appears on weak bullish market, as a result of reverse expectation. S
Innanzitutto, vale la pena sottolineare che questo Strumento di Trading è un Indicatore Non-Ridipingente, Non-Ridisegnante e Non-Laggante, il che lo rende ideale per il trading professionale. Corso online, manuale utente e demo. L'Indicatore Smart Price Action Concepts è uno strumento molto potente sia per i nuovi che per i trader esperti. Racchiude più di 20 utili indicatori in uno solo, combinando idee di trading avanzate come l'Analisi del Trader del Circolo Interno e le Strategie di Trading
"Impulses and Corrections 4" is created to help traders navigate the market situation. The indicator shows multi-time frame upward and downward "Impulses" of price movements. These impulses are the basis for determining the "Base" , which is composed of zones of corrections of price movements, as well as "Potential" zones for possible scenarios of price movement. Up and down impulses are determined based on a modified formula of Bill Williams' "Fractals" indicator. The last impulse is always "U
Smart Funded Hft
Barbaros Bulent Kortarla
4.7 (67)
Smart Funded EA è un consulente esperto progettato per superare le sfide HFT delle società prop che ne consentono l'uso. Quali società prop HFT posso utilizzare? È stato testato su quasi tutte le sfide HFT delle società prop con una percentuale di successo del 100%, come Kortana Fx, Nova Funding, Fast Forex Funds, Infinity Forex Funds, Quantec Trading Capital, Next Step Funded, Msolutionff, Genesis Forex Funds, The Talented Traders, Only Funds, Tradicave e tutte le altre sfide MT4 consentite da
Power Renko MT4
Pierce Vallieres
Power Renko is an indicator which plots Renko bricks underneath the chart using a histogram. You can select the brick size and the timeframe of the Renko bricks as well as whether or not to use the close price or the high/low price of the candles. Renko bricks are based on price alone, not time, therefor the Renko bricks will not be aligned with the chart's time. They are extremely useful for trend trading and many different strategies can be formed from them. Buffers are provided allowing you t
This is an arrow indicator without a future function,developed based on the most advanced profit trading algorithms.It has the most innovative and advanced dual trend analysis module, as well as the latest and highly effective market trend prediction algorithm.Trends are your friends, and following larger trends can earn the maximum profit in foreign exchange. This indicator helps traders identify current trends and track them. Someone once made a profit of 10 times in a week by relying on it.No
Daily Candle Predictor è un indicatore che prevede il prezzo di chiusura di una candela. L'indicatore è destinato principalmente all'uso sui grafici D1. Questo indicatore è adatto sia per il trading forex tradizionale che per il trading di opzioni binarie. L'indicatore può essere utilizzato come sistema di trading autonomo o può fungere da aggiunta al sistema di trading esistente. Questo indicatore analizza la candela corrente, calcolando alcuni fattori di forza all'interno del corpo della cande
Trend Oscillator - è un indicatore Crypto_Forex personalizzato avanzato, uno strumento di trading efficiente! - Viene utilizzato un nuovo metodo di calcolo avanzato - 20 opzioni per il parametro "Prezzo per calcolo". - L'oscillatore più fluido mai sviluppato. - Colore verde per i trend al rialzo, colore rosso per i trend al ribasso. - Valori di ipervenduto: inferiori a 5, valori di ipercomprato: superiori a 95. - Ci sono molte opportunità per aggiornare anche le strategie standard con questo i
Step into the world of Forex trading with confidence, clarity, and precision using   Gold Indicator   a next-generation tool engineered to take your trading performance to the next level. Whether you’re a seasoned professional or just beginning your journey in the currency markets, Gold Indicator equips you with powerful insights and help you trade smarter, not harder. Built on the proven synergy of three advanced indicators, Gold Indicator focuses exclusively on medium and long-term trends eli
Trade with Gann on your side!! MASTER CIRCLE 360 CIRCLE CHART, originally created by Gann admitted that this is “The Mother of all charts”. It is one of the last studies that this great trader left for us. The numeric tab le is apparently quite simple like all the tables and is based on square numbers, the SQUARE OF 12 and is by evolution, one of the most important square numbers. Here we can find CYCLE, PRICE AND TIME thanks to angles and grades, to show past and future support and resistance.
The Th3Eng PipFinite indicator is based on a very excellent analysis of the right trend direction with perfect custom algorithms. It show the true direction and the best point to start trading. With StopLoss point and Three Take Profit points. Also it show the right pivot of the price and small points to order to replace the dynamic support and resistance channel, Which surrounds the price. And Finally it draws a very helpful Box on the left side on the chart includes (take profits and Stop loss
Indicatore Crypto_Forex "Morning Star pattern" per MT4. - L'indicatore "Morning Star pattern" è un indicatore molto potente per il trading Price Action: nessuna rielaborazione, nessun ritardo. - L'indicatore rileva i pattern rialzisti Morning Star sul grafico: segnale freccia blu sul grafico (vedi immagini). - Con avvisi su PC, dispositivi mobili ed e-mail. - È disponibile anche il suo fratello, l'indicatore ribassista "Evening Star pattern" (segui il link qui sotto). - L'indicatore "Morning S
Price Magnet — Price Density and Attraction Levels Indicator Price Magnet is a professional analytical tool designed to identify key support and resistance levels based on statistical Price Density. The indicator analyzes a specified historical period and detects price levels where the market spent the most time. These zones act as “magnets,” attracting price action or forming a structural base for potential reversals. Unlike traditional Volume Profile tools, Price Magnet focuses on price-time d
Magic Balance
Daniil Evstratenko
The indicator shows which trading pairs, strategies, robots and signals that you use are profitable and which are not. The statistic of trades and balance graph are displayed in the account currency and pips - to switch simply click on the graph. button "$"(top left) - minimize/expand and move the indicator panel button ">"(bottom right) - stretching and resetting to the original size Statistic of trades 1 line - account balance, current profit and lot of open trades; 2 line - the number of all
Crosskalp1
Mikhail Bilan
Добрый День уважаемые трейдеры!  Вашему вниманию индикатор созданный и работающий на базе трендовика ADX,  для торговли на смене направления движения который учитывает коррекцию и даёт возможность на ней заработать.  Применяю этот индикатор для скальпинга. Рекомендую таймфреймы от 15 ти минутного(М15) до часового (Н1) периодов.  Красный кружок сигнал на продажу- Sell) Зелёный кружок  сигнал на покупку Buy) Чем меньше ваш таймфрейм тем меньше пунктов вы зарабатываете.   Важно выставлять стопы! !В
[ZhiBiCCI] indicators are suitable for all cycle use, and are also suitable for all market varieties. [ZhiBiCCI] Green solid line is a reversal of bullish divergence. The green dotted line is a classic bullish divergence. [ZhiBiCCI] The solid line to the red is a reverse bearish divergence. The red dotted line is a classical bearish divergence. [ZhiBiCCI] can be set in the parameters (Alert, Send mail, Send notification), set to (true) to send instant signals to the alarm window, email, insta
The indicator displays the data of the Stochastic oscillator from a higher timeframe on the chart. The main and signal lines are displayed in a separate window. The stepped response is not smoothed. The indicator is useful for practicing "manual" forex trading strategies, which use the data from several screens with different timeframes of a single symbol. The indicator uses the settings that are identical to the standard ones, and a drop-down list for selecting the timeframe. Indicator Paramet
Introduction It is common practice for professional trades to hide their stop loss / take profit from their brokers. Either from keeping their strategy to the themselves or from the fear that their broker works against them. Using this indicator, the stop loss / take profit points will be drawn on the product chart using the bid price. So, you can see exactly when the price is hit and close it manually.  Usage Once attached to the chart, the indicator scans the open orders to attach lines for t
Super Reversal Pattern
Parfait Mujinga Ndalika
Super Reversal Pattern Indicator Unlock the power of advanced pattern recognition with our Super Reversal Pattern Indicator. Designed for traders seeking precision and reliability, this indicator identifies one of the most effective reversal patterns in technical analysis, offering a significant edge in your trading strategy. Key Features: Non-Repainting Accuracy: Enjoy the confidence of non-repainting technology. Once a Super Reversal Pattern is detected, it remains static, providing consiste
Renko, Heiken Ashi, Ticks Bar, Range Bar.    Easy switching, easy setup, all in one window.        Place the Custom Chart indicator and view Renko, Heiken Ashi, Tick bar, Range bar charts in real time at real chart.    Position the offline chart window so that the indicator control panel is visible.    Switch the chart mode by click of a button.    Connect to the output chart any indicator, expert advisor without any restrictions.    No, it doesn't work in the tester.    Yes, you can use an
Fibonacci retracement and extension line drawing tool Fibonacci retracement and extended line drawing tool for MT4 platform is suitable for traders who use  golden section trading Advantages: There is no extra line, no too long line, and it is easy to observe and find trading opportunities Trial version: https://www.mql5.com/zh/market/product/35884 Main functions: 1. Multiple groups of Fibonacci turns can be drawn directly, and the relationship between important turning points can be seen
Gli utenti di questo prodotto hanno anche acquistato
Scalper Inside PRO
Alexey Minkov
4.74 (69)
An exclusive indicator that utilizes an innovative algorithm to swiftly and accurately determine the market trend. The indicator automatically calculates opening, closing, and profit levels, providing detailed trading statistics. With these features, you can choose the most appropriate trading instrument for the current market conditions. Additionally, you can easily integrate your own arrow indicators into Scalper Inside Pro to quickly evaluate their statistics and profitability. Scalper Inside
Volatility Trend System - un sistema di trading che fornisce segnali per le voci. Il sistema di volatilità fornisce segnali lineari e puntuali nella direzione del trend, nonché segnali per uscirne, senza ridisegnare e ritardi. L'indicatore di tendenza monitora la direzione della tendenza a medio termine, mostra la direzione e il suo cambiamento. L'indicatore di segnale si basa sui cambiamenti della volatilità e mostra gli ingressi nel mercato. L'indicatore è dotato di diversi tipi di avvisi. Pu
RFI levels PRO
Roman Podpora
5 (1)
L'indicatore mostra accuratamente i punti di inversione e le zone di ritorno dei prezzi in cui il       Principali attori   . Vedi dove si formano le nuove tendenze e prendi decisioni con la massima precisione, mantenendo il controllo su ogni operazione. VERSION MT5     -     Rivela il suo massimo potenziale se combinato con l'indicatore   TREND LINES PRO Cosa mostra l'indicatore: Strutture di inversione e livelli di inversione con attivazione all'inizio di un nuovo trend. Visualizzazione dei l
Dynamic Forex28 Navigator
Bernhard Schweigert
4.43 (7)
Dynamic Forex28 Navigator - Lo strumento di trading Forex di nuova generazione. ATTUALMENTE SCONTATO DEL 49%. Dynamic Forex28 Navigator è l'evoluzione dei nostri indicatori popolari di lunga data, che combinano la potenza di tre in uno: Advanced Currency Strength28 Indicator (695 recensioni) + Advanced Currency IMPULSE con ALERT (520 recensioni) + CS28 Combo Signals (Bonus). Dettagli sull'indicatore https://www.mql5.com/en/blogs/post/758844 Cosa offre l'indicatore di forza di nuova generazione?
Precautions for subscribing to indicator This indicator only supports the computer version of MT4 Does not support MT5, mobile phones, tablets The indicator only shows the day's entry arrow The previous history arrow will not be displayed (Live broadcast is for demonstration) The indicator is a trading aid Is not a EA automatic trading No copy trading function The indicator only indicates the entry position No exit (target profit)  The entry stop loss point is set at 30-50 PIPS Or the front hi
GOLD Impulse with Alert
Bernhard Schweigert
4.64 (11)
Questo indicatore è una super combinazione dei nostri 2 prodotti Advanced Currency IMPULSE with ALERT  +   Currency Strength Exotics . Funziona per tutti i time frame e mostra graficamente l'impulso di forza o debolezza per le 8 valute principali più un simbolo! Questo indicatore è specializzato nel mostrare l'accelerazione della forza delle valute per qualsiasi simbolo come oro, coppie esotiche, materie prime, indici o futures. Primo nel suo genere, qualsiasi simbolo può essere aggiunto all
Looking for a powerful yet lightweight swing detector that accurately identifies market structure turning points? Want clear, reliable buy and sell signals that work across any timeframe and any instrument? Buy Sell Arrow MT Swing is built exactly for that — precision swing detection made simple and effective. This indicator identifies Higher Highs (HH) , Higher Lows (HL) , Lower Highs (LH) , and Lower Lows (LL) with remarkable clarity. It is designed to help traders easily visualize market stru
Attualmente 40% di sconto! La soluzione migliore per ogni principiante o trader esperto! Questo software per cruscotti funziona su 28 coppie di valute. Si basa su 2 dei nostri indicatori principali (Advanced Currency Strength 28 e Advanced Currency Impulse). Offre un'ottima panoramica dell'intero mercato Forex. Mostra i valori di forza delle valute avanzate, la velocità di movimento delle valute e i segnali per 28 coppie Forex in tutti i (9) timeframe. Immaginate come migliorerà il vostro tra
Trend Lines PRO
Roman Podpora
5 (1)
LINEE DI TENDENZA PRO       Aiuta a capire dove il mercato sta realmente cambiando direzione. L'indicatore mostra reali inversioni di tendenza e punti in cui i principali attori rientrano. Vedi  Linee BOS   Cambiamenti di tendenza e livelli chiave su timeframe più ampi, senza impostazioni complesse o rumore inutile. I segnali non vengono ridisegnati e rimangono sul grafico dopo la chiusura della barra. VERSIONE MT 5     -      Svela il suo massimo potenziale se abbinato all'indicatore   RFI LEVE
El indicador "MR BEAST ALERTAS DE LIQUIDEZ" es una herramienta avanzada diseñada para proporcionar señales y alertas sobre la liquidez del mercado basándose en una serie de indicadores técnicos y análisis de tendencias. Ideal para traders que buscan oportunidades de trading en función de la dinámica de precios y los niveles de volatilidad, este indicador ofrece una visualización clara y detallada en la ventana del gráfico de MetaTrader. Características Principales: Canal ATR Adaptativo: Calcula
IQ FX Gann Levels a precision trading indicator based on W.D. Gann’s square root methods . It plots real-time, non-repainting support and resistance levels to help traders confidently spot intraday and scalping opportunities with high accuracy. William Delbert Gann (W.D. Gann) was an exceptional market analyst, whose trading technique was based on a complex blend of mathematics, geometry, astrology, and ancient mathematics which proved to be extremely accurate. Setup & Guide:  Download  MT5 Ver
PZ Harmonacci Patterns
PZ TRADING SLU
3.17 (6)
Trade smarter, not harder: Empower your trading with Harmonacci Patterns This is arguably the most complete harmonic price formation auto-recognition indicator you can find for the MetaTrader Platform. It detects 19 different patterns, takes fibonacci projections as seriously as you do, displays the Potential Reversal Zone (PRZ) and finds suitable stop-loss and take-profit levels. [ Installation Guide | Update Guide | Troubleshooting | FAQ | All Products ] It detects 19 different harmonic pric
Meravith
Ivan Stefanov
5 (3)
Strumento per market maker. Meravith: Analizzerà tutti i timeframe e mostrerà il trend attualmente in corso. Evidenzierà le zone di liquidità (equilibrio dei volumi) dove i volumi rialzisti e ribassisti sono uguali. Mostrerà tutti i livelli di liquidità dei diversi timeframe direttamente sul grafico. Genererà e presenterà un’analisi di mercato testuale a scopo di riferimento. Calcolerà obiettivi, livelli di supporto e punti di stop-loss in base al trend attuale. Calcolerà il rapporto rischio/ren
System Trend Pro
Aleksandr Makarov
5 (2)
System Trend Pro - This is the best trend trading indicator!!! The indicator no repaint!!!  The indicator has   MTF   mode, which adds confidence to trading on the trend (   no repaint   ). How to trade? Everything is very simple, we wait for the first signal (big arrow), then wait for the second signal (small arrow) and enter the market in the direction of the arrow. (See screens 1 and 2.) Exit on the opposite signal or take 20-30 pips, close half of it, and keep the rest until the opposite
Smart Sweep Sniper MT4
Vincent Georges David Ferrier
# Smart Sweep Sniper MT4 Version MT4 Midnight Pro Edition , specialized for scalping and day trading in Prop Firm, Available here PROTOCOL - Institutional Liquidity Grab & SMC available here ## The Institutional Edge — Detect Where Smart Money Acts, Enter When It Matters If you like it, leave a positive review to support its development. If you encounter a bug, let us know before posting a review. When you complete your challenge, share your certificate in the comments. Happy trading! Smart Sw
No Repaint Bext is a ready-made trading system. Shows when to open and when to close trades, as well as in which direction. Every time a green arrow appears, you need to open a buy trade. Close all buy trades when a red arrow appears. The same goes for the opposite direction, every time a red arrow appears, open sell trades and close them all when a green arrow appears. We use the M5 timeframe for trading. You can trade on any cozy pair. This indicator does not repaint and practically does not
Currency Strength Exotics
Bernhard Schweigert
4.88 (33)
ATTUALMENTE SCONTATO DEL 20%! La soluzione migliore per qualsiasi principiante o trader esperto! Questo indicatore è specializzato nel mostrare la forza della valuta per qualsiasi simbolo come coppie esotiche, materie prime, indici o futures. È il primo nel suo genere, qualsiasi simbolo può essere aggiunto alla nona riga per mostrare la vera forza della valuta di Oro, Argento, Petrolio, DAX, US30, MXN, TRY, CNH ecc. Si tratta di uno strumento di trading unico, di alta qualità e conveniente pe
L'indicatore " Dynamic Scalper System " è progettato per il metodo di scalping, ovvero per il trading all'interno di onde di trend. Testato sulle principali coppie di valute e sull'oro, è compatibile con altri strumenti di trading. Fornisce segnali per l'apertura di posizioni a breve termine lungo il trend, con ulteriore supporto al movimento dei prezzi. Il principio dell'indicatore. Le frecce grandi determinano la direzione del trend. Un algoritmo per generare segnali per lo scalping sotto fo
Are you looking for a simple and reliable indicator that can help you spot market swing points easily? Do you want clear buy and sell signals that work on any timeframe and any trading instrument? Buy Sell Signal Pro is designed to do exactly that. It helps traders identify important market turning points and understand the current market structure in a clear and easy way. This indicator detects Higher Highs (HH), Higher Lows (HL), Lower Highs (LH), and Lower Lows (LL) so you can quickly see wh
TPSproTREND PrO
Roman Podpora
4.67 (27)
TPSproTrend PRO       - si tratta di un indicatore di tendenza che analizza automaticamente il mercato e fornisce informazioni sulla tendenza e sui suoi cambiamenti, oltre a visualizzare i punti di ingresso per le negoziazioni       senza ridisegnare! ИНСТРУКЦИЯ RUS   -   ISTRUZIONI   ITA   -   VERSIONE MT5 Funzioni principali: Segnali di ingresso precisi       SENZA RIVERNICIARE! Una volta che un segnale appare, rimane valido! Questa è una differenza significativa rispetto alla rielaborazione
Super Signal – Skyblade Edition Sistema professionale di segnali di tendenza senza repaint / senza ritardo con tasso di vincita eccezionale | Per MT4 / MT5 Funziona meglio su timeframe più bassi, come 1 minuto, 5 minuti e 15 minuti. Caratteristiche principali: Super Signal – Skyblade Edition è un sistema intelligente di segnali progettato specificamente per il trading di tendenza. Utilizza una logica di filtraggio multilivello per identificare esclusivamente i movimenti direzionali forti, supp
Smc Blast Signal
Mohit Dhariwal
3.4 (5)
OFFER OFFER! The price of the indicator is kept at 75 dollars only from 20th Feb to 28th Feb. Full Fledged EA and Alert plus for alerts will also be provided in this offer along with the purchase of Indicator. Limited copies only at this price and Ea too. Grab your copy soon Alert plus for indicator with set file is kept in comment section with the image  SMC Blast Signal with FVG, BOS and trend Breakout The SMC Blast Signal is a Precise trading system for Meta Trader 4 that uses Smart Money Con
GM Arrows Pro
Guillaume Pierre Philippe Mesplont
Product Name: GM Arrows Pro – Signals & Alerts Short Description: GM Arrows Pro is a clean, reliable MT4 indicator showing BUY/SELL arrows on the chart with unique alerts at the moment the signal appears. Full Description: GM Arrows Pro is a professional MT4 indicator designed for traders who want clear, actionable signals: BUY and SELL arrows visible on the entire chart history Unique alerts when a new signal appears (no repeated alerts) Option to disable repetitive signals ( disable_repeatin
VPPD - Volume Profile POC Delta *Professional Volume Analysis Tool for MetaTrader 4* ---   INDICATOR FEATURES   Unique Capabilities: **Advanced Volume Profile** - Horizontal volume histograms across selected periods - Precise Point of Control (POC) identification — the level of maximum volume **Delta Analysis (Exclusive Feature!)** - Volume delta calculation — buy/sell ratio - Tick movement simulation inside bars - POC color coding:   - Green — Bullish delta (buyers dominate)   -
Indicatore Miraculous – Strumento Forex e Binario 100% Non-Repaint Basato sul Quadrato di Nove di Gann Questo video presenta l' Indicatore Miraculous , uno strumento di trading altamente accurato e potente, sviluppato specificamente per i trader di Forex e Opzioni Binarie . Ciò che rende unico questo indicatore è la sua base sul leggendario Quadrato di Nove di Gann e sulla Legge della Vibrazione di Gann , rendendolo uno degli strumenti di previsione più precisi disponibili nel trading moderno. L
Segnale GoldRush Trend Arrow L'indicatore GoldRush Trend Arrow Signal fornisce un'analisi precisa e in tempo reale dei trend, pensata appositamente per gli scalper ad alta velocità e a breve termine nel mercato XAU/USD. Progettato specificamente per il timeframe di 1 minuto, questo strumento mostra frecce direzionali che indicano chiari punti di ingresso, consentendo agli scalper di navigare con sicurezza nelle condizioni di mercato volatili. L'indicatore è composto da frecce di avviso PRIMA
Presenting one-of-a-kind Gann Indicator for XAUUSD IQ Gold Gann Levels is a non-repainting, precision tool designed exclusively for XAUUSD/Gold intraday trading. It uses W.D. Gann’s square root method to plot real-time support and resistance levels, helping traders spot high-probability entries with confidence and clarity. William Delbert Gann (W.D. Gann) was an exceptional market analyst whose trading technique was based on a complex blend of mathematics, geometry, astrology, and ancient calcul
PairMaster Buy Sell Arrow Indicator for MT4 Trade Reversals Like a Pro — Catch Every Swing Point with Precision The PairMaster Buy Sell Arrow Indicator is a powerful MetaTrader 4 tool built to identify high-probability swing trading opportunities . Designed for traders who value accuracy, clarity, and simplicity, PairMaster detects key market turning points and plots intuitive buy and sell arrows directly on your chart. Key Features Accurate Swing Point Detection – Automatically identifies ma
Un indicatore tecnico che struttura i grafici e identifica i movimenti ciclici dei prezzi. Può funzionare su qualsiasi grafico. Diversi tipi di notifiche. Ci sono altre frecce sul grafico stesso. Senza ridisegnare la storia, lavora sulla chiusura della candela. TF consigliati da M5 in su. Parametri facili da usare e configurare. Se si utilizzano 2 indicatori con parametri diversi, è possibile utilizzarli senza altri indicatori. Ha 2 parametri di input Ciclicità e durata del segnale Questi 2 pa
Product Name:   Quantum Regime Indicator Short Description:   A multi-engine structural regime and volatility filter. Description: Quantum Regime Indicator (QRI) is a sophisticated technical analysis algorithm designed to identify market structure shifts and volatility regimes. Unlike standard indicators that rely on immediate price action, QRI utilizes a hierarchical logic architecture to filter market noise and identify statistical extremes. The indicator is built on the philosophy of "Market
Altri dall’autore
Volume Horizon is a horizontal volume indicator that allows you to observe the density of market participants' volumes across various price and time intervals. Volume histograms can be constructed based on ascending or descending market waves, as well as individual bars. This tool enables more precise determination of entry or exit points, relying on levels of maximum volumes or volume-weighted average prices (VWAP). What makes Volume Horizon unique? 1. Segmentation into ascending and descendi
Double Fractal Entry generates precise entry signals based on smart fractal breakouts or rebounds. It visualizes market structure with dynamic channels and plots clear SL/TP levels. A powerful tool for trend and reversal traders. This product is also available for MetaTrader 4 =>  https://www.mql5.com/en/market/product/143602 The indicator generates entry points based on two configurable strategies: Fractal Breakout – when price breaks the last key fractal; Fractal Rebound – when price bounces
SuperCCI
Denys Babiak
Description SuperCCI is an indicator based on the standard CCI indicator. It identifies and displays convergences/divergences in the market and forms the corresponding entry points. Also, using the trading channel index, it determines the direction of the trend and displays the levels of support and resistance . Features Not repaint. Shows entry points. Shows the direction of the current trend and support/resistance levels. Has notifications. Recommendations Use convergence/divergence to ide
Description Range Detector   is an indicator that identifies ranges in the market and displays their presence on the price chart. Recommendations You can use this indicator to determine the flet and, accordingly, to determine the direction of opening a position or closing an opposite position. Parameters Maximum History Bars   - maximum number of history bars for calculating the indicator. Average True Range Period   - ATR indicator period (used to calculate the difference between moving a
Impulse Angle
Denys Babiak
4 (3)
Description Range Detector   is an indicator that identifies impulses in the market and displays their slope angles on the chart. Recommendations You can use this indicator to determine a trend and, accordingly, to determine the direction of opening a position or closing an opposite position. Parameters ===== _INDICATOR_SETTINGS_ =====   - indicator settings Maximum History Bars   - maximum number of history bars for calculating the indicator. Average True Range Period   - ATR indicator p
Volume Magic
Denys Babiak
3.67 (3)
Description Volume Magic is an indicator that shows the value of the relative volume in conjunction with the direction of the current trend. The ratio of the current volume relative to the average volume for a certain period is displayed in the lower window as an oscillator. The direction of the current trend is displayed as two-color trend lines. How to use? First, use two-color trend lines to determine the direction of the current trend. Then look for areas of low volume and open positions
Description Money Zones is an indicator that determines accumulation/distribution zones in the market. Green zones make it possible to look for buy entry points or sell exit points. Red zones, on the contrary, define the opportunity for selling or closing buys. The indicator has the ability to define money zones for two timeframes simultaneously on the same chart. How to use? Use this indicator to identify market zones as support/resistance zones to determine the best conditions for market e
Description Bitcoin Manager is the best indicator for trading Bitcoin cryptocurrency. It is calculated based on the price deviation from the moving average line channel. Ascending and descending arrows indicate potential points and levels for opening buy and sell positions. How to use? We strongly recommend using this indicator on the H1 timeframe. An up arrow indicates a buy level. Down Arrow - Sell Level. Parameters Maximum History Bars - maximum count of history bars to calculate. _GRAP
Description The Quantum Awesome Oscillator indicator is based on the standard Bill Williams Awesome Oscillator (AO) indicator. It has two parts. The lower part is a colored histogram of the oscillator (divided into two sides - above zero and below zero and, accordingly, colored in two colors - blue for buying and red for selling) and a trend curve line (shows the direction of the global trend). The upper part - arrows showing market entry points, as well as dashed lines showing Stop-Loss and Ta
Description The Quantum Awesome Oscillator Pro indicator is based on the standard Bill Williams Awesome Oscillator (AO) indicator. It has two parts. The lower part is a colored histogram of the oscillator (divided into two sides - above zero and below zero and, accordingly, colored in two colors - blue for buying and red for selling) and a trend curve line (shows the direction of the global trend). The upper part - arrows showing market entry points, as well as dashed lines showing Stop-Loss an
Description Trend Influencer is an indicator that determines the potential dynamics of the influence of trend wave movements on the market. The indicator is based on the value of moving averages corrected by the standard deviation. The indicator is displayed as a main dash-dotted moving average and a signal solid moving average. The signal moving average is colored blue or red depending on what type of trend is currently observed in the market. The indicator also draws inhibition levels - blue a
Let us introduce you to a new era of neural indicators for financial markets! Intelligent Moving is a unique indicator that trains its neural network in real time! You no longer need to look for the optimal indicator parameters for each specific situation. No more late signals. The artificial intelligence is able to adapt itself and predict any market movements. Visually, the indicator is drawn as a main solid moving average line, two dotted lines of standard deviations and signal arrows. For
Fractal Bot Gold is a trading bot that utilizes breakout and rebound strategies from fractal levels to determine effective entry points for positions, as well as to set safe stop-losses and take-profits. Combined with the Average True Range (ATR) indicator and precise adaptation to market conditions, it minimizes the impact of market noise and volatility, providing reliable risk management and optimizing profits. The bot’s parameters are carefully optimized and adapted for trading the Gold (XAU
One Good Trade is a simple and effective Forex trading bot that implements the "time determines price" strategy. Its main feature is just one trade per day, executed at the optimal time and in the direction of the current trend. This straightforward approach allows you to take full advantage of favorable market conditions while minimizing risks. Additionally, the bot adjusts to market volatility, ensuring that stop-loss and take-profit levels are set appropriately for current market conditions.
Position Accelerator is an innovative solution for traders that helps maximize profits by capitalizing on trending market movements. The utility automatically increases the size of your trading positions once they reach a predefined profit level, significantly enhancing your profitability. This product is also available for MetaTrader 5 =>  https://www.mql5.com/en/market/product/126702 How does Position Accelerator work? 1. Acceleration through additional positions: When your open position reac
The ABC Indicator analyzes the market through waves, impulses, and trends, helping identify key reversal and trend-change points. It automatically detects waves A, B, and C, along with stop-loss and take-profit levels. A reliable tool to enhance the accuracy and efficiency of your trading. This product is also available for MetaTrader 5 =>  https://www.mql5.com/en/market/product/128178 Key Features of the Indicator: 1. Wave and Trend Identification:    - Automatic detection of waves based on mov
ZLMA Trend Candles indicator uses an enhanced Zero-Lag Moving Average to highlight key trend shifts, repainting candles in real time. It reacts faster than traditional moving averages, helping you spot potential market turns earlier. Gain clear entry and exit signals and filter out market noise with ease! This product is also available for MetaTrader 5 =>  https://www.mql5.com/en/market/product/129278 1. What Is ZLMA Trend Candles? ZLMA Trend Candles is a MetaTrader 4/5 indicator based on the Z
Fibo Extrema Bands is a unique indicator that visually demonstrates when the market shifts into a trend and highlights key levels acting as support or resistance. It combines easy-to-read “stepped” extrema lines with Fibonacci levels (whose values can be adjusted in the indicator’s inputs), simplifying the search for entry and exit points. Install Fibo Extrema Bands to gain a powerful tool for trend analysis and for identifying critical price levels! This product is also available for MetaTrade
Trend Risk Analyzer intelligently identifies trends, impulses, and corrections, calculating optimal trade volumes and safe levels for stop-loss and take-profit. Increase your accuracy, reduce risks, and boost your trading profits! This product is also available for MetaTrader 5 =>  https://www.mql5.com/en/market/product/134799 The key feature of Trend Risk Analyzer is its capability to calculate the average range of each market element, enabling traders to set justified stop-loss and take-profi
Double Fractal Entry generates precise entry signals based on smart fractal breakouts or rebounds. It visualizes market structure with dynamic channels and plots clear SL/TP levels. A powerful tool for trend and reversal traders. This product is also available for MetaTrader 5 =>  https://www.mql5.com/en/market/product/143601 The indicator generates entry points based on two configurable strategies: Fractal Breakout – when price breaks the last key fractal; Fractal Rebound – when price bounces
Double Fractal Entry Bot trades automatically using fractal breakouts or rebounds. It detects precise entry points, places SL and TP based on market structure, and includes logic to manage risk and avoid false signals. Simple, smart, and powerful. This product is also available for MetaTrader 5 =>  https://www.mql5.com/en/market/product/143608 Double Fractal Entry Bot is an intelligent trading robot based on the proven logic of the Double Fractal Entry indicator. It analyzes price using upper a
Intelligent Moving Bot — Adaptive EA with Neural Optimization Intelligent Moving Bot is a fully autonomous EA built on the Intelligent Moving indicator. It uses a dynamic MA, ATR-based deviation bands, and virtual trades with a perceptron to optimize parameters on the fly — with no repainting and no manual curve-fitting. This product is also available for MetaTrader 5 =>  https://www.mql5.com/en/market/product/148151 Intelligent Moving indicator is available here =>  https://www.mql5.com/en/
Imbalance Volume Trend is a professional indicator for MetaTrader that combines Fair Value Gap (FVG) / Imbalance zones with volume imbalance analysis and a trend engine based on imbalances . The indicator automatically finds bullish and bearish Fair Value Gaps, paints them on the chart as colored rectangles and calculates the percentage of volume domination of buyers over sellers (or vice versa) inside the breakout candle that created the imbalance. On top of that, it builds a trend of imbalance
Description Range Detector   is an indicator that identifies ranges in the market and displays their presence on the price chart. Recommendations You can use this indicator to determine the flet and, accordingly, to determine the direction of opening a position or closing an opposite position. Parameters Maximum History Bars   - maximum number of history bars for calculating the indicator. Average True Range Period   - ATR indicator period (used to calculate the difference between moving a
Description Range Detector is an indicator that identifies impulses in the market and displays their slope angles on the chart. Recommendations You can use this indicator to determine a trend and, accordingly, to determine the direction of opening a position or closing an opposite position. Parameters ===== _INDICATOR_SETTINGS_ ===== - indicator settings Maximum History Bars - maximum number of history bars for calculating the indicator. Average True Range Period - ATR indicator period (us
Description SuperCCI is an indicator based on the standard CCI indicator. It identifies and displays convergences/divergences in the market and forms the corresponding entry points. Also, using the trading channel index, it determines the direction of the trend and displays the levels of support and resistance . Features Not repaint. Shows entry points. Shows the direction of the current trend and support/resistance levels. Has notifications. Recommendations Use convergence/divergence to ide
Description Volume Magic is an indicator that shows the value of the relative volume in conjunction with the direction of the current trend. The ratio of the current volume relative to the average volume for a certain period is displayed in the lower window as an oscillator. The direction of the current trend is displayed as two-color trend lines. How to use? First, use two-color trend lines to determine the direction of the current trend. Then look for areas of low volume and open positions
Description Money Zones is an indicator that determines accumulation/distribution zones in the market. Green zones make it possible to look for buy entry points or sell exit points. Red zones, on the contrary, define the opportunity for selling or closing buys. The indicator has the ability to define money zones for two timeframes simultaneously on the same chart. How to use? Use this indicator to identify market zones as support/resistance zones to determine the best conditions for market e
Description Bitcoin Manager is the best indicator for trading Bitcoin cryptocurrency. It is calculated based on the price deviation from the moving average line channel. Ascending and descending arrows indicate potential points and levels for opening buy and sell positions. How to use? We strongly recommend using this indicator on the H1 timeframe. An up arrow indicates a buy level. Down Arrow - Sell Level. Parameters Maximum History Bars - maximum count of history bars to calculate. _GRAP
Description Trend Influencer is an indicator that determines the potential dynamics of the influence of trend wave movements on the market. The indicator is based on the value of moving averages corrected by the standard deviation. The indicator is displayed as a main dash-dotted moving average and a signal solid moving average. The signal moving average is colored blue or red depending on what type of trend is currently observed in the market. The indicator also draws inhibition levels - blue a
Filtro:
Nessuna recensione
Rispondi alla recensione