Regardez les tutoriels vidéo de Market sur YouTube
Comment acheter un robot de trading ou un indicateur
Exécutez votre EA sur
hébergement virtuel
hébergement virtuel
Test un indicateur/robot de trading avant d'acheter
Vous voulez gagner de l'argent sur Market ?
Comment présenter un produit pour qu'il se vende bien
Indicateurs techniques payants pour MetaTrader 4 - 114

API BullBearPower mtf
Designed for traders who rely on BullBearPower, this tool provides a multi-timeframe (MTF) view of BullBearPower, helping you identify possible dominant trends.
Key Features: Multi-Timeframe Analysis – Analyze BullBearPower across different timeframes in real time. Dynamic Color Changes – Identify possible BullBearPower per individual timeframe with color changes. Volume Integration – Get a picture of possible trend strength with BullBearPower volume of each timefra

The Time_Price_SQ9_Degree indicator is based on the 9 Gann square. Using this indicator, you can identify strong time and price zones. The indicator displays the levels as a degree value. The degrees can be set in the settings. After launching, the MENU button appears. If it is highlighted, it can be moved to any point on the graph, and after double-clicking on it, it stops being highlighted and menu buttons appear. To hide the menu, just double-click on the button, it will become highlighted a
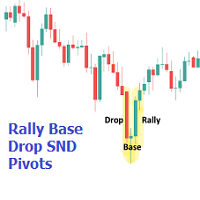
The Rally Base Drop SND Pivots indicator uses "Rally", "Base", and "Drop" Candles to determine pivot points at which supply and demand (SND) levels are drawn. (Figure 1) USAGE Figure 2 Rally, Base, and Drop (RBD) candles create a formula for seeing market structure through a fixed methodology. We are able to use this concept to point out pivot areas where Rallies and Drops directly meet.
The RBD SND Pivots are similar to traditionally identified "fractal" pivot points, with one key differ

Indicateur Crypto_Forex « Morning Star » pour MT4.
- L'indicateur « Morning Star » est un indicateur très performant pour le trading Price Action : sans refonte, sans délai. - L'indicateur détecte les figures haussières Morning Star sur le graphique : signal de flèche bleue (voir images). - Alertes PC, mobile et e-mail. - Son homologue baissier « Evening Star » est également disponible (suivez le lien ci-dessous). - L'indicateur « Morning Star » est idéal pour combiner les niveaux de support e
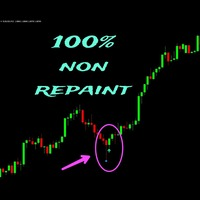
Forexo is an easy-to-use Forex indicator that gives traders clear and accurate signals based on clear trend retests . Forget about lagging indicators or staring at charts for hours because this Forexo indicator provides real-time entries with no lag and no repaint, so you can trade with confidence without analyzing the market. Working of indicator:
This indicator is based on price action with help of stochastic, RSI & SMA.
Setup Recommendation:
Recommended timeframes: Any timeframe works
FOREX FLIP ALERT - Show where the price will reverse with more than 95% probability. This information will help every trader to effectively open trades. The indicator on the chart draws arrows in which place and in which direction the price will reverse. The indicator does not redraw its arrows and shows price reversals for medium and long distances. This means that after the arrow appears, the price will go in the indicated direction for many points.
Benefits of the indicator: Gives sign

The ATR Trailing Stop Pro is a powerful trend-following indicator designed to help traders manage risk and maximize profits. Based on the Average True Range (ATR), this indicator dynamically adjusts stop-loss levels to lock in gains and minimize losses. Key Features : Dual ATR Trailing Stops : Combines fast and slow ATR trails for optimal performance. Dynamic Stop Loss : Automatically adjusts to market volatility. Buy/Sell Signals : Clear visual alerts for entry and exit points. Cust

Special offer! https://www.mql5.com/ru/users/bossik2810 Bomb Signal is a powerful indicator for MetaTrader 4 designed to identify the most relevant trends in the financial market. If you are looking for a tool that accurately predicts movements, Bomb Signal is your ally. How does this work: This indicator combines three different methods – volume analysis, candlestick closing and symmetrical trend – to detect and signal buying and selling opportunities. Bomb Signal is like a “bomb” when it dete

The LOWESS is a sophisticated trend-following indicator designed to help traders identify, analyze, and act on market trends with precision and minimal lag. Built around the LOWESS (Locally Weighted Scatterplot Smoothing) algorithm, it filters out market noise to reveal the underlying price direction. Enhanced with dynamic visuals, volatility-based bands, momentum insights, and features like alerts and trend strength analysis, this indicator offers a comprehensive toolkit for navigating today’s

This is a true trend lines indicator for MT4/MT5.
This indicator draw real trend lines.
Usually the trend line is drawn as a solid line.
The next trend line that is likely to be valid is drawn as a dotted line.
The most recent invalidated trend line is drawn as a dashed line.
Three-touch lines is drawn as a bright colors.
If the starting point of the trend line is new, the blue line is displayed(call shortline),
if it is old, the gold line is displayed(call longline).
The number of bars border

Microsoft Word - Installation - TrendFollower-1 Trend Follower 1 This indicator consists of three key components: an upper band, a lower band, and a middle line. A buy signal is generated when the price closes above the upper band, indicating strong bullish momentum and a potential trend continuation. Conversely, a sell signal occurs when the price closes below the lower band, signaling bearish strength and a possible downward move. The middle line serves as a dynamic support or resistance leve

Microsoft Word - Installation - TrendFollower-2 Trend Follower 2 This trend-following indicator with upper and lower bands is a powerful tool for identifying market momentum and generating trade signals. This indicator consists of three lines: the upper band, lower band, and middle line. A buy signal is triggered when the price closes above the upper band, indicating strong bullish momentum and a potential continuation of the uptrend. Conversely, a sell signal is generated when the price closes

Parabolic SAR + Deviation [BigBeluga] is an enhanced Parabolic SAR indicator designed to detect trends while incorporating deviation levels and trend change markers for added depth in analyzing price movements. Key Features: > Parabolic SAR with Optimized Settings: Built on the classic Parabolic SAR, this version uses predefined default settings to enhance its ability to detect and confirm trends. Clear trend direction is indicated by smooth trend lines, allowing traders to easily visuali

Trend Risk Analyzer intelligently identifies trends, impulses, and corrections, calculating optimal trade volumes and safe levels for stop-loss and take-profit. Increase your accuracy, reduce risks, and boost your trading profits! This product is also available for MetaTrader 5 => https://www.mql5.com/en/market/product/134799 The key feature of Trend Risk Analyzer is its capability to calculate the average range of each market element, enabling traders to set justified stop-loss and take-profi

Entry Maker (Full) – Générateur de signaux basé sur l'heure avec SL/TP et filtre de bougie
Fonctionne sur toutes les paires et unités de temps.
Aucun repaint. Interface propre. Contrôle total sur les entrées horaires. Caractéristiques principales
– Signaux d’entrée à heure précise (heures et minutes)
– SL/TP fixes en pips
– Ajustement SL/TP automatique après SL
– TP basé sur S1, S2, R1, R2 (optionnel)
– Flèches d'entrée visuelles personnalisables
– Filtre de bougie verte (optionnel)
– Deuxième f
这段代码是一个用于 MetaTrader 4 (MT4) 平台的MQL4指标脚本,主要功能是在图表上实时显示以下信息: 当前K线的剩余时间 (格式为 X分Y秒 )。 本地时间 (格式为 HH:MM:SS )。 代码的主要组成部分包括: 初始化函数 OnInit : 创建文本对象用于显示时间和剩余时间。 计算并打印本地时间与服务器时间的差异。 初始化定时器,每1秒触发一次 OnTimer 。 反初始化函数 OnDeinit : 删除文本对象。 销毁定时器。 计算函数 OnCalculate : 计算当前K线的剩余时间。 获取本地时间并格式化。 更新文本对象的内容和位置,确保显示信息实时更新。 定时器函数 OnTimer : 每1秒调用一次 OnCalculate ,强制更新时间显示。 辅助函数 FormatRemainingTime : 将剩余时间(秒)格式化为 X分Y秒 的字符串。

Contact me through this email address to download the FREE strategy PDF for this indicator tharindu999lakmal@gmail.com
Download MT5 version here -- >> https://www.mql5.com/en/market/product/119467
Introduction The "VIP Buy Sell Signals MT" is designed to provide BUY and SELL trade signals based on the current market conditions. A Trading Strategy (Chee sheet) has been provided for this trading indicator. (Read the description). This indicator has time tuned e ntry signals . so

Tired of being on the wrong side of the trend? MT4 ROADS puts the power of the Moving Average Channel in your hands. Dynamically plots buy and sell zones using a custom moving average Clearly identifies the current market trend for more confident trading Fully customizable settings to optimize performance for your strategy Visual signal potential trend changes before they happen The MT4 ROADS indicator is your personal market navigator, guiding you through the unpredictable ebb and flow of volat

Linear Trend Predictor - Un indicateur de tendance qui combine des points d'entrée et des lignes de support de direction. Fonctionne sur le principe de franchissement du canal des prix haut/bas.
L'algorithme de l'indicateur filtre le bruit du marché, prend en compte la volatilité et la dynamique du marché.
Capacités de l'indicateur
À l'aide de méthodes de lissage, il montre la tendance du marché et les points d'entrée pour l'ouverture d'ordres d'ACHAT ou de VENTE. Convient pour déterminer l
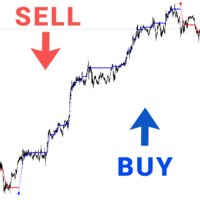
Golding Trend: 100% does not repaint its signals.
Designed specifically for Gold GOLD/XAUUSD Special offer - https://www.mql5.com/en/users/bossik2810
Golding Trend is designed to identify the most relevant trends in the financial market. If you are looking for a tool that accurately predicts movements, Golding Trend is your ally. Trading with this indicator is very easy. We wait for a signal from the indicator and enter the transaction according to the arrow (Blue arrow - Buy, Red - Sell). N
推荐这款分时均线指标程序!它在主窗口直观展示实时价格与 30 分钟、60 分钟、120 分钟均线,助您精准把握日内趋势。参数可灵活调整,支持多种均线类型,适配不同交易风格。代码优化高效,避免重复计算,运行流畅。清晰的多色线条与标签设计,让价格与均线的关系一目了然,助力您快速捕捉交易信号。简洁实用的设计,是日内交易者分析行情的得力工具,值得一试。配合MACD及HAM买卖提示能对交易有质的提升。 1. 指标显示设置 借助 #property 指令对指标的显示属性加以设置: #property indicator_chart_window :保证指标在交易图表的主窗口显示。 #property indicator_buffers 4 :设定指标运用 4 个数据缓冲区,分别用来存储实时价格以及 3 种不同周期的均线数据。 #property indicator_colorX :为不同的线条设定颜色,例如价格线是蓝色,30 分钟均线是红色,60 分钟均线是绿色,120 分钟均线是紫色。 2. 输入参数设置 提供了几个可调节的输入参数,用户能够依据自身需求进行修改: MAPeriod1 、

Receive notifications for multi-trendline or single trendline breakout. Yes! You heard us right! You will be notified the moment price crosses any and all the timeframe trendlines that you have chosen. 1. ADDING MULTIPLE OR SINGLE TRENDLINES IN THE SAME DIRECTION To trigger a stronger trading opportunity you can require that price breaks one or more trend lines of different timeframes in the same direction. To do this navigate to the timeframe for which you want to add a trendline and click
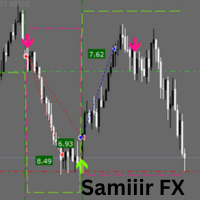
Samiiir FX: Your Ultimate MT4 Trading Companion for Precision and Profit Elevate your trading game with Samiiir FX , a premium MT4 indicator designed to deliver clear, actionable buy and sell signals across forex, commodities, and indices. Built for traders who demand precision and reliability, Samiiir FX combines advanced market analysis with intuitive visuals and robust risk management tools. Whether you're a scalper hunting quick profits, a day trader seeking consistency, or a swing trader a
Advantages of EMA Moving Average Trading System:
Trend-Following Nature : EMAs effectively identify and follow market trends by giving more weight to recent prices, allowing traders to stay aligned with the dominant market direction. Reduced Lag : Compared to Simple Moving Averages (SMAs), EMAs react more quickly to price changes, making them better suited for dynamic market conditions. Flexibility : Traders can customize EMA periods to match different trading styles (e.g., short-term, medium-
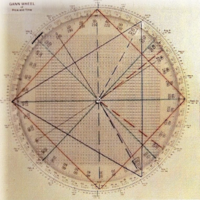
The Naveen Dynamic Square is one of the best known technical analysis tools inspired by WD Gann along with the Gann Fan and Gann Box. It is considered a cornerstone of his trading technique that is based on time and price symmetry.
The Naveen Dynamic Square is a powerful tool in finance for determining support and resistance levels based on a stock's extreme price points. It works by extrapolating probable price levels from a central value, typically an all-time or cyclical high or low. This

Wave Synchronizer - indicateur visuel de l'analyse des vagues. Combine les séquences de mouvements de chandeliers et produit des modèles d'ondes directionnelles, produisant des mouvements synchrones avec le marché.
Le début de chaque vague commence par une flèche de signal, il y a aussi des notifications.
L'indicateur ne redessinera ni ne déplacera jamais les flèches sur l'historique passé.
Des flèches de signal apparaissent à la clôture de la bougie.
S'adapte pour fonctionner avec tous les ins

Direct Scalping MT4 shows the most SUPER SUPER SUPER EARLY opportunity to scalp the market. Do entry as early as possible, as soon as the first sign appears. It plays sound alert so that you can wait the moment while do something else. Remember to cut loss below the '' area. Yes, it is not stop loss but cut loss (exit on candle close).
Made for M1 timeframe, but higher is good too.
My new favorite setup: M3 using 8 indicators with different parameters: 11, 18, 25, 32, 39, 46, 53, and 60. Comb

Pro Period Separators For MetaTrader 4 The built-in period separators feature doesn’t allow users to specify the time period, so you can use this indicator to create advanced period separators, you can add daily, weekly, monthly, yearly separators on any time frame. Default Inputs DAILY SEPARATOR SETTINGS show daily separators = Yes hour of the separators = 04 minute of the separators = 00 color of the separators = Silver width of the separators = 1 style of the separators = STYLE_DOT WEEKLY_SE

L' indicateur ICT Asian Range est un outil puissant conçu pour aider les traders à identifier les structures de marché clés et les zones de liquidité grâce à la stratégie de trading ICT Asian Range. Il indique les niveaux de prix les plus élevés et les plus bas de la séance asiatique (de 19h à minuit, heure de New York) et fournit des informations essentielles sur les mouvements de marché pour les séances suivantes. Cet indicateur améliore la précision des transactions en mettant en évidence

"PACIFIC BREAKOUT" — Catch a Wave of Profit on Breakouts of Sessions! Are You Tired Of Missing Key Breakouts?
Manual calculation of levels, dozens of indicators and missed signals will be a thing of the past! What Does Pacific Breakout Do? This is your personal analytical robot that: The pulse accumulation range of the Pacific session is automatically determined (1:00 GMT+3 Sydney). - We analyze the second candle after the market opens, because the extended spread does not giv
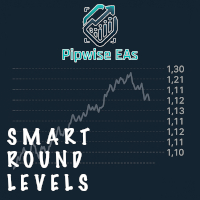
Upgrade your charts instantly. Smart Round Levels draws powerful .00 and .50 round-number zones automatically on any forex pair — including JPY pairs like USDJPY — and features a dynamic live price tracker that follows price in real time. Features: • Automatic round-number detection (.00 & .50) • Auto-adjusts for JPY and non-JPY pairs • Perfect precision with customizable spacing & scale • Fully customizable colors, line widths, font sizes • Real-time yellow price label tha

TRADE HELPER: Multi-Timeframe Trading Assistant TRADE HELPER is a comprehensive multi-timeframe trading assistant designed to enhance your trading decisions by providing real-time analysis across multiple timeframes. This powerful indicator combines RSI analysis, trend strength evaluation, and advanced signal generation to help traders identify high-probability trading opportunities. Key Features Multi-Timeframe RSI Analysis Displays RSI values across seven timeframes (M1, M5, M15, M30, H1, H4,
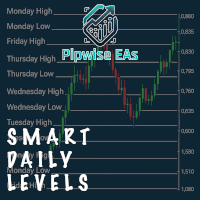
Smart Daily Levels – Extended Highs & Lows from Past Days
Never lose sight of market structure again. Smart Daily Levels automatically draws horizontal lines at the high and low of each day — and extends them forever to the right side of your chart.
Perfect for traders who use: • Support & resistance • Breakout traps • Liquidity zones • Smart Money / price action strategies Core Features • Daily high & low lines from the past X days (default: 10) • Lines start at each day’s open an
Signal Quality Dashboard – Trade Like a Pro Tired of the BS and unreliable signals? It’s time to break free from mediocre systems. The Signal Quality Dashboard is built exclusively for renegade traders who demand real, actionable data. This isn’t your average trading robot—it's a no-nonsense, MQL5-powered solution that combines RSI, MACD, Bollinger Bands, ADX, Volume, and Price Action into one ultra-intelligent dashboard. What It Does:
• Real-Time Signal Scoring: It crunches multiple indicator

Scalper Elite Dashboard – The Ultimate Precision Entry Indicator (MT4) Version: 1.00
Type: Non-Repainting Multi-Logic Signal System
Platform: MetaTrader 4
Dashboard-based, No External API, Lightning Fast Execution What is Scalper Elite Dashboard? Scalper Elite Dashboard is a high-frequency, non-repainting trading indicator designed specifically for scalping, intraday, and short-term swing trading. It combines 6 powerful technical analysis components into a single ultra-visual and inte
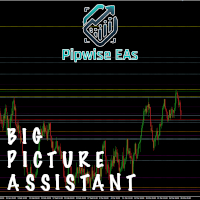
Big Picture Range Assistant – Daily, Weekly & Monthly Range Lines
Master multi-timeframe context in one glance. The Big Picture Range Assistant indicator overlays your chart with dynamic historical high/low levels from the daily , weekly , and monthly timeframes — using progressively darker shades to show how recent or distant each range is.
Perfect for: • Reversal traders • Range traders • Smart Money / SMC strategies • Swing and position traders who rely on big-pictur
Full Functionality of the MT4
"TWR MTF BREAKOUT" INDICATOR
FOR APP SOURCE CODE: t.me/KingRennie
APP SOURCE CODE WORKS FOR MT4 AND MT5
FEE =$1500 The MT4 " TWR MTF BREAKOUT " INDICATOR is a comprehensive trading tool designed to help traders make informed decisions by utilizing Fibonacci levels, time-based analysis, and demarcating major trading sessions. This INDICATOR is ideal for both novice and experienced traders who want to enhance their trading strategies with advanced technical anal

A digital candlestick chart displays custom-colored candles on a black background. The chart features: • Green candles representing bullish momentum • Red candles showing bearish momentum • Orange candles signalling neutral or conflicting signals
We have attached images of our settings on our charts, in addition to this, make sure the chart is displaying the line chart (alt + 3).
Le High Low Tracker est un indicateur essentiel pour tout trader qui apprécie la précision et la clarté dans l'identification des niveaux de prix clés. Conçu pour les traders utilisant des stratégies institutionnelles telles que ICT (Inner Circle Trader) , BTMM (Bank Trading Market Maker) et SMC (Smart Money Concepts) , cet outil simplifie l'analyse multi-périodes en traçant les plus hauts et les plus bas significatifs directement sur votre graphique actuel. Que vous pratiqui
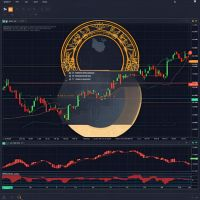
Moving MinMax is a custom trend indicator that helps you easily identify the current market direction , reversals , and high-probability trade setups . This tool uses a unique calculation method that measures price pressure from both buyers and sellers, helping you see who is in control and when the market is likely to change direction. Unlike basic oscillators or moving averages, this indicator computes trend likelihoods using a distribution-based exponential model applied over a moving price w
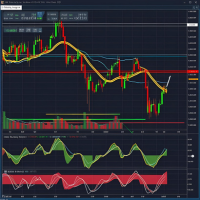
How to Use this indicator-: 1. Trend-Following Strategy Objective : Enter trades in the direction of the trend when the Net Score and Signal Line confirm a strong trend. Identify the Trend : Look at the Net Score in the separate window: If the Net Score is above 0 and rising, the trend is bullish. If the Net Score is below 0 and falling, the trend is bearish. Confirm with the LazyLine on the main chart: Green LazyLine indicates an uptrend. Red LazyLine indicates a downtrend. Entry : Buy (Long)

Overview:
"TrendLine Alerts" is a dynamic, multi-functional trading tool designed to monitor and alert traders in real-time when price action touches or breaks critical technical levels. Built for precision, it seamlessly tracks trendlines, horizontal support/resistance, vertical time-based lines, and equidistant channels , ensuring you never miss a key market movement. Whether you’re scalping, swing trading, or managing long-term positions, this indicator acts as your 24/7 market sentinel. K
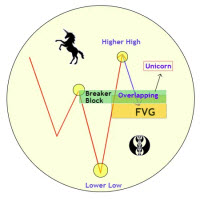
Unicorn Model ICT Indicator — Smart Trading with Precision The Unicorn Model ICT Indicator is a powerful and intelligent tool designed for traders who follow Smart Money Concepts (SMC) and Inner Circle Trader (ICT) methodologies. This indicator simplifies complex price action by visually identifying key market structures and providing high-probability trade setups. Key Features: A Bullish Unicorn Pattern A Lower Low (LL), followed by a Higher High (HH) A Fair Value Gap (FVG), overla
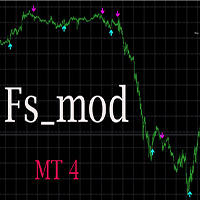
Fs_mod стрелочный индикатор, указатель направления тренда. Индикатор НЕ перерисовывает и не изменяет свои показания, стрелки появляются по закрытию бара и остаются на своих местах. При появлении стрелки дает несколько типов оповещений. Индикатор предназначен для использования на следующих финансовых инструментах: - Forex - индексы - акции. Рекомендуется использовать на таймфреймах не ниже 15 мин

Speed Scalp MT4 – Indicateur de Signal Rapide pour Scalping
Compatible avec tous les graphiques et symboles. – Aucun repaint
– Aucun délai
– Pas de DLL
– Aucune dépendance externe Compatibilité universelle
– Fonctionne sur le Forex, les indices, les métaux, et les cryptomonnaies
– Flèches : Aqua = Achat, Magenta = Vente
– Affichage propre et léger Alertes optionnelles
– Activez ou désactivez les alertes par email Outil de signal uniquement
Cet indicateur n’ouvre pas de positions.
Parfait pour le

Multi Stochastic Display – The Ultimate MTF Trade Scanner for Forex & Crypto Multi Stochastic Display is a powerful multi-timeframe trading tool that gives you a professional edge in analyzing market momentum. Designed for both Forex and Crypto traders, this clean and modern indicator visually presents BUY and SELL signals across 9 timeframes (from M1 to Monthly) for over 25 instruments. Its intuitive panel automatically ranks all instruments based on their strongest stochastic trend – whethe
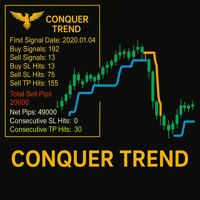
Conquer Trend – Master the Trend Like Never Before! Conquer Trend is your ultimate solution for dominating the markets with precision and simplicity. Built for traders who want to ride the strongest trends across any pair and any time frame , this powerful indicator brings together trend detection, retest confirmation, and performance tracking — all in one streamlined tool.
Multi-Timeframe Trend Analysis
Get a clear view of the trend across multiple timeframes. Whether you're scalping, day tra

PinBar Hunter – Smart Pin Bar Indicator with Built-in Control Panel and Signal Filters PinBar Hunter is a powerful tool for technical traders that automatically detects classic Pin Bar patterns (reversal candles) on the chart.
It’s designed for price action strategies, candlestick analysis, and trading around key support/resistance levels. Indicator Features: Detects classic Pin Bars (reversal candlestick patterns)
Works on any timeframe and instrument
Suitable for trend-following an
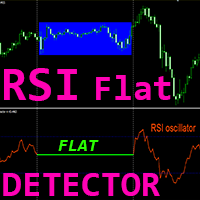
L'indicateur Crypto_Forex « Détecteur RSI FLAT » est un outil auxiliaire efficace pour le trading ! Pas de refonte. Je vous propose d'améliorer vos méthodes de trading avec cet excellent indicateur pour MT4.
- L'indicateur affiche les zones de prix plates sur le graphique. Il dispose d'un paramètre « Sensibilité plate », qui permet de détecter les prix plats. - Le détecteur RSI FLAT peut être utilisé pour confirmer les entrées d'action de prix ou en combinaison avec d'autres indicateurs. - Il
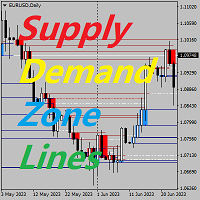
Indicateurs clés des prix de la zone d'offre et de demande arrière-plan Le système recherche automatiquement les zones d'offre et de demande dans la ligne K et trace des lignes de prix clés en temps réel. Les traders peuvent négocier en fonction des lignes de négociation de prix. Caractéristiques principales Le système recherche automatiquement les zones d'offre et de demande dans la ligne K. Le système tracera également des lignes de prix clés en temps réel, et les traders pourront négocier en

Tento jedinečný indikátor vám ukazuje rozsah, v ktorom sa pohybujú maloobchodní klienti. Spravidla, ak sa cena udržiava na priemernej úrovni, neskôr dosiahne vrchol a potom sa vráti na opačnú stranu. Indikátor je vhodný pre všetky grafy s možnosťou nastavenia pákového efektu, teda ak zoberieme do úvahy, že retailoví klienti sa pohybujú na trhu s pákovým efektom 500 až 100 páka. Indikátor je vhodný pre väčšie časové rámce H1,H4... s väčšími pákami 100,50,25 ale aj pre malé grafy M5,M15 s pákami

Nom du Produit A arca Fonctionnalités Principales Identification Automatique des Zones Clés
A arca détecte et met en évidence automatiquement les niveaux de support et de résistance, facilitant l’identification des points d’entrée et de sortie potentiels. Signaux d’Achat et de Vente Clairs
Affiche des marqueurs pour indiquer les opportunités d’achat et de vente, aidant les traders à déterminer le moment optimal pour ouvrir ou fermer une position. Analyse Multi-Unités de Temps
Intègre des donn
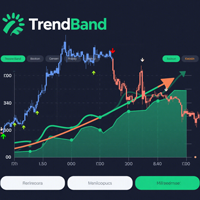
TrendBand Navigator Pro – Non-Repainting Multi-Timeframe Trading System
Powered by proprietary multi-dimensional trend band algorithm delivering clear arrow signals Big Arrows Define Direction Small Arrows Capture Entries Core Advantages
Intelligent Noise Filtering
Volatility-adaptive technology avoids false breakouts, triggers arrows only during strong trends Multi-Timeframe Compatibility
Automatically adapts from 1-minute to monthly charts for all trading strategies Vis

The indicator is based on the calculation of liquidity on the market and thus shows where the market can most likely turn.. It shows the places of liquidity where the price will reach sooner or later... The indicator can be set to several types of liquidity and therefore can display several levels on the graph.. It is a unique tool that can help you very well in your trading The indicator is suitable for currency pairs with the most liquidity (Forex,EURUSD,GBPUSD...) The indicator is suitable fo

Gold Strength Index Pro (GSI Pro) is an indicator designed to analyze gold's strength across multiple currency pairs. It aggregates weighted price data from 7 XAU pairs (e.g., XAUUSD, XAUEUR) over a user-defined lookback period, calculating a composite strength value.
Key features include: Color-Coded Histogram : Displays bullish (green) and bearish (red) - momentum based on a threshold zone (±0.2 default). Smoothed Lines : A gold-colored EMA (SmoothPeriod) reduces noise, while a DodgerBlue s

The Quasimodo Pattern Indicator is no more difficult than the Head and Shoulders. Still, only a few traders know about it, and some even confuse one with the other. However, this is not a reason to avoid this tool in your forex trading strategy. Features: Automatic Detection: The indicator automatically scans for valid QM patterns across any timeframe, reducing the need for manual chart analysis. Visual Highlights: Clear and customizable on-chart drawing of shoulders, heads, and breako

The trend indicator processes each bar of the chart and displays signal arrow on it. In the default display settings: red arrow - sell signal blue arrow - buy signal If the arrows are missing on some bars, this means that the algorithm has not identified a consensus on the signal on this bar. The indicator does not have any technical settings for the algorithm. The process of finding a consensus is fully automated.
For ease of visualization on charts, user settings allow you to set the size of

MTRade is a professional arrow indicator based on the classic Parabolic SAR algorithm. It automatically detects the moments of trend direction change and displays clear signal arrows on the chart: up (buy) and down (sell).
Basis: original Parabolic SAR algorithm with full adaptation for visual display by arrows;
Signals: up arrow — possible up reversal (buy); down arrow — possible down reversal (sell);
No redrawing: signals are recorded only after a confirmed reversal, excluding "jumps" and
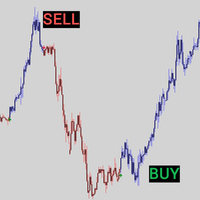
Special offer! https://www.mql5.com/ru/users/bossik2810 Arrow Candle - These are colored candles that show the trend based on volume and trend slope. This indicator will show you the color change on the next bar of the confirmation candle. Blue candles = possible buy (volume is increasing), Red candles = bullish weakness (volume is decreasing) possible sell. Arrow Candle is optimized for trading in any market and can be used in trending and non-trending markets. The Super Multiplier parameter

iMRPHN: Supertrend & Swing Reversal Indicator A trading indicator that integrates Supertrend zone detection with swing-based entry logic. Designed for traders who apply both trend-following and counter-trend approaches. The indicator works across multiple timeframes and offers several helpful visual and alert-based features. Key Features: Automatic identification of swing high and swing low levels Automatic Fibonacci retracement Supertrend reversal zone visualization in real-time Highlights are

Ultimate Trend Rider
Ride the markets with confidence — your all‑in‑one trend‑capturing powerhouse.
Key Features & Benefits Adaptive Multi‑Filter Engine
Combines Supertrend, ADX, ATR volatility, and volume filters to ensure you enter only the strongest, most reliable trends. Multi‑Candle Confirmation
Eliminate “false start” signals: require multiple consecutive closes above/below your trend line before triggering an entry. Customizable Take‑Profit Alerts
Three levels of RSI‑based “TP” mar

FullScalping est un indicateur sans repeinture, sans backpainting , spécialement conçu pour générer des entrées de scalping CONSTANTES sur tous les marchés. Parfait pour les traders agressifs recherchant une action continue !
Rejoignez le canal pour rester informé avec des informations exclusives et des mises à jour : https://www.mql5.com/en/channels/forexnewadvisor
Vous remarquerez qu'il donne des signaux sur presque chaque bougie , soit pour confirmer la tendance, soit pour signaler des retr
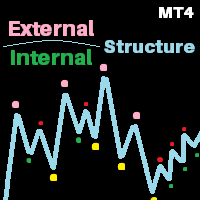
Here is the V3 of perfect market structure. Whats new? Coded based on ICT rules. No more trend confusions...-- Added labels to show current trend No more timeframe juggling and missing out important points, -- Now You can add indicator multiple times to mark multi timeframe market structure on the same chart window( 1D market structure on 4H or may be 4H market structure on 15 min timeframe and more.....) No more waiting in large range as sometimes market makes huge ranges and starts making im
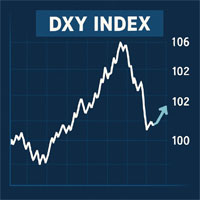
DXY Index indicator to help predict USD effect to your trade. DXY Index will help to see the power of USD.
For example if you trade XAUUSD and the DXY Index weaker, it could be the XAU will be bullish.
The same if DXY Index getting stronger, it could be that XAU will be bearish. I hope this indicator will help many trader to have better position to trade. Use this indicator wisely.

Core Drift Index: Your Reliable Guide in the World of Trading Core Drift Index is an innovative trend indicator designed for precise detection of market directions and reversal points . This powerful tool enables traders to optimize their investments , minimize risk, and maximize profit. Key Features and Benefits Intuitive Trend Detection Core Drift Index clearly shows trend direction, helping traders make timely entry and exit decisions. High Probability of Success With its high accuracy
Warp Range Sensor: The Color of Your Trend Warp Range Sensor is a trend direction indicator that visually displays the current market condition by coloring bars red and blue based on trend direction. What Does Warp Range Sensor Do? Identifies the Current Trend Direction Blue bars indicate an uptrend Red bars signal a downtrend Universal Application
Compatible with all currency pairs and timeframes , from short-term scalping to long-term trading. Powered by Market Context & Historical Data
W
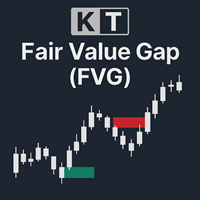
KT Fair Value Gap (FVG) identifie et met en évidence les zones de déséquilibre temporaire du prix sur le marché. Ces écarts agissent souvent comme des zones potentielles de poursuite du mouvement – ou dans certains cas, de retournement (aussi appelés FVG inversés). FVG haussier : Affiché sous forme de zones vertes, ce type d’écart agit comme une zone de support où le prix pourrait reprendre son mouvement haussier. Une fois comblé, il peut également devenir un point de retournement potentiel. FVG

The Great Oracle – Your Guide to Consistent Trend Trading Success
The Great Oracle is a powerful trend-following indicator designed for traders who seek precision in their entries and exits. Whether you’re navigating trending markets or spotting opportunities in ranging conditions, The Great Oracle provides you with accurate signals and a second chance to join strong market trends. It’s the ultimate tool for traders who want to maximize profits while keeping risks manageable.
Key Features:
•
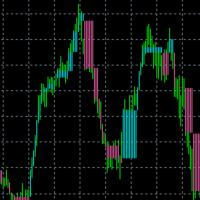
When there is no position, when changing the color, you can consider opening an order. With the fluctuation of the market, when the current color changes again, you need to close the position and leave. Suitable for different cycles, the trading rules are simple and require friends to explore on their own.
I hope friends who use this indicator can make a lot of money, rolling bigger and bigger like a snowball. thank you!
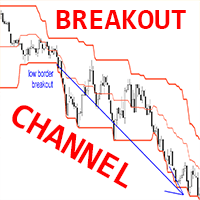
Indicateur Crypto_Forex BREAKOUT CHANNEL pour MT4, sans refonte.
- Cet indicateur peut être utilisé comme système de trading complet basé sur les cassures hautes/basse. - Il ne comporte qu'un seul paramètre : HYSTORY DEPTH, qui reflète le nombre de bougies prises en compte par l'indicateur. - Valeurs recommandées pour le paramètre HYSTORY DEPTH : période D1 : 20 (un mois), H4 : 30 (une semaine), H1 : 24 (un jour). - BREAKOUT CHANNEL se compose de 3 lignes : limite haute : prix maximum des N de
MetaTrader Market - les robots de trading et les indicateurs techniques pour les traders sont disponibles directement dans votre terminal de trading.
Le système de paiement MQL5.community est disponible pour tous les utilisateurs enregistrés du site MQL5.com pour les transactions sur les Services MetaTrader. Vous pouvez déposer et retirer de l'argent en utilisant WebMoney, PayPal ou une carte bancaire.
Vous manquez des opportunités de trading :
- Applications de trading gratuites
- Plus de 8 000 signaux à copier
- Actualités économiques pour explorer les marchés financiers
Inscription
Se connecter
Si vous n'avez pas de compte, veuillez vous inscrire
Autorisez l'utilisation de cookies pour vous connecter au site Web MQL5.com.
Veuillez activer les paramètres nécessaires dans votre navigateur, sinon vous ne pourrez pas vous connecter.