
Automatic Selection of Promising Signals

- Introduction
- Model for rating trading signals
- Implementation of the rating tool
- Selection of potentially promising signals
- Conclusions
Introduction
Automated trading in financial markets is the ultimate goal of the development of new trading robots, because the market is constantly changing. However, automated trading Expert Advisors cannot be prepared for all situations in the market. Therefore, the most effective way is still the symbiosis of a trading robot and the human control over the automated system operation with necessary adjustments. A good example of such interaction can be found in the Trading Signals service. The service features a selection of trading systems and methods with different risk parameters or trading dynamics. A number of tools can help users find the desired signal. However, the task is to determine the set of parameters suiting different trading styles. A convenient solution is to determine a set of trading signal parameters and their values suitable for risky, moderate and conservative trading styles.
Model for Rating Trading Signals
Five evaluation criteria have been selected for a comprehensive assessment of trading signals. Each of them will be graded on a 20-point scale system, where 0 means a risky trading style and 20 means conservative trading. In total, each trading signal will be evaluated on a 100-point system. The following characteristics of trading signals will be used for criteria.
1) Trading account leverage.
As you know, a higher leverage means a higher risk of losing a significant part of your deposit in case of a sudden spike in the trading instrument price. The following values of a 20-point system will be used for leverage evaluation:
- 20 points will be given to the leverage of 1:1.
- 0 points will be given to the leverage of 1:500 and above.
To evaluate a signal based on the leverage value, we'll use the following equation of a straight line:
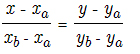
where Xa = 1, Ya = 20, and, accordingly, Xb = 500 and Yb = 0. This is an equation of a straight line passing through two points. In our case, the equation reflects the dependence of the score on a 20-point scale on the current leverage value.
![]()
Please note that this dependence is only valid for the specified evaluation range from 0 to 20. This means that even if the used leverage is above 1:500 (for example, 1:1000), its score will also be 0.
2) Account growth in percent.
To evaluate this parameter according to the 20-point system, we should take into account two factors. First of all, the growth can be negative. In addition, comparing its absolute values would not be correct. Therefore, let's introduce the following rules and assumptions.
- A negative gain will mean that the signal is currently at risk, so the 0 score will be given to it.
- Instead of evaluating the absolute growth, we will measure its dynamics over time by dividing the account growth by the signal lifetime in weeks.
- Risk is a subjective concept. The 10% weekly growth may be not enough for some traders and be a good growth for others. However, we need to set a certain range. So, the growth of 1% will be used as a reference growth of a conservative signal, and 15% will be set as a threshold of risky trading.
Again, we use the above equation of a straight line through two points, where Xa = 1, Ya = 20, and, respectively Xb = 15 and Yb = 0. The following dependence is obtained:
![]()
3) Maximum drawdown in percent.
This value directly characterizes the trading risk. Let's use the following rules to determine the limit values.
- The drawdown up to 20% inclusive will be considered a conservative trading style. Its score will be equal to 20.
- The drawdown value above 40% will be considered as risky, and will be given 0 points.
- The interval of 20-40% of the maximum drawdown will be evaluated from the equation of the straight line based on the two previous points.
In this equation, Xa = 20, Ya = 20, Xb = 40 and Yb = 0. The following dependence is obtained:
![]()
4) ROI (Return on Investment) in percent.
The return on investment above 100% means an effective use of funds; values below 100% mean that investments are not effective. Let's evaluate this indicator of success according to the 20-point scale.
- ROI below 100% will be given 0 points.
- ROI above 200% will be given 20 points.
- The interval of 100-200 will be evaluated from the equation of the straight line based on the two previous points.
In this equation, Xa = 100, Ya = 0, while Xb = 200 and Yb = 20. The following dependence is obtained:
![]()
5) Trading signal lifetime.
The lifetime is a very important characteristic, showing if the signal is principally trading correctly. To evaluate it on a 20-point scale, we first determine the amount of time, which will be considered reliable and verified. A week will be used as a unit of measurement, we already used weeks in growth evaluation. Please note that this is an individual characteristic, anyone can have specific time criteria of reliability. We will use the following threshold values for our system.
- Signals with the lifetime below 4 weeks (the number of full weeks in one month) will be given 0 points.
- The lifetime above 25 weeks (the number of full weeks in six months) will be given 25 points.
- The interval between 4 and 25 weeks will be evaluated according to the equation of a straight line set by the two points mentioned above.
![]()
Implementation of Signal Rating Tool
The library of graphical interfaces EasyandFastGUI was selected for implementing the idea. The structure of the application is shown in figures 1a and 1b (see below). It consists of the following elements:
- A table of available signals for the current account in the terminal.
- A detailed evaluation of the signal selected in the table by categories.
- The number of available trading signals for the current account.
- The visual aggregate score of the trading signal selected in the table.
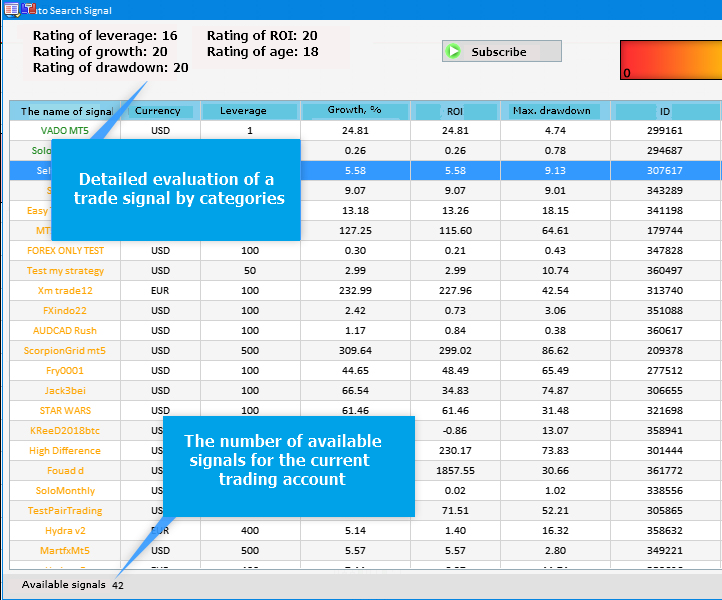
Fig.1a The structure of the application (the left part)
The aggregate rating represented as a gradient scale does not mean that its left part (red) reflects unfavorable signals, and the green part shows potentially promising signals. It only provides the visualization of the trading style on the particular trading signal. Although risky trading implies higher chance of loss, it also implies higher possible profit.
Fig.1b The structure of the application (the right side)
In the program implementation, we will dwell on key methods that reflect the essence of the application. The first method is CreateGUI(), which is an assembly of all other methods and is responsible for the display of any visual information.
- The CreateWindow() method creates a window of the application with a header. It can be closed and minimized.
- CreateTable() creates a table with all signals available for the current account.
- The CreateStatusBar() method creates a status bar, which shows the total number of available trading signals.
- CreatePicture1() and CreatePicture2() create a gradient scale and a pointer for the scale, respectively.
- CreateTextLabel() methods set the display of detailed information about the rating of the selected trading signal.
- The CreateButton() method creates a button for subscribing to the signal selected in the table.
//+------------------------------------------------------------------+
//| Creates the graphical interface of the program                   |
//+------------------------------------------------------------------+
bool CProgram::CreateGUI(void)
  {
//--- Creating a panel
   if(!CreateWindow("Auto Search Signal"))
      return(false);
//--- Creating a table
   if(!CreateTable(7,100))
      return(false);
//--- Status Bar
   if(!CreateStatusBar(1,26))
      return(false);
//--- Images
   if(!CreatePicture1(618,40))
      return(false);
   if(!CreatePicture2(610,80))
      return(false);
//--- Text label
   if(!CreateTextLabel1(20,20,"Leverage score: -"))
      return(false);
   if(!CreateTextLabel2(20,40,"Growth score: -"))
      return(false);
   if(!CreateTextLabel3(20,60,"Drawdown score: -"))
      return(false);
   if(!CreateTextLabel4(200,20,"ROI score: -"))
      return(false);
   if(!CreateTextLabel5(200,40,"Lifetime score: -"))
      return(false);
//--- Icon buttons
   if(!CreateButton(440,40,"Subscribe"))
      return(false);
//--- Finishing the creation of GUI
   CWndEvents::CompletedGUI();
   return(true);
  }
//+-----------------------------------------------------------------
The following method is responsible for interaction: it enables the selection of a trading signal from the list in the table and the display of information about this signal. It also tracks the event of clicking on the created button and of subscribing to the signal selected in the table.
//+------------------------------------------------------------------+
//| Event handler                                                    |
//+------------------------------------------------------------------+
void CProgram::OnEvent(const int id,const long &lparam,const double &dparam,const string &sparam)
  {
//--- Event of pressing on the item of a list or table
   if(id==CHARTEVENT_CUSTOM+ON_CLICK_LIST_ITEM)
     {
      int x=610+3*int(m_table.GetValue(9,m_table.SelectedItem()));
      //---
      CreateTextLabel1(20,20,"Leverage score: "+IntegerToString(GetLeverageRating(int(m_table.GetValue(2,m_table.SelectedItem())))));
      CreateTextLabel2(20,40,"Growth score: "+IntegerToString(GetGainRating(int(m_table.GetValue(3,m_table.SelectedItem())),int(m_table.GetValue(8,m_table.SelectedItem())))));
      CreateTextLabel3(20,60,"Drawdown score: "+IntegerToString(GetDrawDownRating(int(m_table.GetValue(5,m_table.SelectedItem())))));
      CreateTextLabel4(200,20,"ROI score: "+IntegerToString(GetROIRating(int(m_table.GetValue(4,m_table.SelectedItem())))));
      CreateTextLabel5(200,40,"Lifetime score: "+IntegerToString(GetWeeksRating(int(m_table.GetValue(8,m_table.SelectedItem())))));
      CreatePicture2(x,80);
      //---
      m_button.IsLocked(false);
      Update(true);
     }
//---
   if(id==CHARTEVENT_CUSTOM+ON_CLICK_BUTTON)
     {
      //--- If the button is pressed
      if(lparam==m_button.Id())
        {
         SignalSubscribe(long(m_table.GetValue(6,m_table.SelectedItem())));
        }
     }
  }
Next, let's consider methods that implement the evaluation of trading signals. First, we need to obtain the list of trading signal available for the current account, as well as the required information to be added to the table and to be used for compiling the total rating.
The GetTradingSignals() method retrieves information about available trading signals and adds it to data arrays:
//+------------------------------------------------------------------+
//| Receiving information on available trading signals               |
//+------------------------------------------------------------------+
bool CProgram::GetTradingSignals(void)
  {
//--- Requesting the total number of signals in the signal database
   m_signals_total=SignalBaseTotal();
//---
   ArrayResize(m_name,m_signals_total);
   ArrayResize(m_curr,m_signals_total);
   ArrayResize(m_leverage,m_signals_total);
   ArrayResize(m_gain,m_signals_total);
   ArrayResize(m_roi,m_signals_total);
   ArrayResize(m_max_drawdown,m_signals_total);
   ArrayResize(m_pips,m_signals_total);
   ArrayResize(m_subscr,m_signals_total);
   ArrayResize(m_weeks,m_signals_total);
   ArrayResize(m_rating,m_signals_total);
//--- Loop through all signals
   for(int i=0;i<m_signals_total;i++)
     {
      //--- Selecting a signal for further operation
      if(SignalBaseSelect(i))
        {
         //--- Receiving signal properties
         m_name[i]=SignalBaseGetString(SIGNAL_BASE_NAME);                                                // The name of the signal
         m_curr[i]=SignalBaseGetString(SIGNAL_BASE_CURRENCY);                                            // The currency of the signal
         m_leverage[i]=SignalBaseGetInteger(SIGNAL_BASE_LEVERAGE);                                       // Leverage
         m_gain[i]=SignalBaseGetDouble(SIGNAL_BASE_GAIN);                                                // Account growth in %
         m_roi[i]=SignalBaseGetDouble(SIGNAL_BASE_ROI);                                                  // ROI
         m_max_drawdown[i]=SignalBaseGetDouble(SIGNAL_BASE_MAX_DRAWDOWN);                                // Maximum drawdown
         m_id[i]=SignalBaseGetInteger(SIGNAL_BASE_ID);                                                   // Signal ID
         m_subscr[i]=SignalBaseGetInteger(SIGNAL_BASE_SUBSCRIBERS);                                      // The number of subscribers
         m_weeks[i]=int((TimeCurrent()-SignalBaseGetInteger(SIGNAL_BASE_DATE_PUBLISHED))/3600/24/7);     // Signal lifetime
         //--- Receiving the total rating
         m_rating[i]=GetLeverageRating(m_leverage[i])+GetGainRating(m_gain[i],m_weeks[i])+GetDrawDownRating(m_max_drawdown[i])+GetROIRating(m_roi[i])+GetWeeksRating(m_weeks[i]);
        }
      else
        {
         PrintFormat("Signal selection error. Error code=%d",GetLastError());
         return(false);
        }
     }
   return (true);
  }
//+------------------------------------------------------------------+
As you can see in the listing above, m_rating[] is the array, to which the resulting rating of each trading signal is added. Therefore, let's consider methods used in this calculation. These methods represent a program implementation of the model from the first part of the article.
//+------------------------------------------------------------------+
//| Evaluation of trading leverage                                   |
//+------------------------------------------------------------------+
int CProgram::GetLeverageRating(long leverage)
  {
   int lev_rating=int(-20.0/499.0*double(leverage)+10000.0/499.0);
   lev_rating=(lev_rating>20)?20:lev_rating;
   return lev_rating;
  }
//+------------------------------------------------------------------+
//| Evaluation of growth                                             |
//+------------------------------------------------------------------+
int CProgram::GetGainRating(double gain,int weeks)
  {
   weeks=(weeks==0)?1:weeks;
   int gain_rating=int(-10*(gain/double(weeks)/7.0)+150.0/7.0);
   gain_rating=(gain_rating>20)?20:gain_rating;
   gain_rating=(gain_rating<0)?0:gain_rating;
   gain_rating=(gain<0)?0:gain_rating;
   return gain_rating;
  }
//+------------------------------------------------------------------+
//| Evaluation of maximum drawdown                                   |
//+------------------------------------------------------------------+
int CProgram::GetDrawDownRating(double max_drawdown)
  {
   int drawdn_rating=int(-max_drawdown+40);
   drawdn_rating=(drawdn_rating>20)?20:drawdn_rating;
   drawdn_rating=(drawdn_rating<0)?0:drawdn_rating;
   return drawdn_rating;
  }
//+------------------------------------------------------------------+
//| Evaluation of ROI                                                |
//+------------------------------------------------------------------+
int CProgram::GetROIRating(double roi)
  {
   int roi_rating=int(0.2*roi-20);
   roi_rating=(roi_rating>20)?20:roi_rating;
   roi_rating=(roi_rating<0)?0:roi_rating;
   return roi_rating;
  }
//+------------------------------------------------------------------+
//| Evaluation of trading signal lifetime                            |
//+------------------------------------------------------------------+
int CProgram::GetWeeksRating(int weeks)
  {
   int age_rating=int(20.0*double(weeks)/21.0-80.0/21.0);
   age_rating=(age_rating>20)?20:age_rating;
   age_rating=(age_rating<0)?0:age_rating;
   return age_rating;
  }
Then, all the obtained data are added to the table using the InitializingTable() method and are visually displayed using the CreateTable() method.
//+------------------------------------------------------------------+
//| Initializing the table                                           |
//+------------------------------------------------------------------+
void CProgram::InitializingTable(void)
  {
//---
   string columns[10]=
     {
      "Signal name",
      "Account currency",
      "Account leverage",
      "Account growth, %",
      "ROI",
      "Max drawdown",
      "Signal ID",
      "Number of subscribers",
      "Lifetime, weeks",
      "Rating"
     };
//---
   for(int c=0; c<COLUMNS1_TOTAL; c++)
     {
      //--- Set the header titles
      m_table.SetHeaderText(c,columns[c]);
      //---
      for(int r=0; r<m_signals_total; r++)
        {
         if(c==0)
            m_table.SetValue(c,r,m_name[r]);
         else if(c==1)
            m_table.SetValue(c,r,m_curr[r]);
         else if(c==2)
            m_table.SetValue(c,r,IntegerToString(m_leverage[r]));
         else if(c==3)
            m_table.SetValue(c,r,DoubleToString(m_gain[r],2));
         else if(c==4)
            m_table.SetValue(c,r,DoubleToString(m_roi[r],2));
         else if(c==5)
            m_table.SetValue(c,r,DoubleToString(m_max_drawdown[r],2));
         else if(c==6)
            m_table.SetValue(c,r,IntegerToString(m_id[r]));
         else if(c==7)
            m_table.SetValue(c,r,IntegerToString(m_subscr[r]));
         else if(c==8)
            m_table.SetValue(c,r,IntegerToString(m_weeks[r]));
         else if(c==9)
            m_table.SetValue(c,r,IntegerToString(m_rating[r]));
        }
     }
  }
//+------------------------------------------------------------------+
//| Creating a rendered table                                        |
//+------------------------------------------------------------------+
#resource "\\Images\\EasyAndFastGUI\\Icons\\bmp16\\arrow_up.bmp"
#resource "\\Images\\EasyAndFastGUI\\Icons\\bmp16\\arrow_down.bmp"
#resource "\\Images\\EasyAndFastGUI\\Icons\\bmp16\\circle_gray.bmp"
#resource "\\Images\\EasyAndFastGUI\\Icons\\bmp16\\calendar.bmp"
//---
bool CProgram::CreateTable(const int x_gap,const int y_gap)
  {
#define COLUMNS1_TOTAL 10
//--- Store the pointer to the main control
   m_table.MainPointer(m_window);
//--- Array of column widths
   int width[COLUMNS1_TOTAL];
   ::ArrayInitialize(width,110);
   width[1]=80;
   width[2]=100;
   width[4]=90;
   width[8]=85;
   width[9]=90;
//--- Array of text offset along the X axis in the columns
   int text_x_offset[COLUMNS1_TOTAL];
   ::ArrayInitialize(text_x_offset,7);
//--- Array of text alignment in columns
   ENUM_ALIGN_MODE align[COLUMNS1_TOTAL];
   ::ArrayInitialize(align,ALIGN_CENTER);
//---
   GetTradingSignals();
//--- Properties
   m_table.XSize(1000);
   m_table.YSize(470);
   m_table.CellYSize(20);
   m_table.TableSize(COLUMNS1_TOTAL,m_signals_total);
   m_table.TextAlign(align);
   m_table.ColumnsWidth(width);
   m_table.TextXOffset(text_x_offset);
   m_table.LabelXGap(5);
   m_table.LabelYGap(4);
   m_table.IconXGap(7);
   m_table.IconYGap(4);
   m_table.MinColumnWidth(0);
   m_table.ShowHeaders(true);
   m_table.IsSortMode(true);
   m_table.LightsHover(true);
   m_table.SelectableRow(true);
   m_table.IsWithoutDeselect(true);
   m_table.ColumnResizeMode(true);
   m_table.IsZebraFormatRows(clrWhiteSmoke);
   m_table.AutoXResizeMode(true);
   m_table.AutoXResizeRightOffset(7);
   m_table.AutoYResizeBottomOffset(28);
   m_table.HeadersColor(clrSkyBlue);
   m_table.DataType(2,TYPE_INT);
   m_table.DataType(3,TYPE_FLOAT);
   m_table.DataType(4,TYPE_FLOAT);
   m_table.DataType(5,TYPE_FLOAT);
   m_table.DataType(6,TYPE_INT);
   m_table.DataType(7,TYPE_INT);
   m_table.DataType(8,TYPE_INT);
   m_table.DataType(9,TYPE_INT);

//--- Populate the table with data
   InitializingTable();
//--- Creating a control
   if(!m_table.CreateTable(x_gap,y_gap))
      return(false);
//--- Add the object to the common array of object groups
   CWndContainer::AddToElementsArray(0,m_table);
   m_table.SortData(9);
   m_table.SortData(9);
   return(true);
  }
For a more convenient use of data from the table of trading signals, we should assign data types for the displayed cells. It will enable a proper sorting of data in the table columns. For a better visual display, the table will be initially sorted by the last column, i.e. by the complex signal rating, in descending order. Sorting is performed twice: first sorting is descending, the second and next times sorting will be performed in the order opposite to the previous one.
The last element to mention is the visual display of the final rating in the form of a gradient scale and a pointer to it. This is done by two methods, their listings are provided below. Changes in the position of the pointer on the scale were already noted in the OnEvent() method above.
//+------------------------------------------------------------------+
//| Creates a gradient scale                                         |
//+------------------------------------------------------------------+
#resource "\\Images\\EasyAndFastGUI\\Icons\\bmp64\\000.bmp"
#resource "\\Images\\EasyAndFastGUI\\Controls\\ArrowUp_blue.bmp"
//---
bool CProgram::CreatePicture1(const int x_gap,const int y_gap)
  {
//--- Store the pointer to the main control
   m_picture1.MainPointer(m_window);
//--- Properties
   m_picture1.XSize(300);
   m_picture1.YSize(40);
   m_picture1.IconFile("Images\\EasyAndFastGUI\\Icons\\bmp64\\000.bmp");
//--- Creation of a button
   if(!m_picture1.CreatePicture(x_gap,y_gap))
      return(false);
//--- Adding a pointer to element to the base
   CWndContainer::AddToElementsArray(0,m_picture1);
   return(true);
  }
//+------------------------------------------------------------------+
//| Creates a pointer for the scale                                  |
//+------------------------------------------------------------------+
bool CProgram::CreatePicture2(const int x_gap,const int y_gap)
  {
//--- Store the pointer to the main control
   m_picture2.MainPointer(m_window);
//--- Properties
   m_picture2.XSize(16);
   m_picture2.YSize(16);
   m_picture2.IconFile("Images\\EasyAndFastGUI\\Controls\\ArrowUp_blue.bmp");
//--- Creation of a button
   if(!m_picture2.CreatePicture(x_gap,y_gap))
      return(false);
//--- Adding a pointer to element to the base
   CWndContainer::AddToElementsArray(0,m_picture2);
   return(true);
  }
Selection of Potentially Promising Signals
When selecting a signal and determining its prospects, we expect a good signal to bring certain results in the future. Practice shows that signals showing high growth rates in the shortest time do not live long. It is because such signals often use high-risk trading styles for earning higher profits. Nevertheless, we shouldn't delete trading signals with a high-risk trading style from the list of promising ones, because traders may have different goals. Some traders plan to stay in the market for a long time and make money slowly. Other traders target quick profits and are ready to take certain risks.
Therefore, we visually divide the above rating system into three categories (fig. 2).
- First category. Red zone. Signals from this zone may have high profitability, but involve high risk.
- Second category. Yellow zone. These signals show good profitability with a moderate risk.
- Third category. Green zone. These signals are considered to be potentially promising, because they show higher reliability, although profitability may not be high.
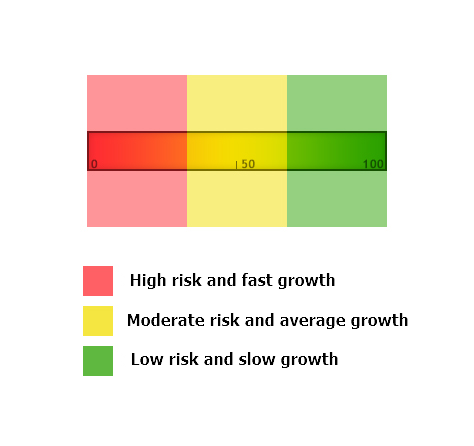
Fig 2. Categories of the grading scale for the rating of trading signals
To program this categorization, we add to the InitializingTable() method the following lines:
//+------------------------------------------------------------------+
//| Initializing the table                                           |
//+------------------------------------------------------------------+
void CProgram::InitializingTable(void)
  {
//---
   string columns[10]=
     {
      "Signal name",
      "Account currency",
      "Account leverage",
      "Account growth, %",
      "ROI",
      "Max drawdown",
      "Signal ID",
      "Number of subscribers",
      "Lifetime, weeks",
      "Rating"
     };
//---
   for(int c=0; c<COLUMNS1_TOTAL; c++)
     {
      //--- Set the header titles
      m_table.SetHeaderText(c,columns[c]);

      //---
      for(int r=0; r<m_signals_total; r++)
        {
         if(c==0)
           {
            m_table.SetValue(c,r,m_name[r]);
            if(m_rating[r]<=30)
               m_table.TextColor(c,r,clrCrimson);
            else if(m_rating[r]>30 && m_rating[r]<=66)
               m_table.TextColor(c,r,clrOrange);
            else if(m_rating[r]>66)
               m_table.TextColor(c,r,clrForestGreen);
           }
         else if(c==1)
            m_table.SetValue(c,r,m_curr[r]);
         else if(c==2)
            m_table.SetValue(c,r,IntegerToString(m_leverage[r]));
         else if(c==3)
            m_table.SetValue(c,r,DoubleToString(m_gain[r],2));
         else if(c==4)
            m_table.SetValue(c,r,DoubleToString(m_roi[r],2));
         else if(c==5)
            m_table.SetValue(c,r,DoubleToString(m_max_drawdown[r],2));
         else if(c==6)
            m_table.SetValue(c,r,IntegerToString(m_id[r]));
         else if(c==7)
            m_table.SetValue(c,r,IntegerToString(m_subscr[r]));
         else if(c==8)
            m_table.SetValue(c,r,IntegerToString(m_weeks[r]));
         else if(c==9)
            m_table.SetValue(c,r,IntegerToString(m_rating[r]));
        }
     }
  }
Based on the received rating, we change the color of the trading signal name (the first column) using the TextColor() method. So, it is possible to see the category the signal belongs to, without analyzing it or checking the last column of the table containing the rating value.
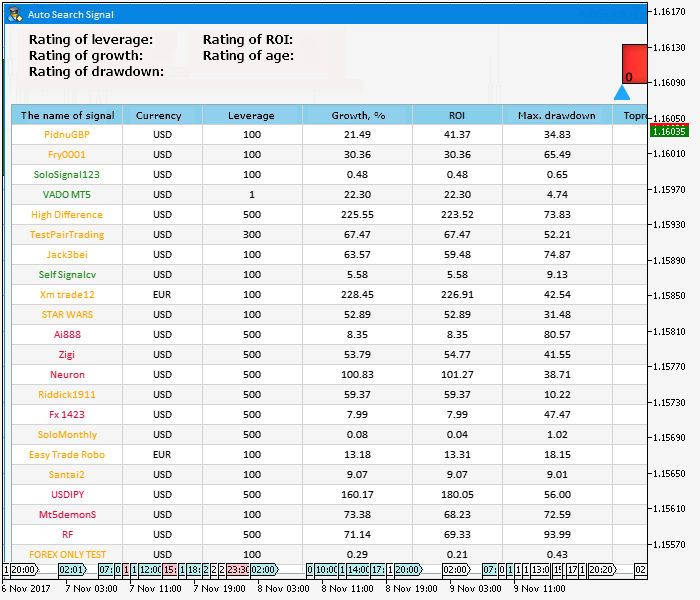
Fig.3 Color indication of trading signals
Signals can be grouped into categories by sorting the table by the last column. This sorting is enabled by default. The last obvious action is to implement the opportunity to subscribe to a signal. This can be done through the CreateButton() method:
//+------------------------------------------------------------------+
//| Creates a button with an image                                   |
//+------------------------------------------------------------------+
#resource "\\Images\\EasyAndFastGUI\\Icons\\bmp16\\start.bmp"
//---
bool CProgram::CreateButton(const int x_gap,const int y_gap,const string text)
  {
//--- Store the pointer to the main control
   m_button.MainPointer(m_window);
//--- Properties
   m_button.XSize(120);
   m_button.YSize(22);
   m_button.IconXGap(3);
   m_button.IconYGap(3);
   m_button.FontSize(10);
   m_button.IsCenterText(true);
   m_button.IconFile("Images\\EasyAndFastGUI\\Icons\\bmp16\\start.bmp");
   m_button.IsLocked(true);
//--- Creating a control
   if(!m_button.CreateButton(text,x_gap,y_gap))
      return(false);
//--- Adding a pointer to element to the base
   CWndContainer::AddToElementsArray(0,m_button);
   return(true);
  }
//+------------------------------------------------------------------+
In order to avoid possible errors in the functionality developed above, let's see what preliminary settings of the terminal are needed.
1. You must be logged in using your mql5 account in MetaTrader 5 in order to be able to work with trading signals in the terminal:
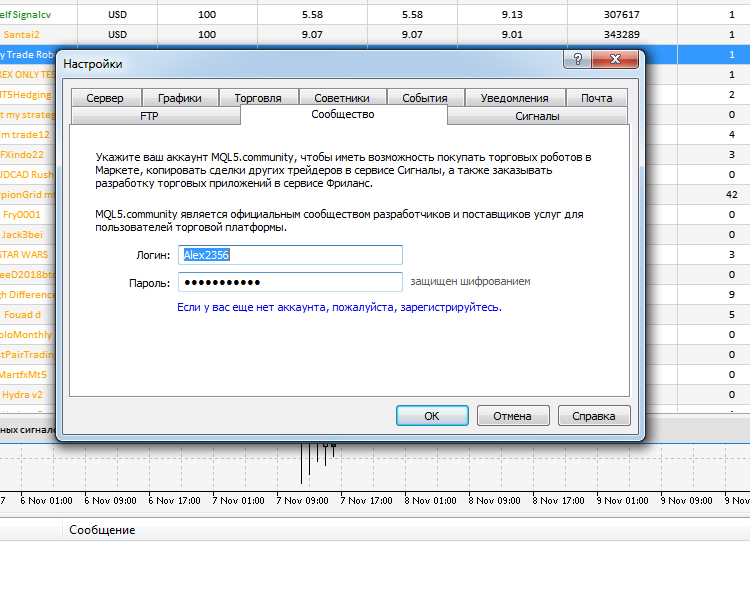
Fig.4 Authentication in the terminal
2. When you launch the application, enable the option Allow changing signal settings. Otherwise subscription to a trading signal using this application will return the error 4014 ("Function is not allowed for call").
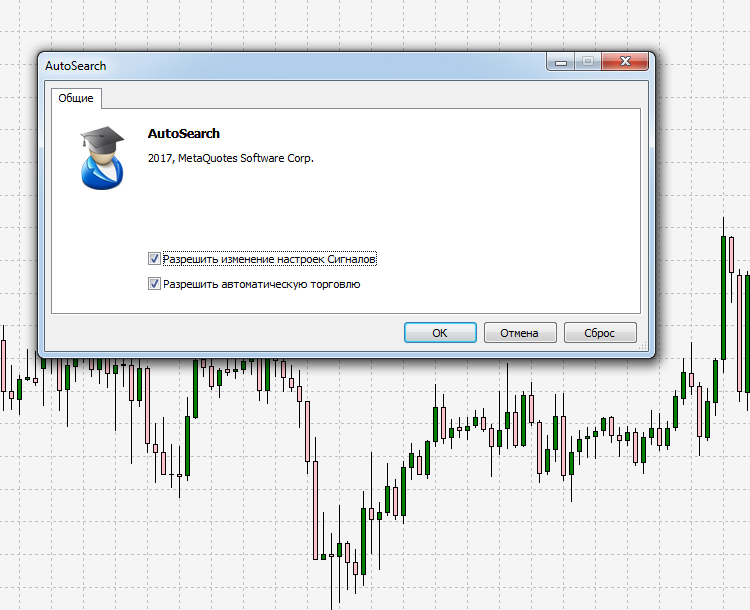
Fig.5 Configuration during application start
3. And the last thing that can affect the correct operation of the application is the signals.dat file. If data in the table is displayed incorrectly or is not displayed at all, you should find this file at C:\Users\Computer name\AppData\Roaming\MetaQuotes\Terminal\..\bases\signals and delete it. Then restart the terminal and open the Signals tab as shown in Fig.6. A new file will be generated automatically, after that you can launch and use the application.
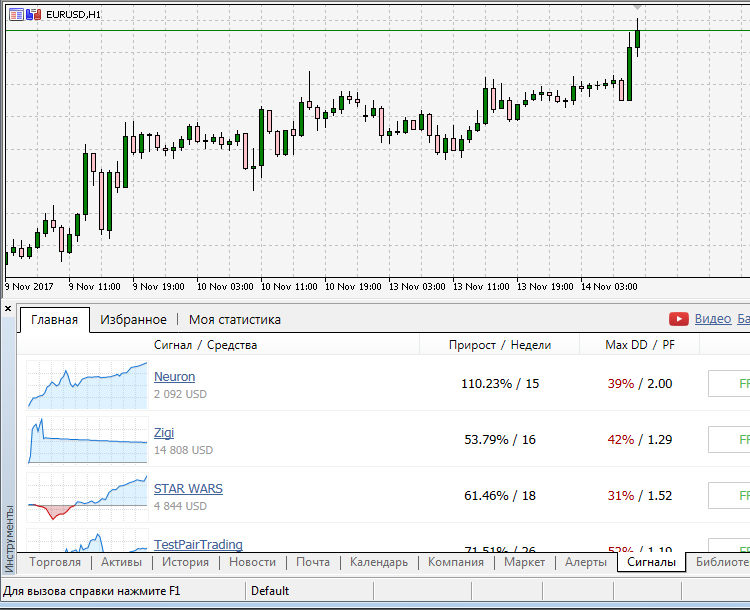
Fig.6 Signals tab in the MetaTrader 5 terminal
Instead of displaying all signals like in the Signals service on the website, the Signals section in the terminal only displays the signals that are suitable for working with the current selected trading account.
Conclusions
In this article, we have developed a simple system for rating signals based on points given for different signal characteristics. The system provides the general 100-point rating of the trading style. Based on this rating, all available signals were divided into three categories, which differ in terms of prospects, trading risks, lifetime and percentage growth of the trading account.
The attached archive contains all the listed files, which are located in the appropriate folders. For their proper operation, you only need to save the MQL5 folder into the terminal root directory. The app uses the graphic interface library EasyAndFastGUI from the related article. The library has been slightly modified and is also attached to this article.
Programs used in the article:
| # | Name | Type | Description |
|---|---|---|---|
| 1 | AutoSearch.mq5 | EA | Application for automatic selection of promising signals |
| 2 | Program.mqh | Code Base | Class for application creation |
| 3 | MainWindow.mqh | Code Base | A set of methods used for creating the application |
Translated from Russian by MetaQuotes Ltd.
Original article: https://www.mql5.com/ru/articles/3398
Warning: All rights to these materials are reserved by MetaQuotes Ltd. Copying or reprinting of these materials in whole or in part is prohibited.
This article was written by a user of the site and reflects their personal views. MetaQuotes Ltd is not responsible for the accuracy of the information presented, nor for any consequences resulting from the use of the solutions, strategies or recommendations described.

 How to reduce trader's risks
 Risk Evaluation in the Sequence of Deals with One Asset. Continued
 The Channel Breakout pattern
 Night trading during the Asian session: How to stay profitable
- Free trading apps
- Over 8,000 signals for copying
- Economic news for exploring financial markets
You agree to website policy and terms of use
Hello, I'm having problems implementing this program:
In MenuItem.mqh the line before the return seems incorrect.
Also in Element.mqh I get "Class CWindow is undefined." Sorry, not sure I can fix this on my own.
It turns out that a custom GUI is offered, but not the selection criteria.
The developers have long been asked to give access to the Signal trading history through Signal-functions. The terminal itself has such access when it displays the history in the form of objects on charts. But MQL does not have it.
It is almost impossible to write something sensible without it. Only GUI, which is what the article shows.
I completely agree - the article just demonstrates that it is impossible to get anything worthwhile from SignalBaseGetxxxxx.
But it's good that it appeared at all - there is an opportunity to draw the developers' team's attention to the real needs of users in terms of SignalBaseGetxxxxx feature set, which apparently hasn't been updated for quite a long time.
For my part, I will try to be brief and objective about what functionality should be added to the SignalBaseGetxxxxx set:
1) we need the SignalBaseGetHistory function, which will allow us to automatically download from the server that file with history in csv format, which is available for downloading through the web-interface,
2) the SignalBaseGetDouble function needs a parameter to get the current drawdown;
3) the SignalBaseGetDouble function needs a parameter to get the % of algo trading;
4) the SignalBaseGetDouble function needs a parameter to get the Total Profit in the account currency;
5) the SignalBaseGetDouble function needs a parameter to get the Total Profit in pips;
6) the SignalBaseGetDouble function needs a parameter to get the Average Position Hold Time;
7) the SignalBaseGetDouble function needs a parameter to get the % of profitable trades.
Hello, I get error when try this EA. Is there any newest version?
https://www.mql5.com/en/articles/3398
Does this expert only evaluate the MT5 signals?
How about MT4? Can we have the MT4 version?