SPTforMT4
- Indicadores
- Versión: 1.0
- Activaciones: 5

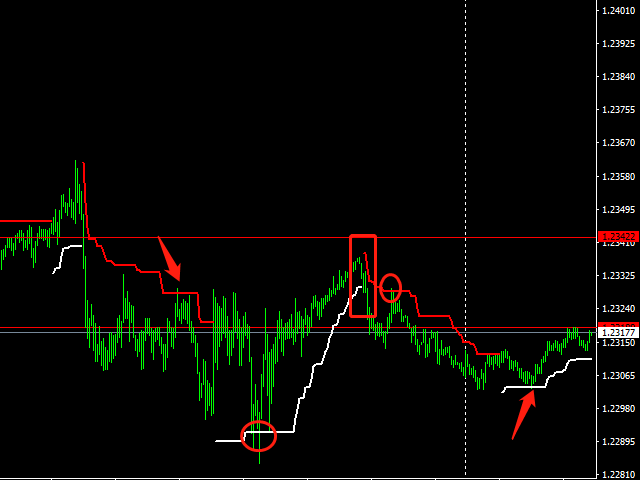
SPT es un indicador de tendencia
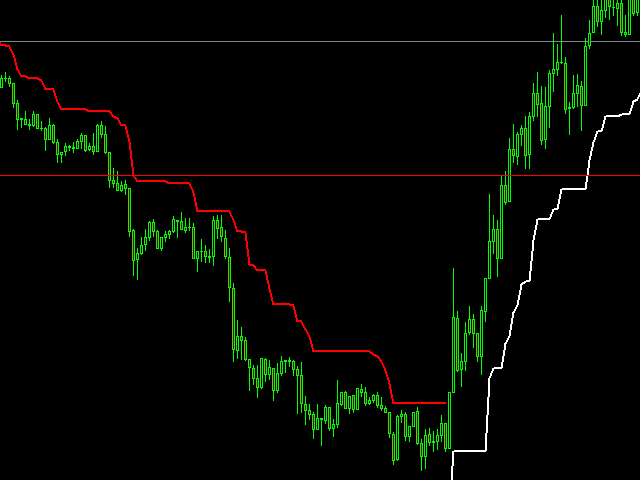
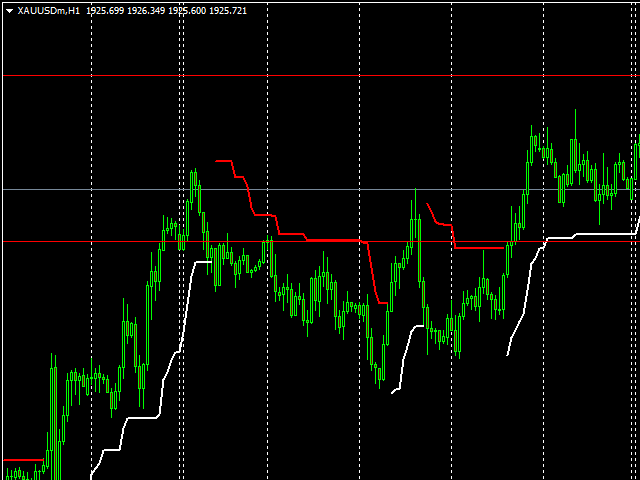
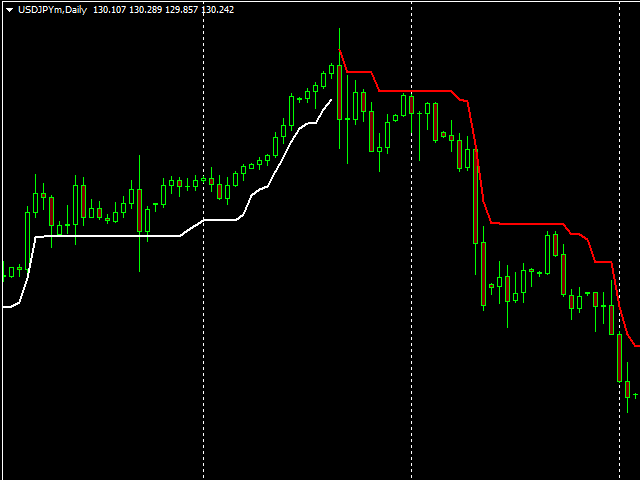
Está escrito sobre la base del ATR, con líneas de tendencia claras que indican la dirección en curso,
La comprensión de los diferentes comerciantes de este indicador puede formar dos propósitos diferentes
Los operadores basados en la tendencia realizarán operaciones de tendencia cuando cambie la línea de tendencia,
Los operadores respetuosos con el choque realizarán operaciones de rango según el nivel de soporte o resistencia final marcado por este indicador
Los parámetros del índice son los siguientes
Multiplicador: múltiplo del ATR
Periodo: Ciclo del ATR. Cuanto menor sea el ciclo, más sensible es el índice, mayor es la ineficacia, pero menor es el stop loss
Para instalar el indicador MT4 Supertrend Line, por favor siga las siguientes instrucciones:
1.Descargue el archivo del indicador.
2.Abra la carpeta de datos de MetaTrader 4 (a través de Archivo->Abrir carpeta de datos).
3.Abra la carpeta MQL4.
4.Copie todas las carpetas del archivo directamente a la carpeta MQL4.
5.Reinicie MetaTrader 4 o actualice la lista de indicadores haciendo clic con el botón derecho del ratón en la subventana Navegador de la plataforma y seleccionando Actualizar.