SPTforMT4
- Indikatoren
- Version: 1.0
- Aktivierungen: 5

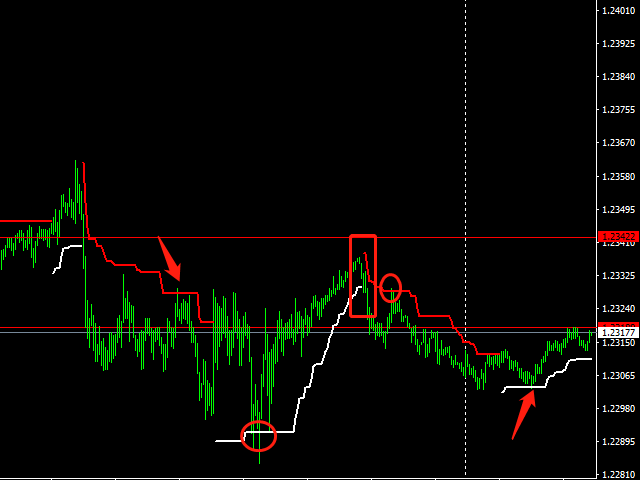
SPT ist ein Trendindikator
Er wird auf der Grundlage von ATR geschrieben, mit klaren Trendlinien, die die laufende Richtung anzeigen,
Unterschiedliche Trader verstehen diesen Indikator für zwei verschiedene Zwecke
Trendorientierte Trader führen einen Trendhandel durch, wenn sich die Trendlinie ändert,
Händler, die auf einen respektvollen Schock setzen, handeln in einer Handelsspanne, die sich an der endgültigen Unterstützungs- oder Widerstandslinie orientiert, die dieser Indikator markiert.
Die Indexparameter lauten wie folgt:
Multiplikator: Vielfaches der ATR
Zeitraum: ATR-Zyklus. Je kleiner der Zyklus, desto empfindlicher ist der Index, desto höher ist die Ineffektivität, aber desto kleiner ist der Stop Loss
Um den MT4 Supertrend Line Indikator zu installieren, folgen Sie bitte den unten stehenden Anweisungen:
1. laden Sie die Archivdatei des Indikators herunter.
2. öffnen Sie den MetaTrader 4 Datenordner (über Datei->Datenordner öffnen).
3. öffnen Sie den Ordner MQL4.
Kopieren Sie alle Ordner des Archivs direkt in den MQL4-Ordner.
Starten Sie MetaTrader 4 neu oder aktualisieren Sie die Indikatorenliste, indem Sie mit der rechten Maustaste auf das Navigator-Unterfenster der Plattform klicken und Aktualisieren wählen.