Bears Bulls Complex MT5
- Indicadores
- Versión: 5.5
- Actualizado: 2 enero 2023
- Activaciones: 5

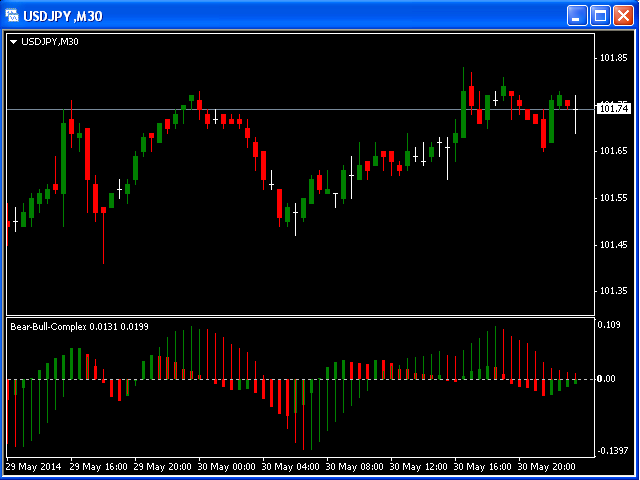
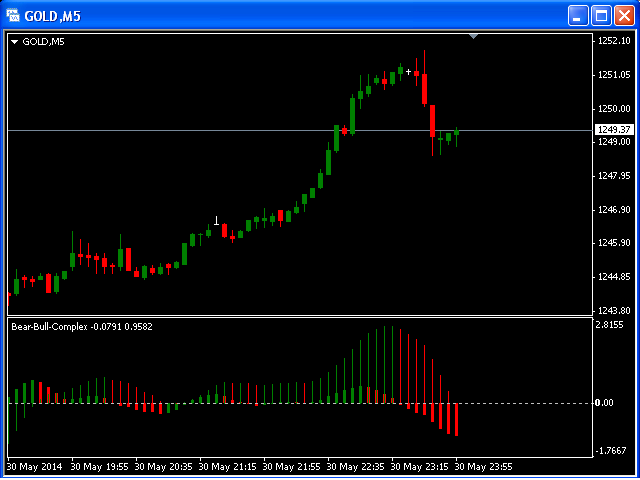
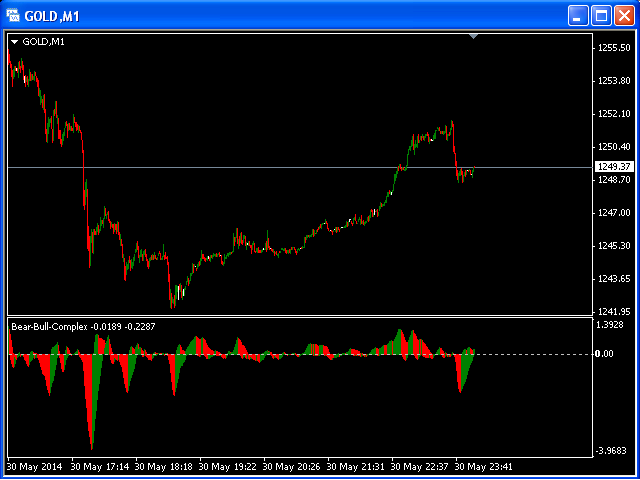
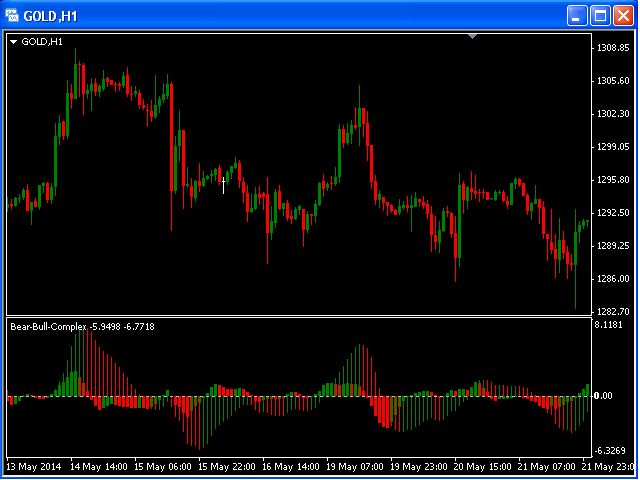
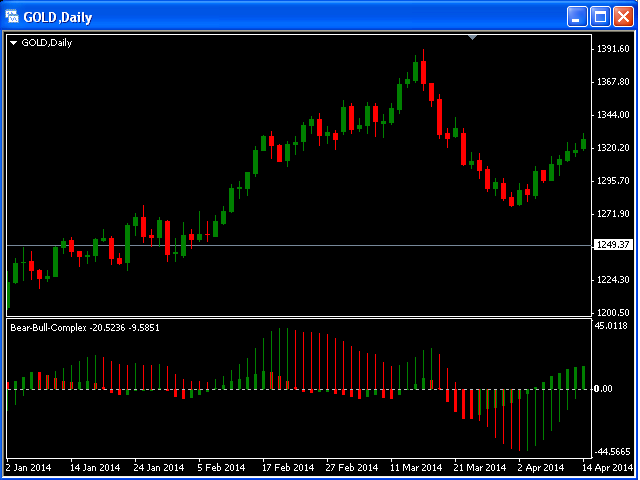
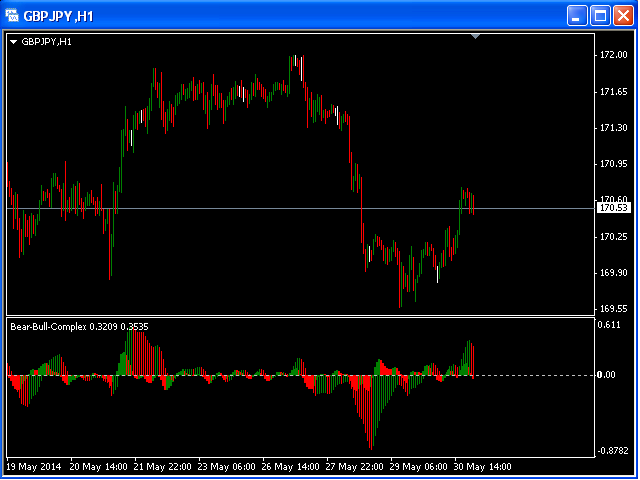
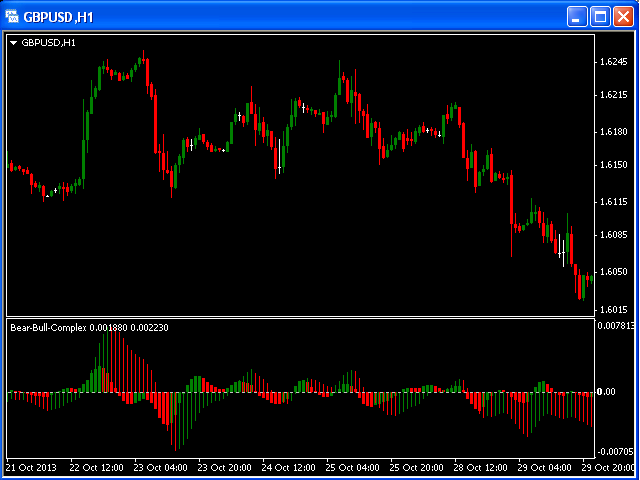
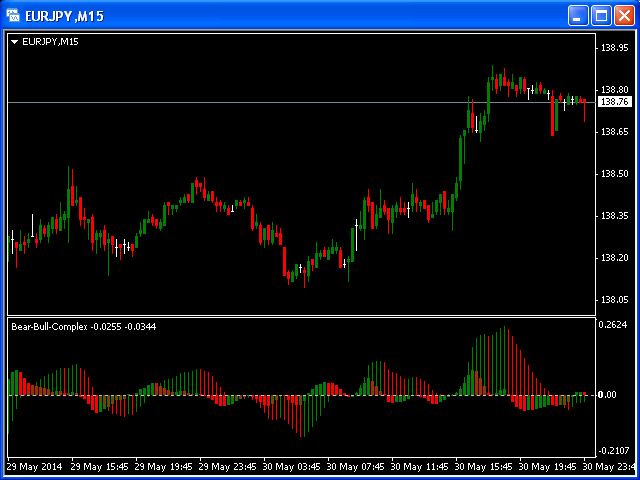
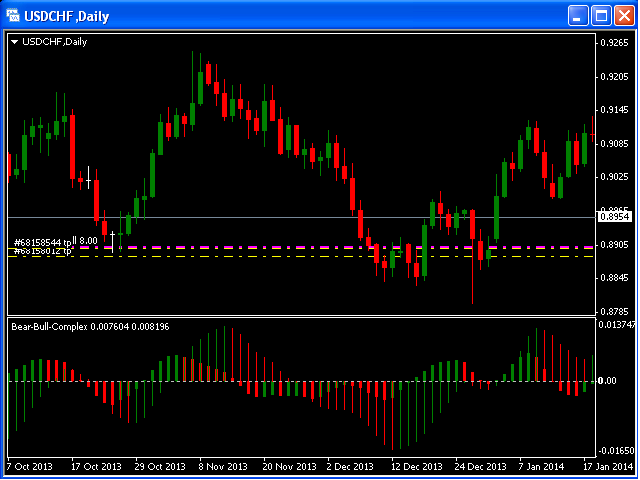
Los indicadores Bull y Bear Power identifican si los compradores o los vendedores en el mercado tienen el poder, y como tal conducen a la ruptura del precio en las direcciones respectivas.
Bulls Power vs .Bears Power es una herramienta única que muestra en cada vela el equilibrio entre lososos ( vendedores) y lostoros ( compradores ) .
Este indicador en particular será especialmente muy eficaz cuando el histograma estrecho y el histograma ancho residan en el mismo lado (por encima o por debajo de la línea Cero).

Hello Leonid Basis, good afternoon! I made the purchase of "Bear Bull Complex MT5", but when i activate it. the indicator does not meet the informed, the indicator installed was the "Trend Histogram". I've written a message in private for you, however, no answers. Can you help me solve the problem? Thank you!