Nine Lives of Moving Averages MT4
- Indicadores
- Versión: 4.7
- Actualizado: 20 abril 2020
- Activaciones: 5

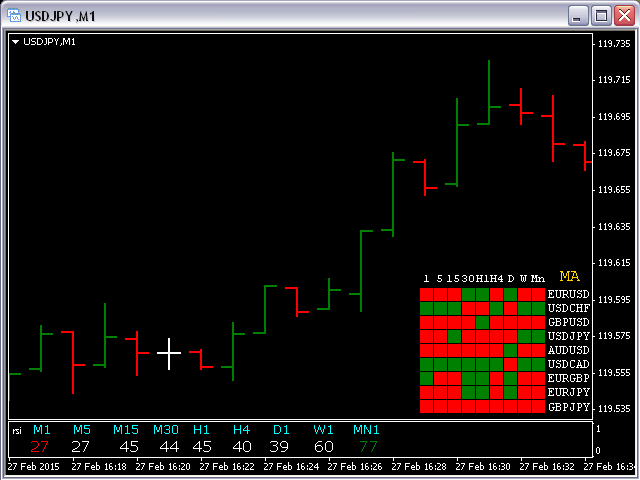
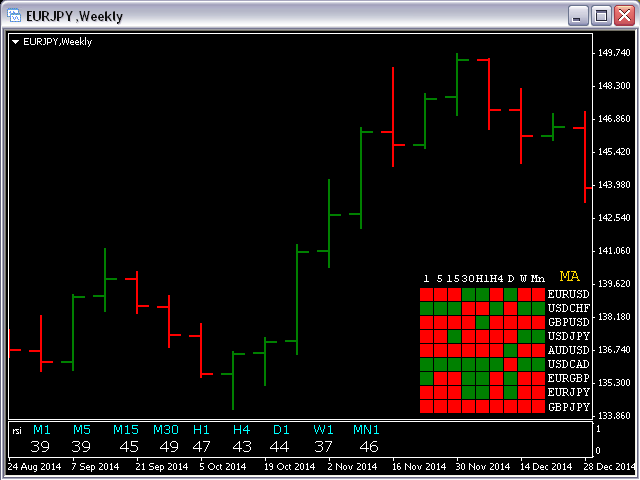
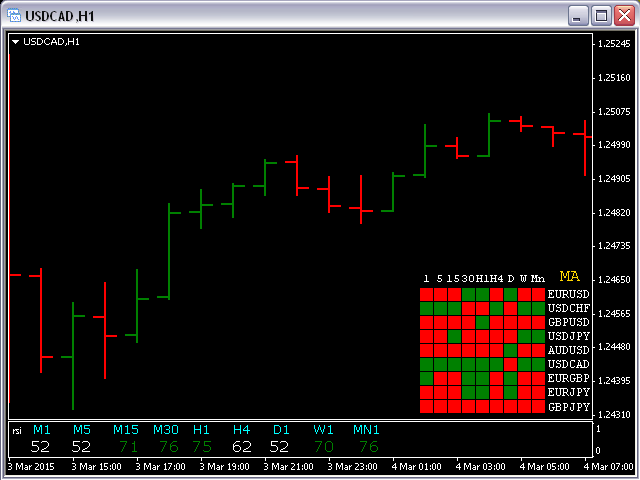
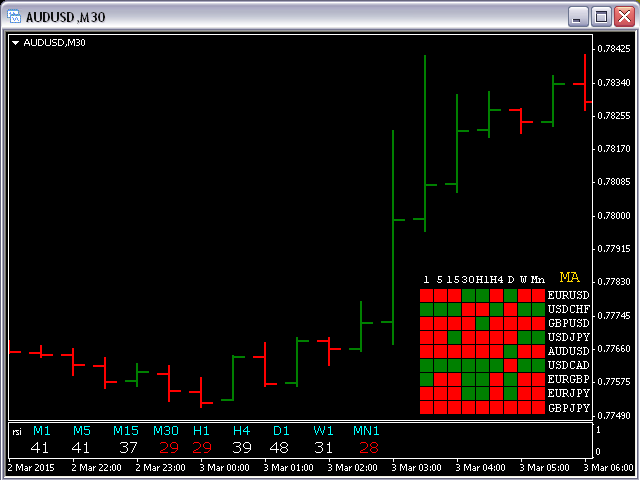
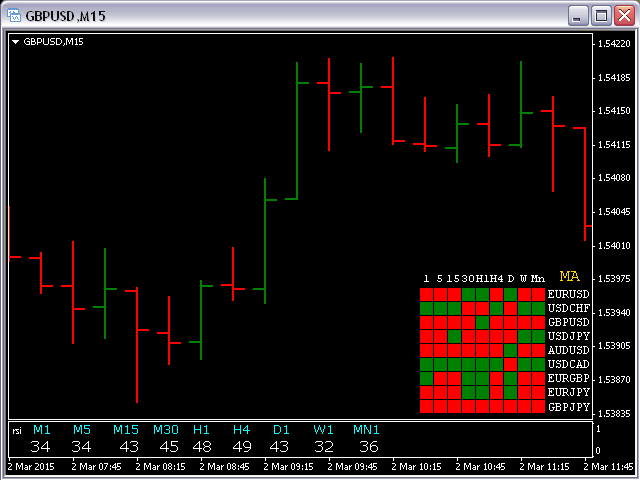
Este indicador muestra una tendencia alcista (cuadrado verde) si una MA rápida está por encima de una MA lenta y una tendencia bajista (cuadrado rojo) si una MA rápida está por debajo de una MA lenta de todos los marcos temporales para cada par de divisas.
Parámetros de entrada:
De Symb1 a Symb9. - Puede cambiar cualquiera de estos Símbolos por cualquier par de divisas legal existente en su plataforma.
Period_Fast = 5;
Método_Fast = MODE_EMA;
Precio_rápido = PRECIO_CIERRE;
Period_Slow = 21;
Método_Slow = MODE_SMA;
Precio_Slow = PRECIO_TIPICO;
Atención:
Antes de utilizar este indicador tiene que abrir todos los gráficos (todos los TF) para los 9 pares de divisas.