Demarker pull back system MT4
- Indicadores
- Versión: 1.10
- Actualizado: 22 septiembre 2022
- Activaciones: 5

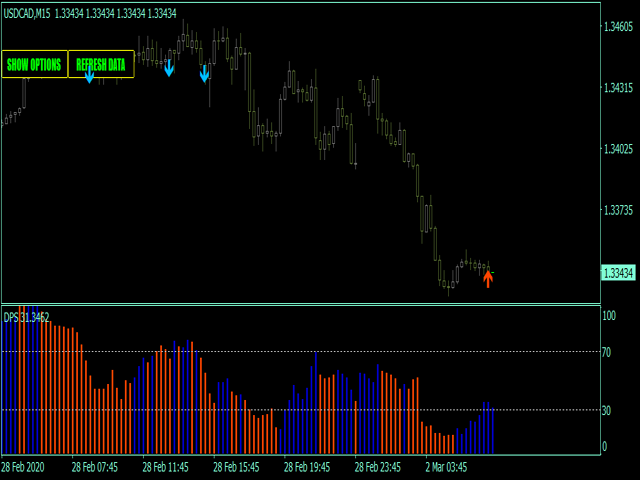
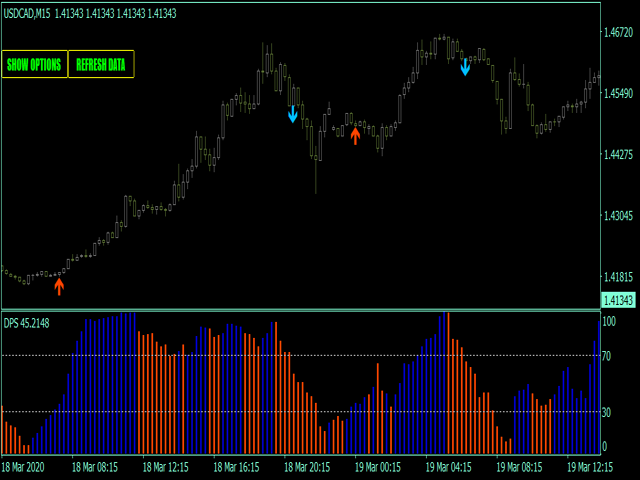
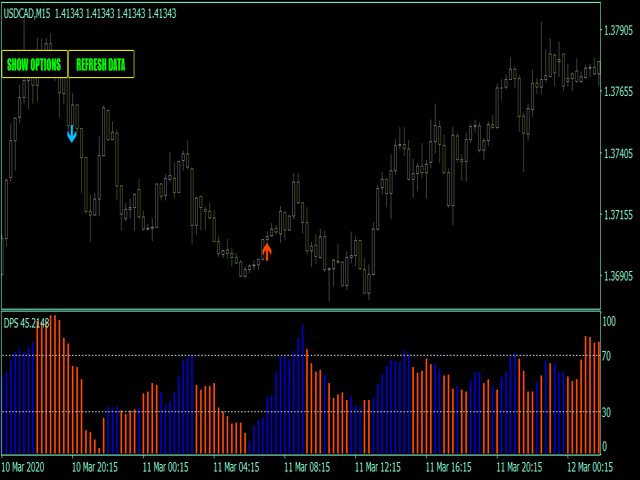
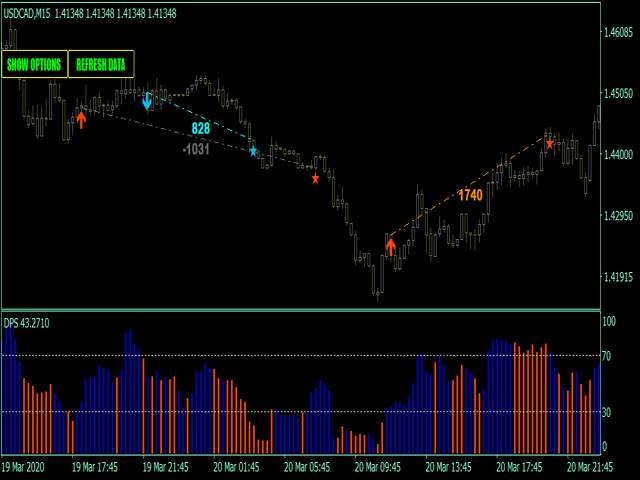
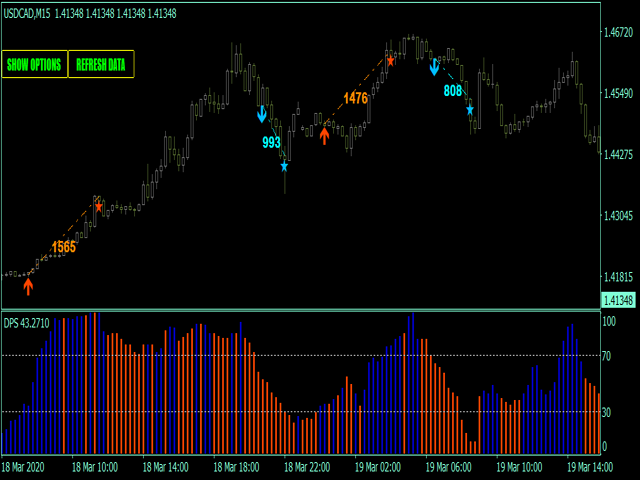
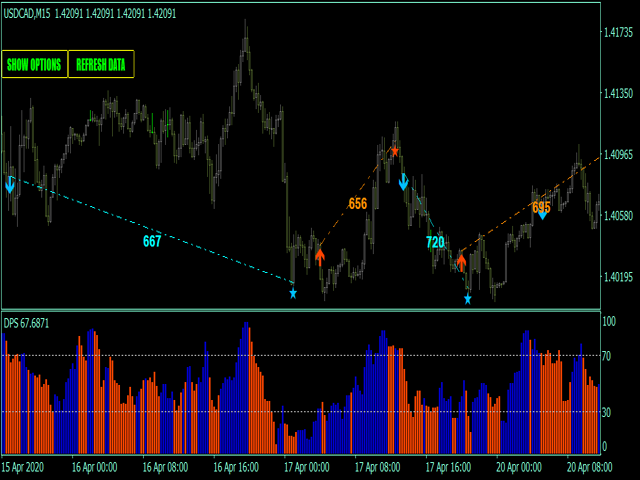
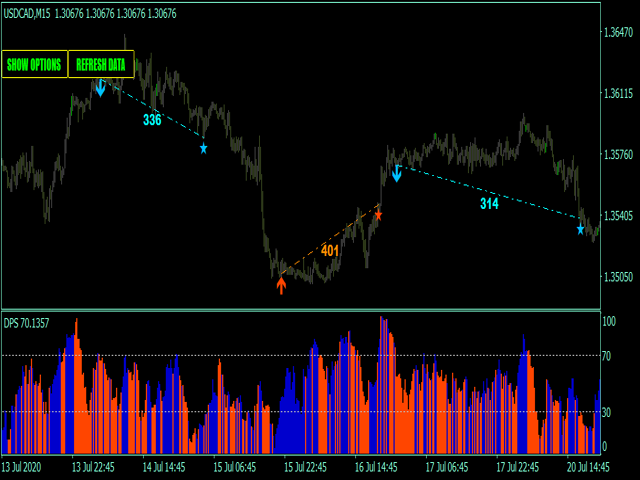
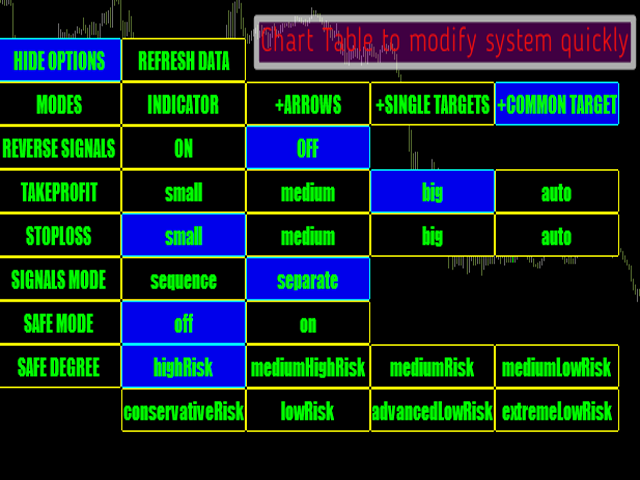
Demarker pullback system - es el sistema de trading manual para mercados agitados. Muestra un histograma de 2 colores.
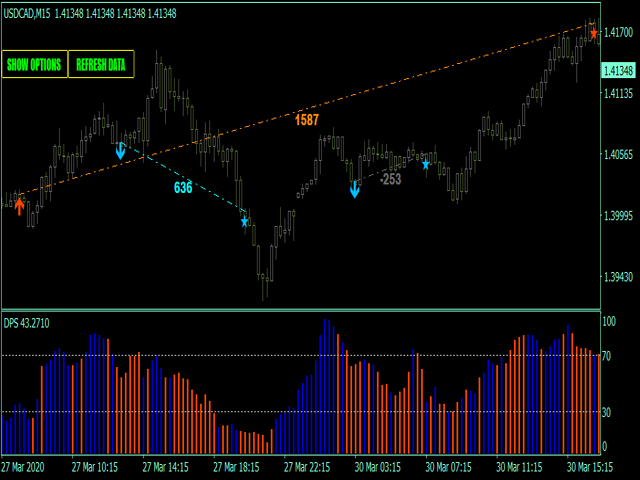
Cuando el histograma es azul - el mercado es bastante alcista, cuando el histograma es naranja - el mercado es más bajista. La flecha hacia arriba se traza cuando el histograma está en la zona de sobreventa, pero de color azul. La flecha hacia abajo se traza cuando el histograma está en zona de sobrecompra pero de color naranja.
Estos patrones muestran falsa ruptura y posible pronto inversa (el precio está sobrecomprado, pero muestra signos bajistas y el precio está sobrevendido, pero muestra signos alcistas).
Principales características del indicador:
- Las señales no se repintan, se retrasan o desaparecen;
- Cada señal viene en la apertura de la nueva barra(sistema utiliza sólo las señales confirmadas);
- Indicador tiene alertas, correo y notificaciones Push (permite el comercio fuera de la PC, desde el teléfono inteligente / aplicación móvil);
- Indicador tiene objetivos de ganancias / pérdidas;
Recomendaciones para el comercio
- EUR/GBP, EUR/JPY, USDJPY, NZD/USD;
- Mejores plazos - desde M5 hasta H1;