Currency Strength Meter MT4 Indicator by PipTick
- Indicadores
-
Michal Jurnik
 "Talent is cheaper than table salt. What separates the talented individual from the successful one is a lot of hard work." - Stephen King. Those few words reflect myself very well. I am probably not the most talented developer in the world but I truly believe in hard work, professional attitude and
 - Versión: 6.0
- Actualizado: 1 septiembre 2022
- Activaciones: 5
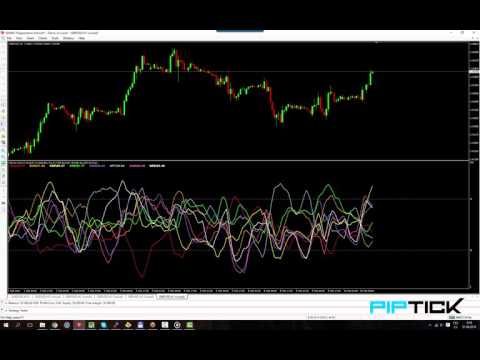
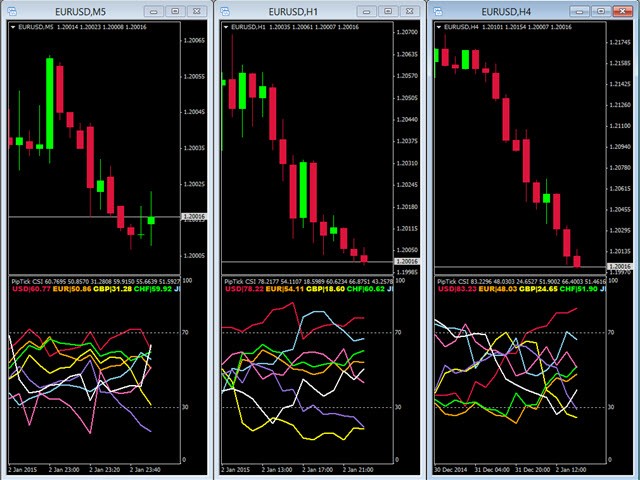
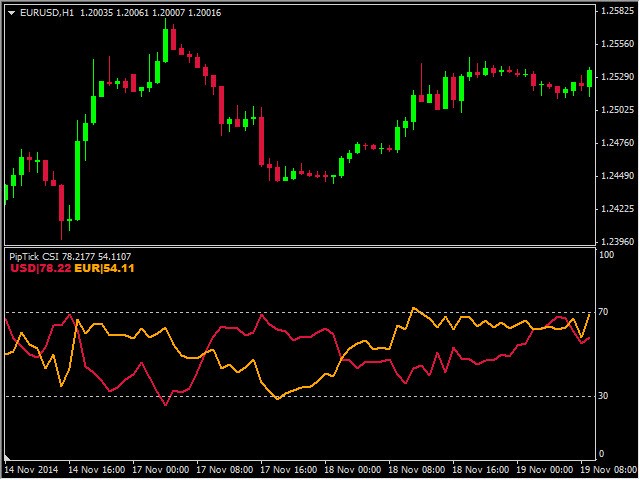
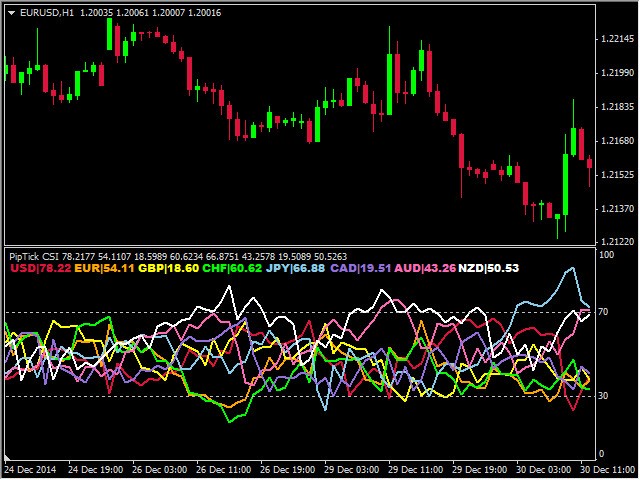
Conocer la fuerza y la debilidad de cada divisa es vital para todo operador de Forex. Nuestroindicador Currency Strength Meter mide la fortaleza de ocho divisas principales (USD, EUR, GBP, CHF, JPY, CAD, AUD, NZD) mediante el indicador Relative Strength Index, también conocido como RSI. El indicador Currency Strength Meter le muestra, de forma sencilla y rápida, cuándo una divisa está sobrevendida, sobrecomprada o en "zona normal". De este modo, podrá identificar qué divisa es la más fuerte y cuál la más débil.
Nuestro indicador se calcula a partir de 28 pares de divisas y funciona en todas las plataformas MT. Elindicador Currency Strength Meter utiliza sólo siete pares de divisas para calcular el resto de los 21 pares. Por lo tanto, para el correcto funcionamiento del indicador, sólo necesita estos siete pares en su plataforma MT: EURUSD, GBPUSD, AUDUSD, NZDUSD, USDJPY, USDCHF y USDCAD.
Nota: Si el indicador se utiliza en el Probador de Estrategias, los datos de todos los pares deben descargarse antes en el Centro de Historiales (Cómo). No es necesario descargar nada si se añade al gráfico como de costumbre.
Interpretación del indicador
Dado que nuestro indicador CSM se basa en indicadores bien conocidos, su interpretación es sencilla.
RSI
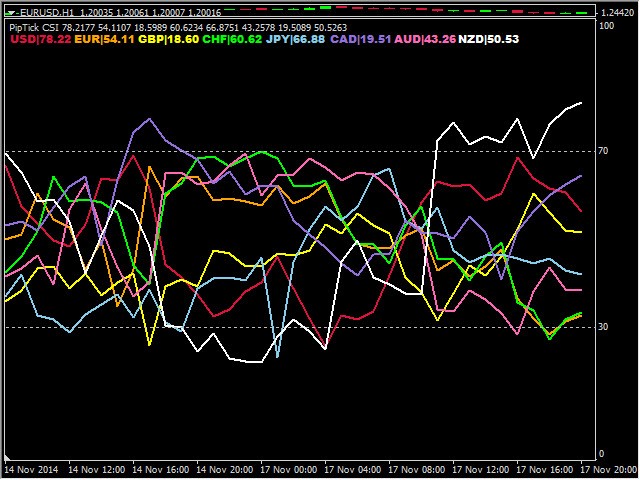
- Zona de sobreventa (el valor de CSM está por debajo del nivel de 30)
- Zona normal (el valor del CSM está entre los niveles de 30 y 70)
- Zona de sobrecompra (el valor del CSM está por encima del nivel de 70)
- Divisa fuerte (el valor del CSM está por encima del nivel de 50)
- Divisa débil (el valor del CSM está por debajo del nivel de 50)
CCI
- Zona de sobreventa (el valor de CSM está por debajo de 100)
- Zona normal (el valor del CSM está entre -100 y 100)
- Zona de sobrecompra (el valor de CSM está por encima de 100)
- Divisa fuerte (el valor de CSM está por encima del nivel de 0)
- Divisa débil (el valor del CSM está por debajo del nivel de 0)
IMF
- Zona de sobreventa (el valor de CSM está por debajo del nivel de 30)
- Zona normal (el valor del CSM está entre los niveles de 30 y 70)
- Zona de sobrecompra (el valor de CSM está por encima del nivel de 70)
- Divisa fuerte (el valor del CSM está por encima del nivel de 50)
- Divisa débil (el valor del CSM está por debajo del nivel de 50)
MACD
- Divisa fuerte (el valor de CSM está por encima del nivel de 0)
- Divisa débil (el valor de CSM está por debajo del nivel 0)
¿Cómo utilizar el indicadorCurrency Strength Meter?
Existen dos métodos básicos para operar con divisas fuertes y débiles:
- Comprar divisas fuertes y vender divisas débiles - Estrategia de seguimiento de tendencias. Por ejemplo, si el EUR se fortalece y el AUD se debilita, compre el par de divisas EURAUD. No opere si una de las divisas está sobrecomprada/sobrevendida.
- Vender divisa fuerte y comprar divisa débil - Estrategia de contratendencia. Por ejemplo, si el USD está sobrecomprado y el JPY sobrevendido, venda USDJPY.
Puede obtener grandes resultados si utiliza el concepto de sobrecompra/sobreventa de divisas junto con la acción del precio o los patrones de velas. Todo lo que tiene que hacer es esperar a la sobrecompra/sobreventa de una divisa, seguido de dibujar un patrón de velas como un martillo o una estrella fugaz. Por supuesto, esta es sólo una de las miles de formas posibles de utilizar nuestro indicador de fuerza de la divisa.
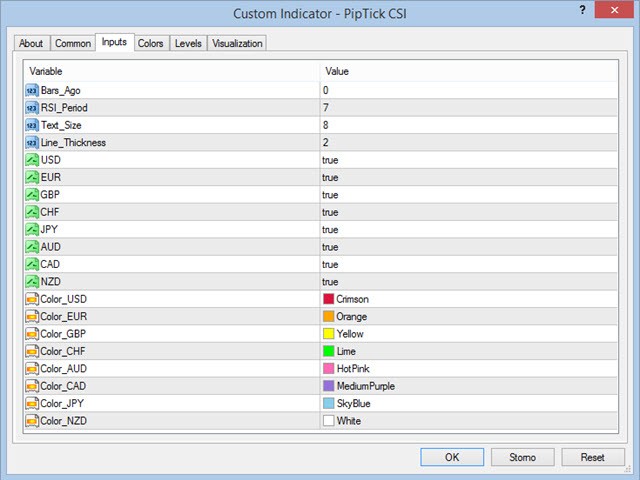
Es posible utilizar el indicador CSM para backtest manual también. Todo lo que tiene que hacer es establecer el parámetro "Bars_Ago = 0" en la configuración del indicador y descargar los datos históricos de siete pares de divisas que nuestro indicador necesita para calcular.
Características principales
- El indicador muestra la fuerza y la debilidad de ocho divisas principales (USD, EUR, GBP, CHF, JPY, CAD, AUD, NZD)
- Una simple comparación de una divisa frente a otra
- Zona de sobrecompra y sobreventa para entrar o salir de las operaciones
- Funciona en todos los marcos temporales
- El indicador no repinta
- Listo para backtesting
- Parámetros personalizables
- Excelentes resultados en conjunción con patrones PA y Candlestick
- Herramienta ideal para scalping
- Cálculo muy rápido
- El indicador funciona también con prefijos y sufijos de símbolos
- Disponible para MT4 y MT5
Por favor, visite lapágina de producto del indicador Currency Strength Meter para la configuración de entradas y salidas.
Very useful to assess currency strengths, and to time entry and exits. I would say the reversal (overbought/oversold) strategy is the most efficient.