Acceleration Force Meter Indicator MT4
- Indicadores
- Versión: 1.10
- Actualizado: 22 septiembre 2022
- Activaciones: 5

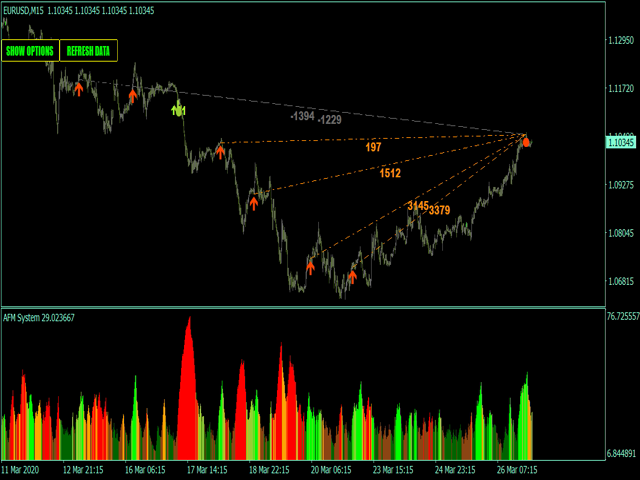
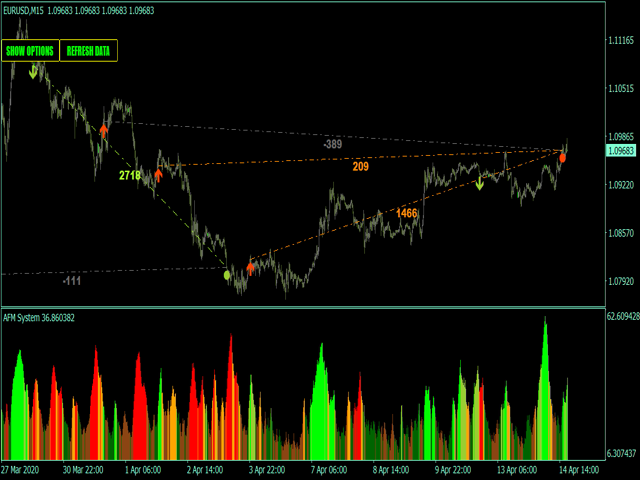
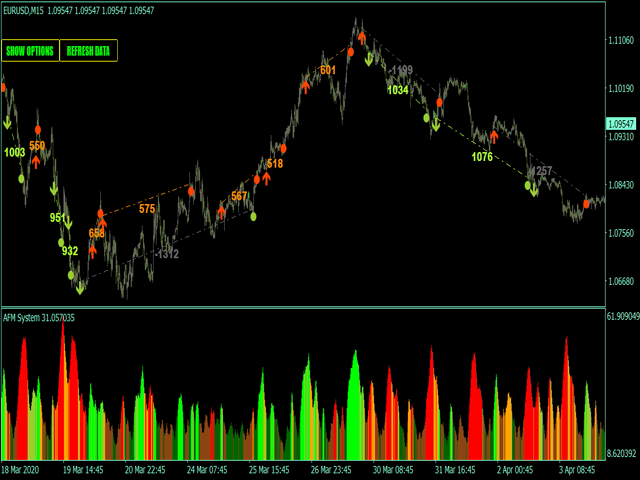
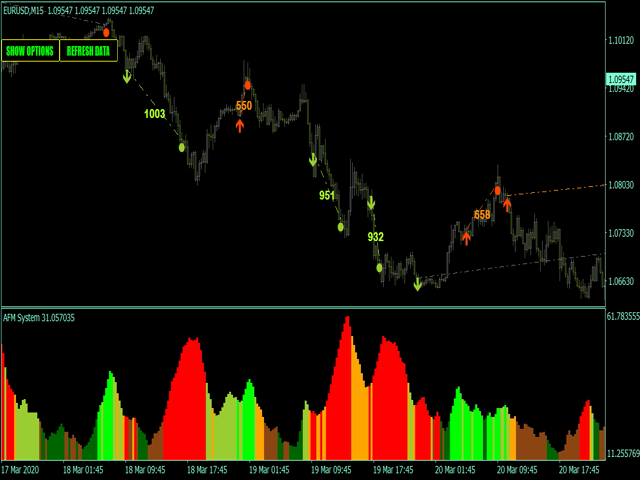
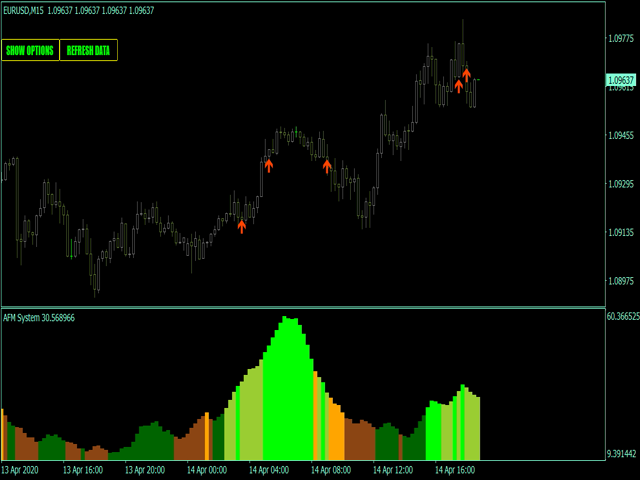
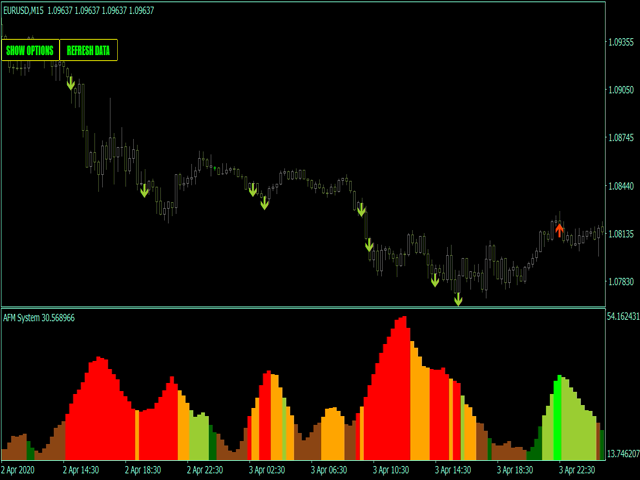
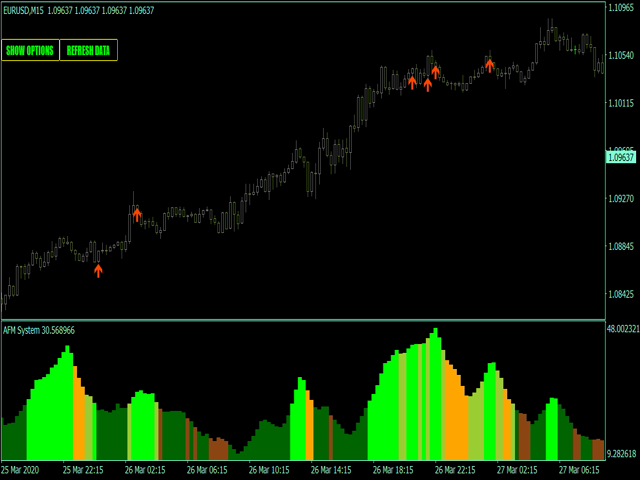
Acceleration Force Meter Indicator - es un sistema de tendencia que se une al mercado en la fase de tendencia y después de la tendencia pull-back. Indicador AFM - es el sistema que observa las fases del mercado desde planas hasta volatilidad extrema y prefiere entrar en el mercado cuando está activo, más volatilidad, ignorando la mayoría de los lugares planos.
Es un sistema de trading 100% completo que incluye puntos de entrada y salida. Funciona bien con operaciones rentables - maximizando los objetivos de ganancias (análisis de la volatilidad reciente del mercado, su rango de pips para adaptar los objetivos de ganancias actuales), también funciona con pérdidas eligiendo el punto de salida más adecuado con una pérdida mínima. Sólo tienes que tener un poco de paciencia y el sistema posiblemente te hará feliz.
Características principales del indicador
- Las señales no se repintan, no se retrasan o desaparecen;
- Cada señal viene en la apertura de la nueva barra (sistema utiliza sólo las señales confirmadas);
- Indicador tiene alertas, correo electrónico y notificaciones Push (permiten el comercio fuera de la PC, desde el teléfono inteligente / aplicación móvil);
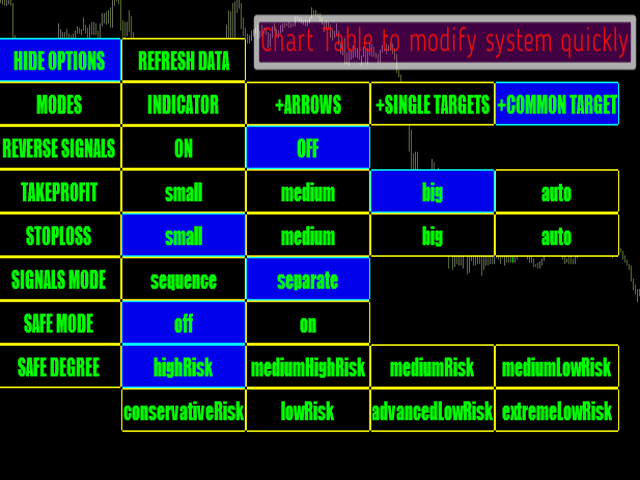
- El sistema es 100% autoadaptive sin necesidad de ajuste manual. Sólo tiene que configurar y empezar a operar.
Recomendaciones para el comercio
- 5-60 min timeframes es la mejor opción;
- Volatilidad / Tendencia pares (EURUSD, GBPUSD, USDCHF, GBPJPY etc.) con pequeños swaps, Oro y Cripto mercados;

El usuario no ha dejado ningún comentario para su valoración