Trend driver bars Iindicator MT4
- Indicadores
- Versión: 1.30
- Actualizado: 22 septiembre 2022
- Activaciones: 5

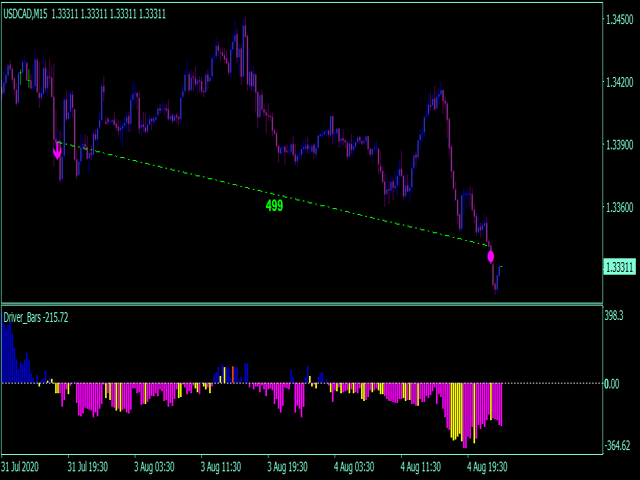
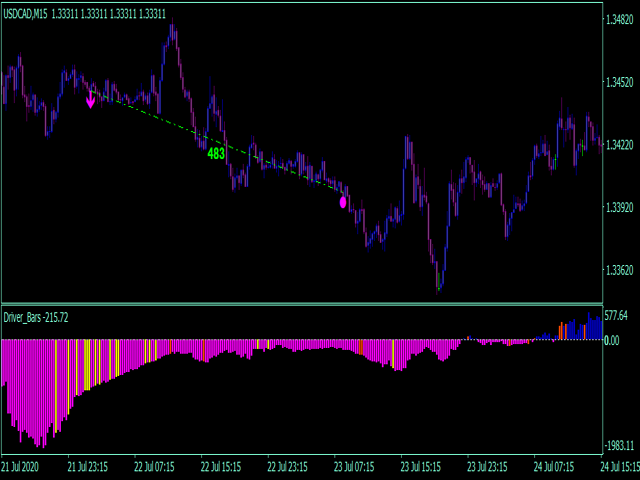
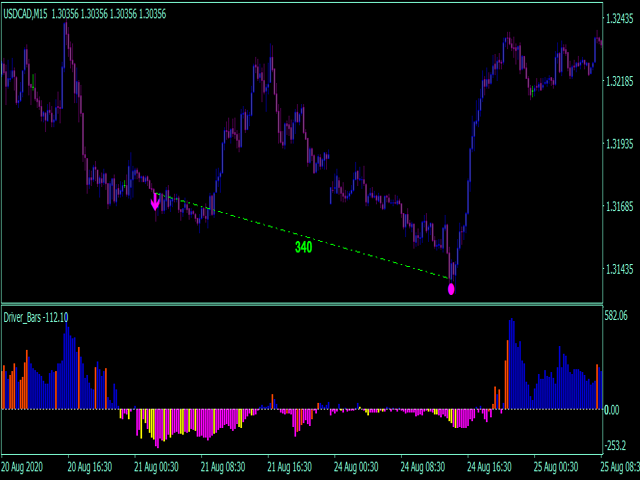
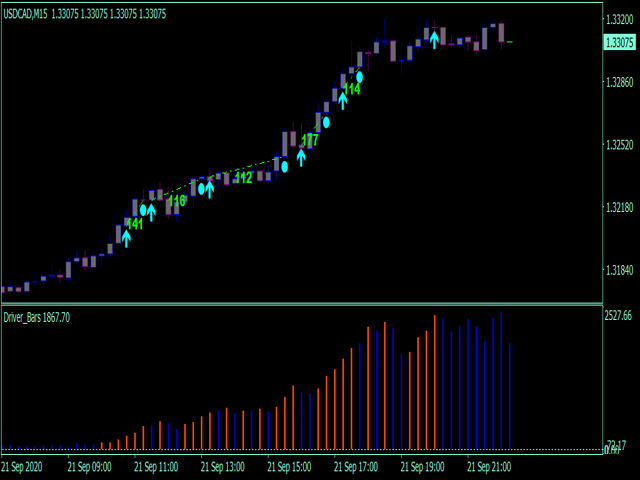
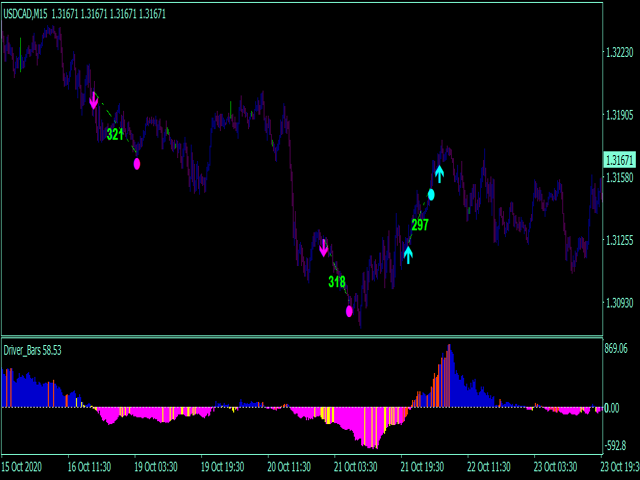
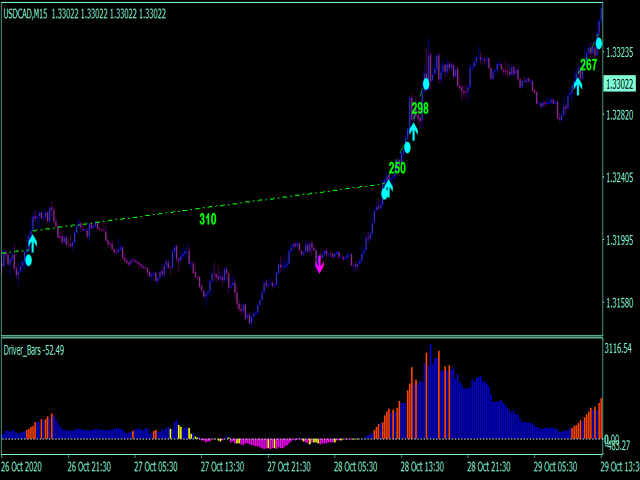
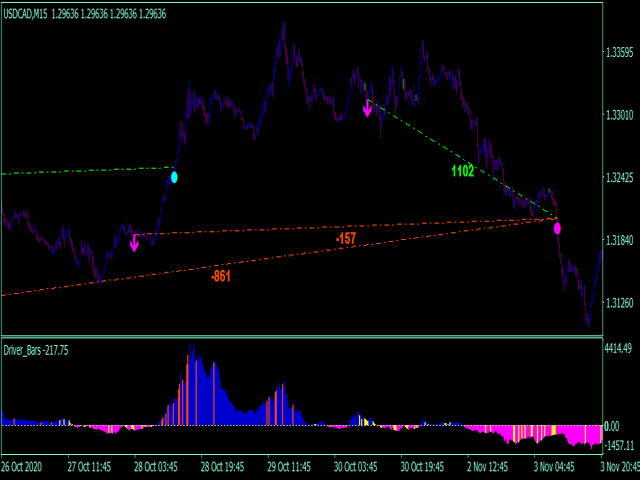
Las barras conductoras de tendencia son un sistema de negociación manual que define la continuación de la tendencia actual o su retroceso/inversión. Barras "conductoras" - son patrones de acción del precio que tienen un poderoso efecto en el mercado, definiendo su dirección futura cercana. Generalmente, las barras conductoras representan el "esqueleto" de la tendencia y a menudo anticipan un nuevo impulso del mercado. El sistema traza flechas cuando el mercado muestra 3 patrones seguidos (el patrón combinado más poderoso), y hace scalping rápido del movimiento entrante. Pérdida de posiciones se cierra por el beneficio común. Aumento del lote nunca se utiliza. Sistema de cobertura de posiciones para minimizar los riesgos.
Principales características del indicador
- Las señales no se repintan, no se retrasan o desaparecen (excepto en los casos en los que el sistema recalcula todos los datos históricos, actualiza la configuración principal o Metatrader actualiza los nuevos datos entrantes);
- Cada señal viene en la apertura de la nueva barra (el sistema utiliza sólo las señales confirmadas);
- Indicador tiene alertas, correo y notificaciones Push(permitir el comercio fuera de la PC, desde el teléfono inteligente / aplicación móvil);
- El sistema es 100% autoadaptive sin necesidad de ajuste manual. Sólo tiene que configurar y empezar a operar.
- Posibilidad de desactivar la estrategia de flecha y utilizar sólo histograma.
Recomendaciones para el comercio
- Scalping timefrsmes: Rango M5-H1;
- Pares de volatilidad como EURGBP, GBPJPY, USDJPY, GOLD, Crypto;